Our Free Indicators are available for a lifetime with no cost or subscription. Get an edge on the market now.
Our Premium NinjaTrader 8 Indicators provide sophisticated analysis to enhance your trading experience.
Get Your Fully/Semi-Automated Strategy from our cutting-edge collections made for the NinjaTrader 8 platform
Get your custom Trading Indicators, Automated Strategy and Add-Ons coded by our expert team for the NinjaTrader 8 trading platform. Got an idea? Get a free quote for it today.
Explore our collection of professional NinjaScript source codes with detailed tutorials. Learn from real-world examples and accelerate your trading development.
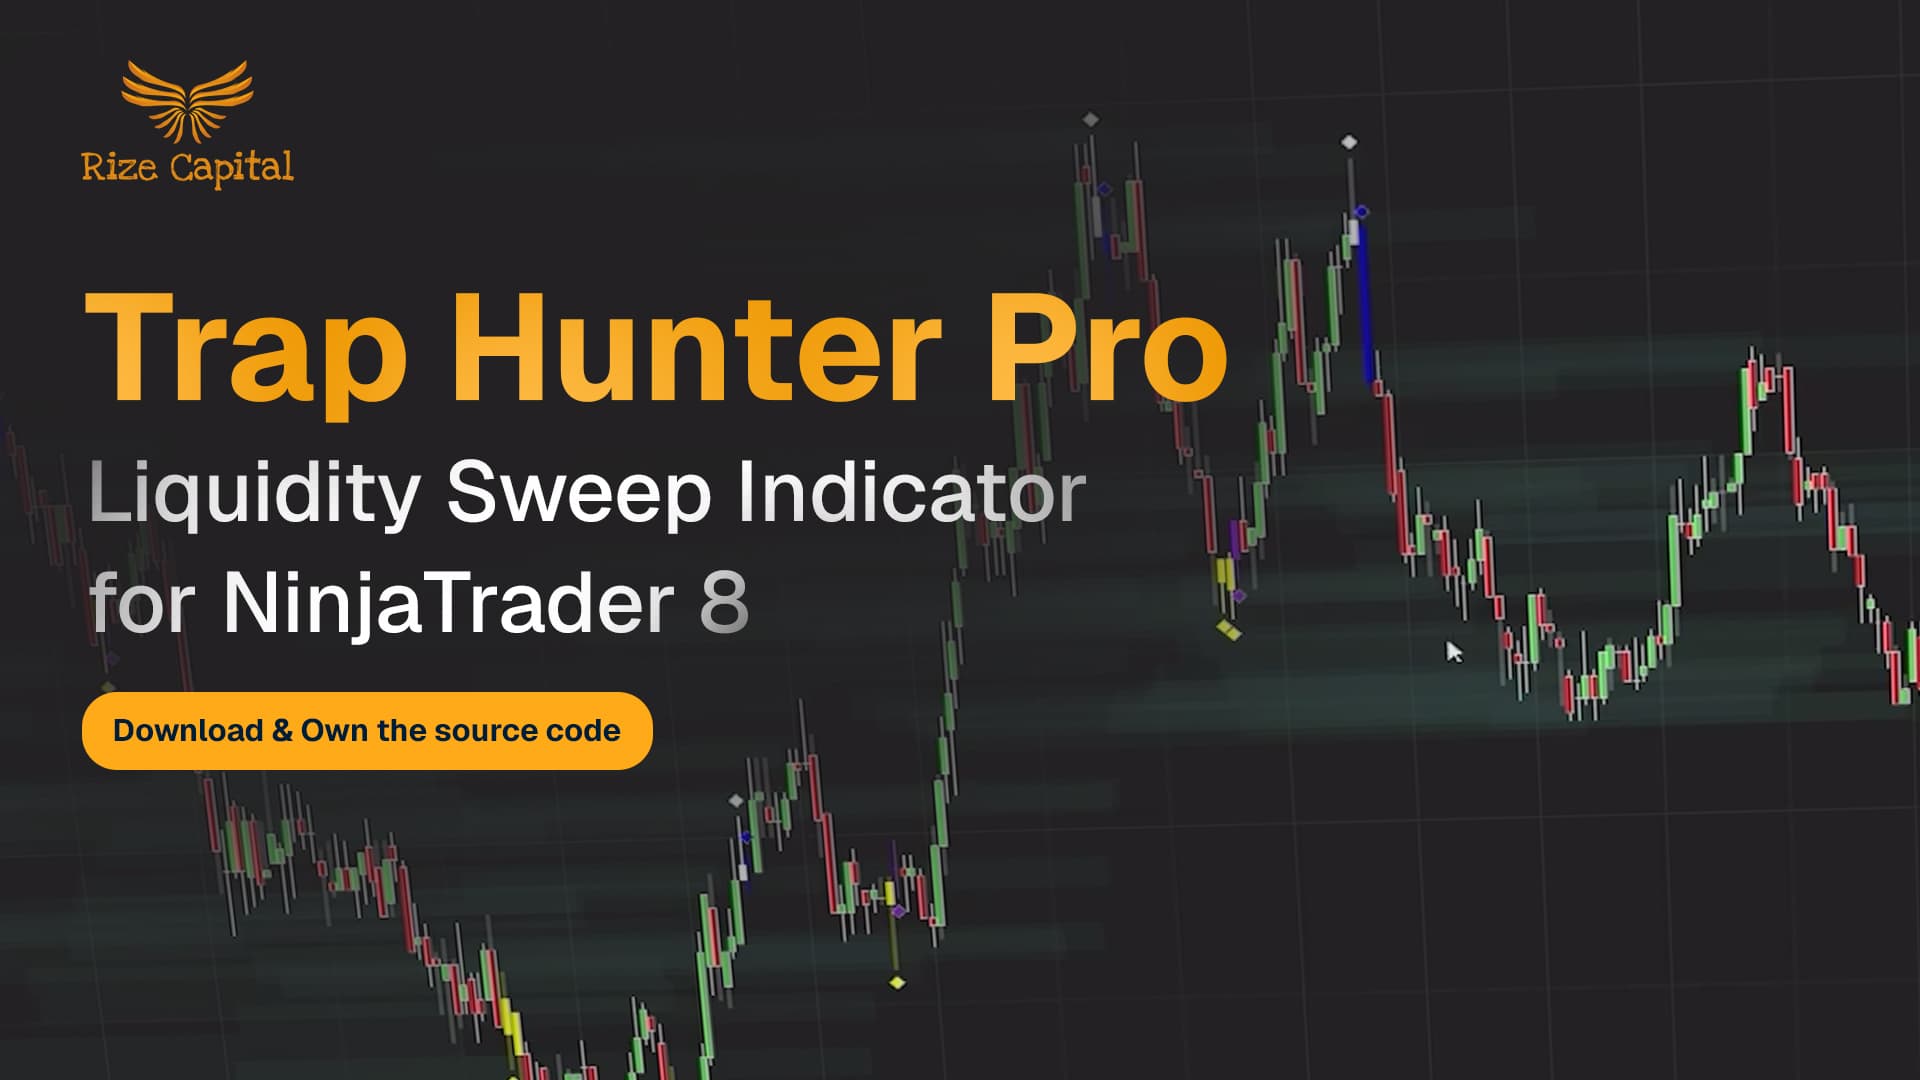
This is one of the best NinjaTrader indicators that specialises in identifying liquidity traps and stop hunt scenarios across any instrument and timeframe, automatically detecting when price sweeps beyond key levels only to reverse direction and trap breakout traders. The indicator uses a comprehensive diamond signal system with yellow diamonds signalling downward sweeps with rejection potential, white diamonds indicating upward sweeps trapping buyers, and purple/blue diamonds providing reclaim confirmation when price moves back beyond the swept levels. When you purchase Trap Hunter Pro from Rize Capital, you receive the complete NinjaScript source code and a comprehensive tutorial video, providing total freedom to modify the indicator, integrate it into automated strategies, or adapt the detection logic to your specific trading requirements with no restrictions whatsoever.
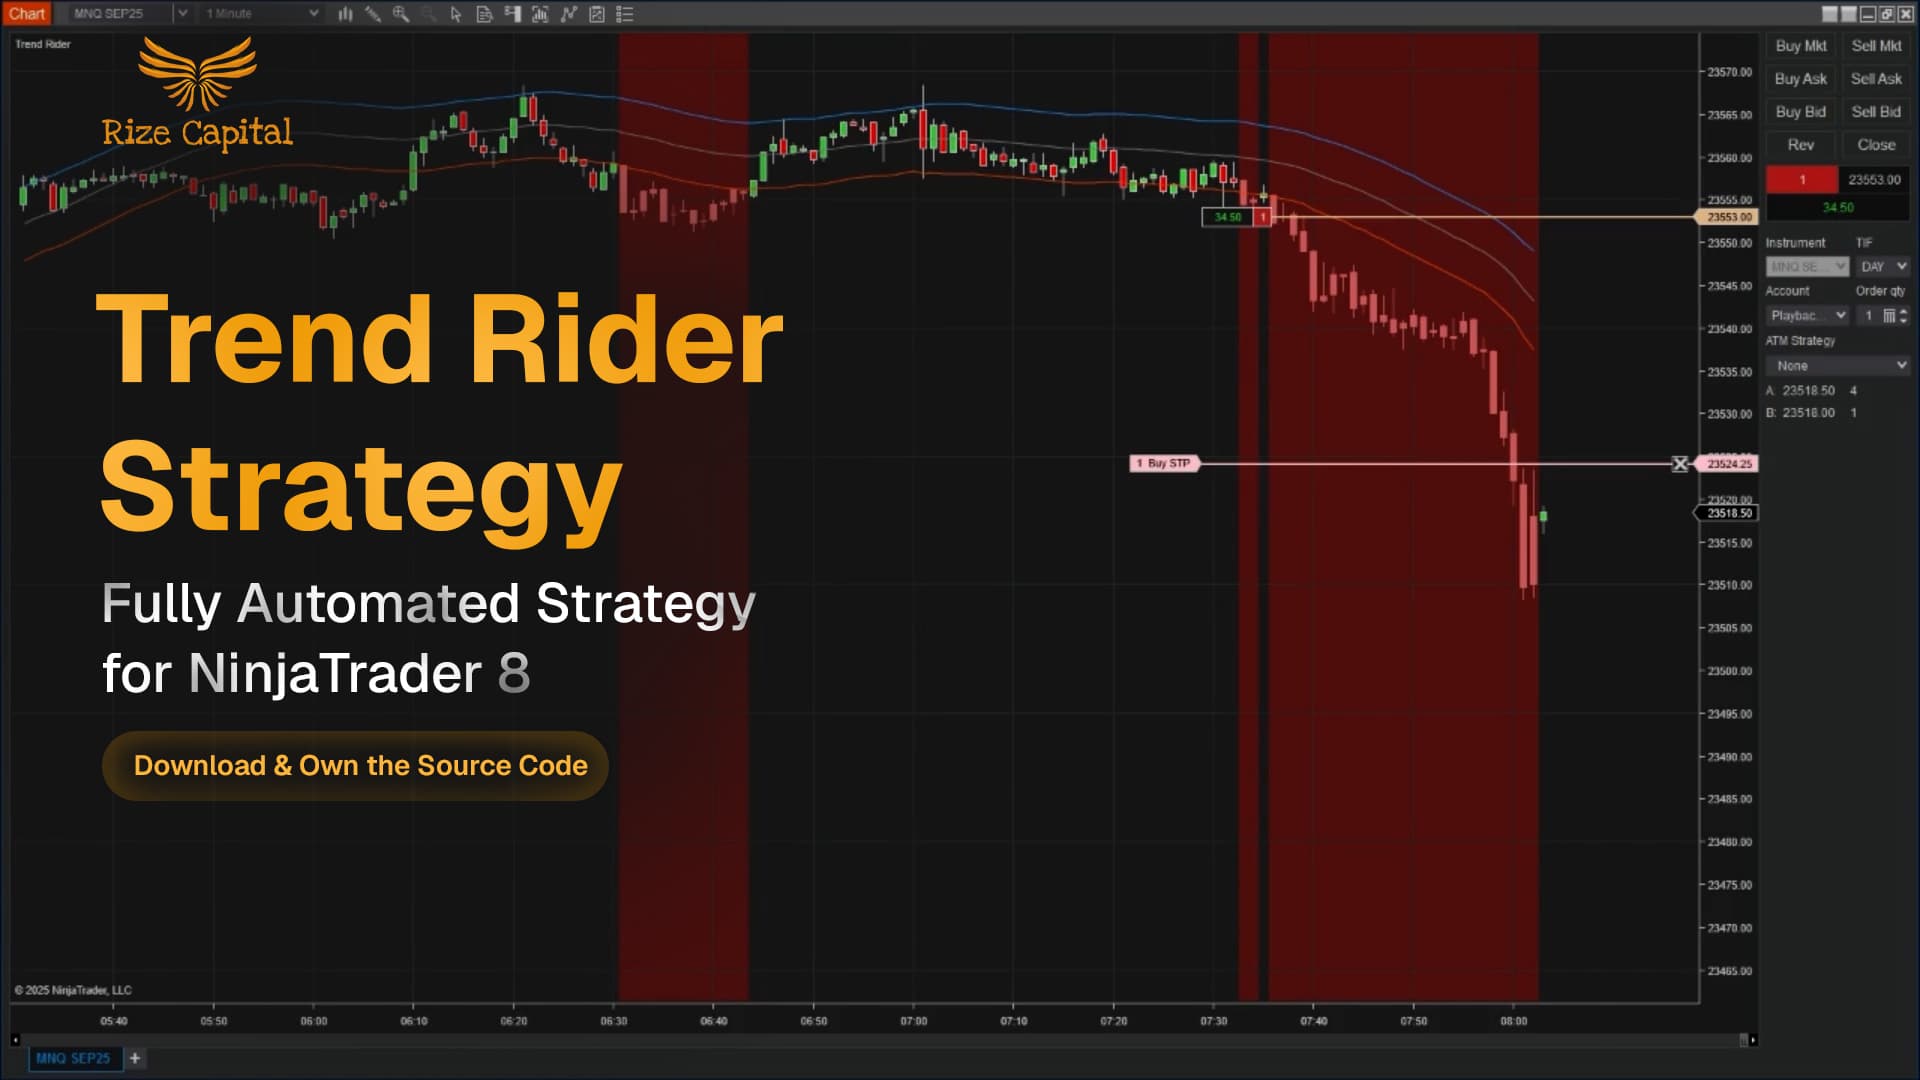
The Trend Rider Strategy for NinjaTrader 8 is a professional-grade automated trading strategy that combines linear regression slope analysis with ATR-based volatility bands to capture strong directional moves while filtering out choppy market conditions. Developed by Rize Capital, the Trend Rider Strategy automatically enters long positions when the slope is positive and price breaks above the volatility band, and short positions when the slope is negative and price breaks below the band, with each trade protected by adaptive stop loss management and step-based trailing logic that progressively locks in profits as trends develop. The trend following strategy comes with complete source code ownership, allowing advanced users to customise the logic to their specific trading requirements and risk tolerance. Check out our video for a full NinjaScript tutorial.
The Simple EMA Indicator is one of the best free NinjaTrader 8 indicators that combines dual Exponential Moving Averages with intuitive visual arrow signals. This helps identify momentum shifts and optimal entry/exit points across all market conditions. Provided by Rize Capital, the Simple EMA Indicator delivers precise trend change identification for day trading, swing trading, and position strategies, operating flawlessly on any timeframe and market instrument. Watch the video tutorial to learn how this streamlined EMA crossover system can transform your trend analysis approach. Lastly, you also get the full source code ownership to make any custom changes.
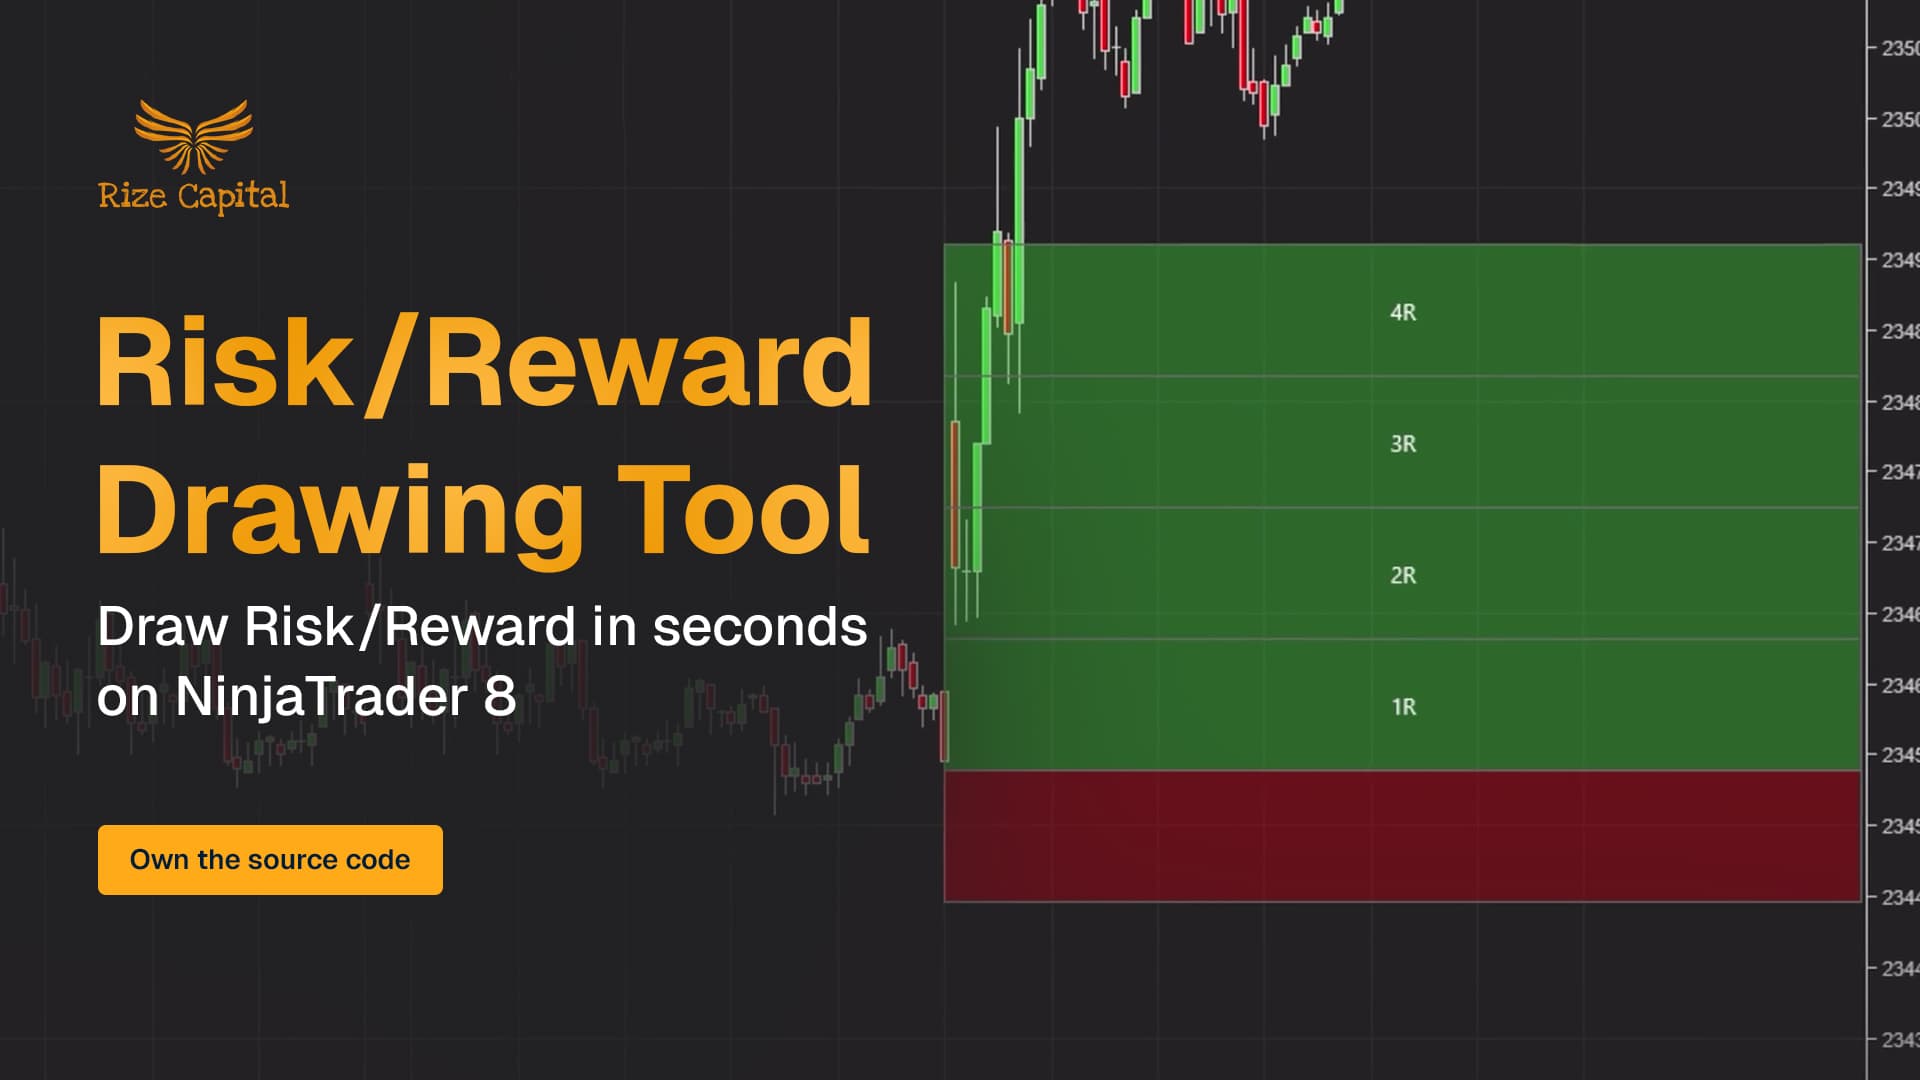
This professional NinjaTrader 8 drawing tool, made by Rize Capital, delivers instant risk-reward visualisation for day traders, swing traders, and position traders seeking a competitive edge. The NinjaTrader Risk Reward tool automatically detects trade direction and generates 1R to 4R reward targets with just two clicks - mark your entry, then your stop loss, and watch the tool create comprehensive risk boxes instantly. Most importantly, you receive the complete NinjaScript source code, allowing unlimited customisation and integration into your own strategies. This level of ownership and flexibility is rarely offered by other providers, making it an exceptional value for serious NinjaTrader 8 users. Check out the full tutorial video to learn more.
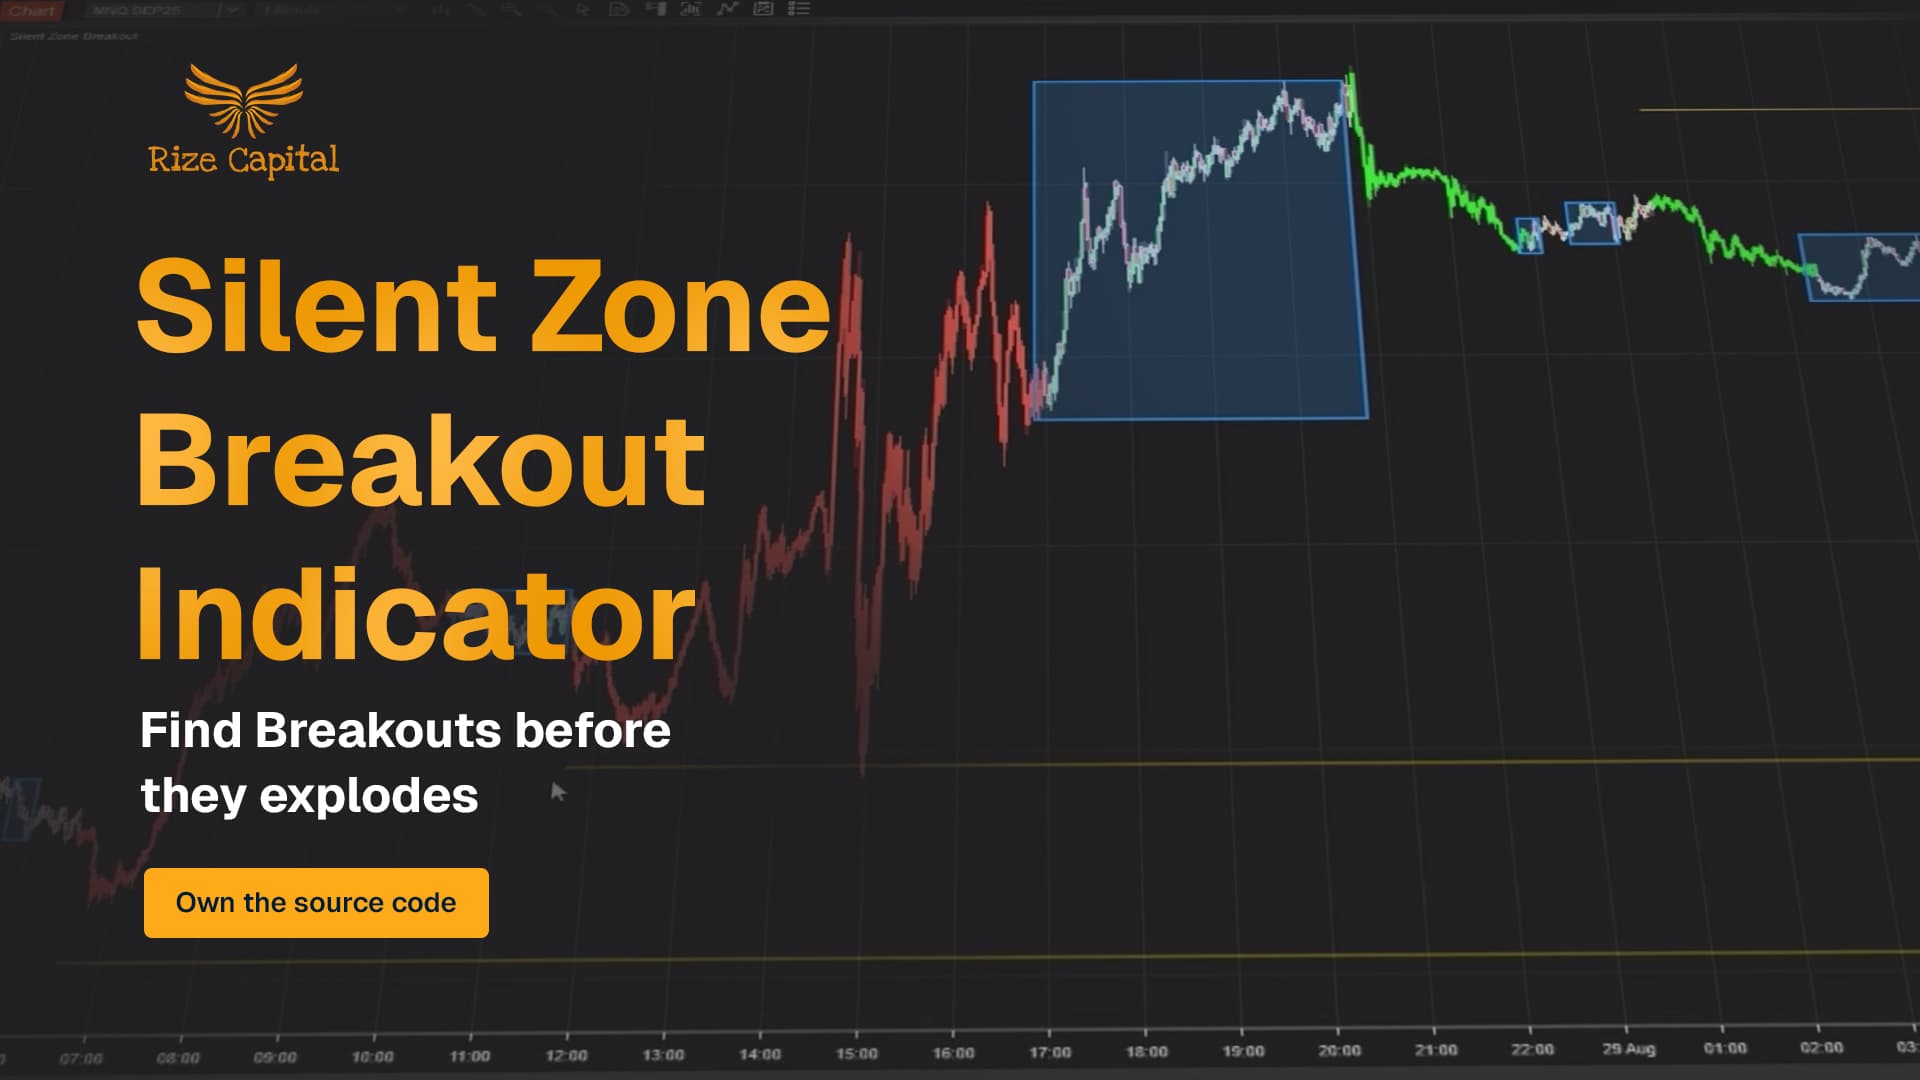
The Silent Zone Breakout Indicator for NinjaTrader 8 is an advanced breakout trading indicator that automatically detects price compression zones and highlights breakout signals with dynamic targets and visual confirmation. Provided by Rize Capital, this is one of the best indicators for breakout trading, delivering structured breakout analysis for scalping, day trading, and swing trading strategies, operating seamlessly on any market instrument with customisable sensitivity settings, target projections, and debounce logic to filter noise. Watch the video tutorial to learn how this systematic breakout detection system can enhance your breakout trading precision and timing. Lastly, you also get the full source code ownership to make any custom modifications or integrate it into your existing trading systems.
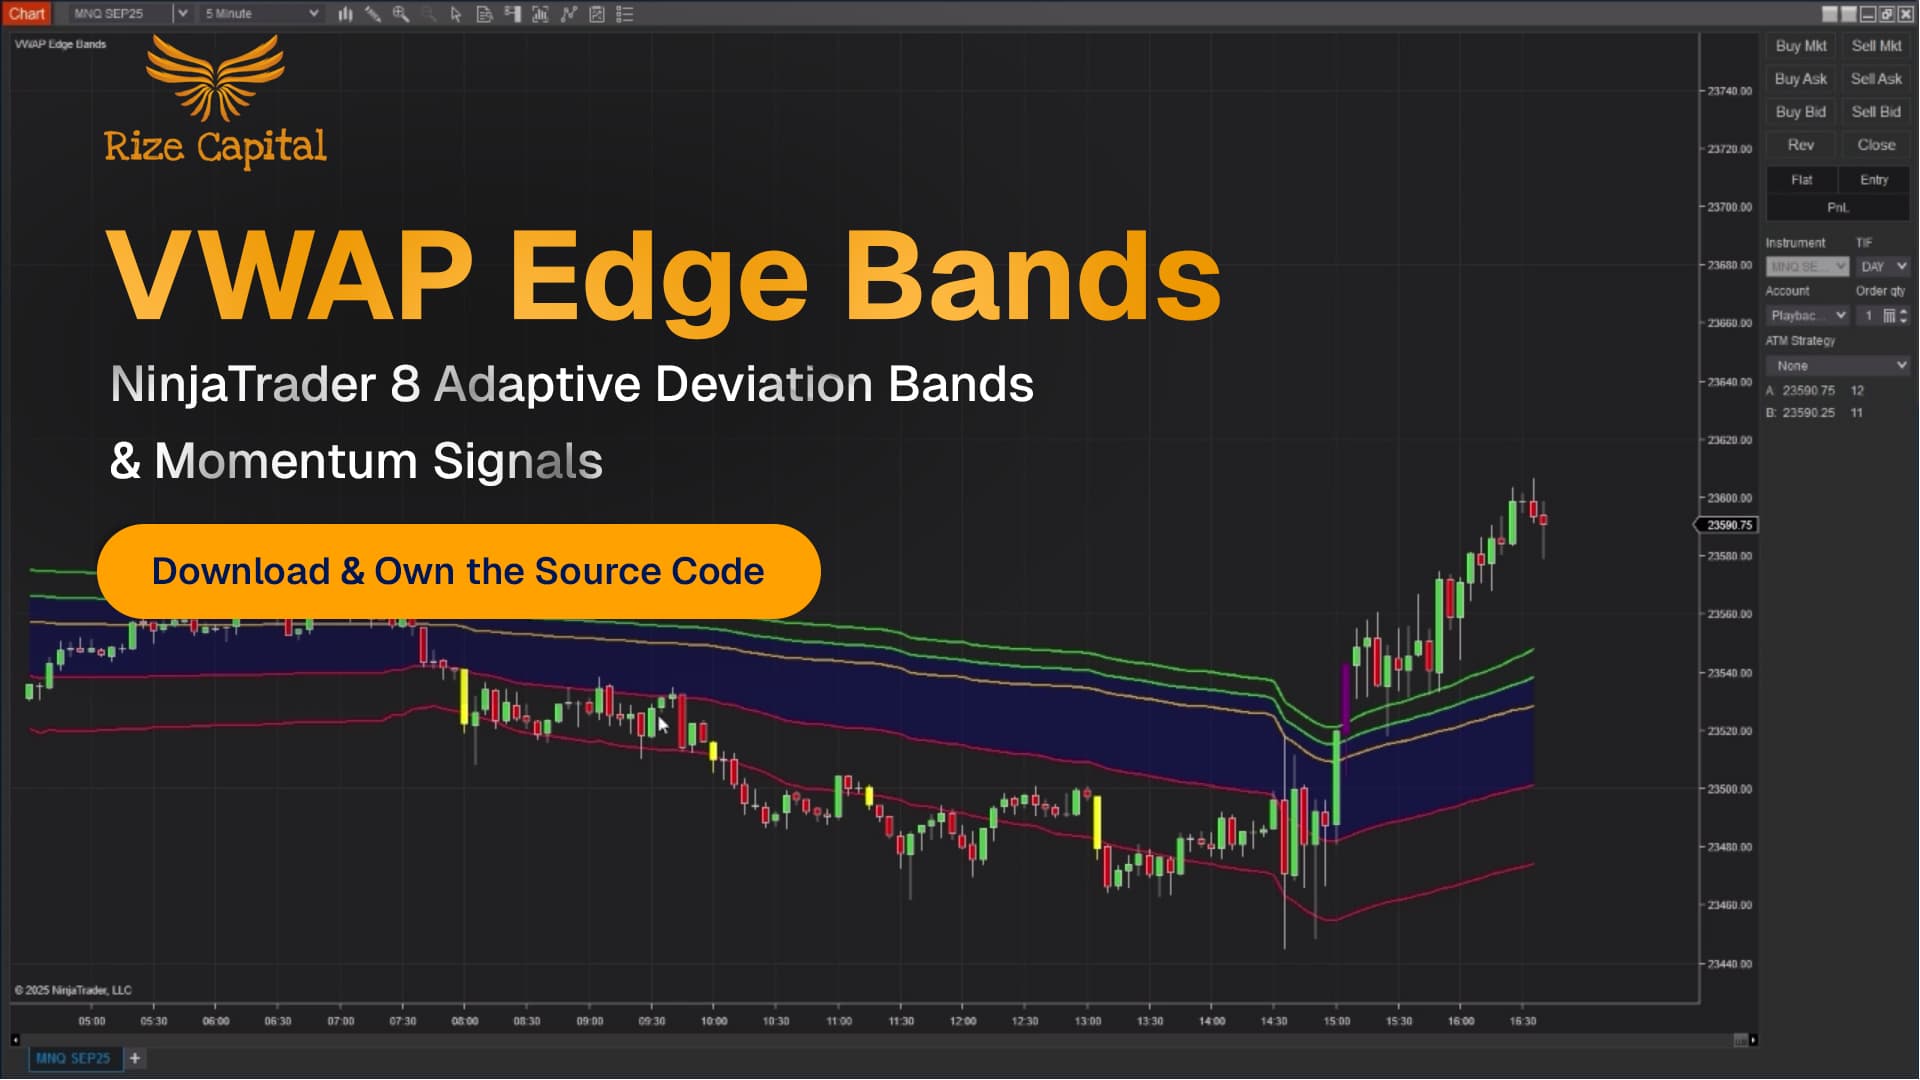
The VWAP Edge Bands is a professional-grade NinjaTrader VWAP indicator. It enhances the traditional Volume Weighted Average Price (VWAP) by incorporating adaptive, asymmetric deviation bands using rolling median absolute deviation calculations, designed to identify precise balance zones, breakouts, and mean reversion opportunities in real-time. When you purchase the VWAP Edge Bands from Rize Capital, you receive the complete NinjaScript source code, providing total freedom to modify the calculation logic, customise the band multipliers and visual parameters, or integrate the indicator into automated trading systems with no restrictions whatsoever. For a detailed overview, check out our video tutorial above.

The Turn Engine is a fully automated reversal trading strategy developed for NinjaTrader 8. It captures high-precision turning points by combining three powerful confirmation signals: rejection wicks measured as a percentage of candle range, volume spikes exceeding average participation by a customisable multiplier, and volatility compression detected through ATR analysis. The futures trading strategy waits for all three conditions to align before marking signal bars and triggering stop-limit entries only after price confirms the reversal by breaking past the signal candle high or low by a specified number of confirmation ticks, ensuring entries avoid premature signals and false moves. When you purchase the Turn Engine from Rize Capital, you receive the complete NinjaScript source code, providing total freedom of customisation. For a detailed overview, check out our video tutorial above.
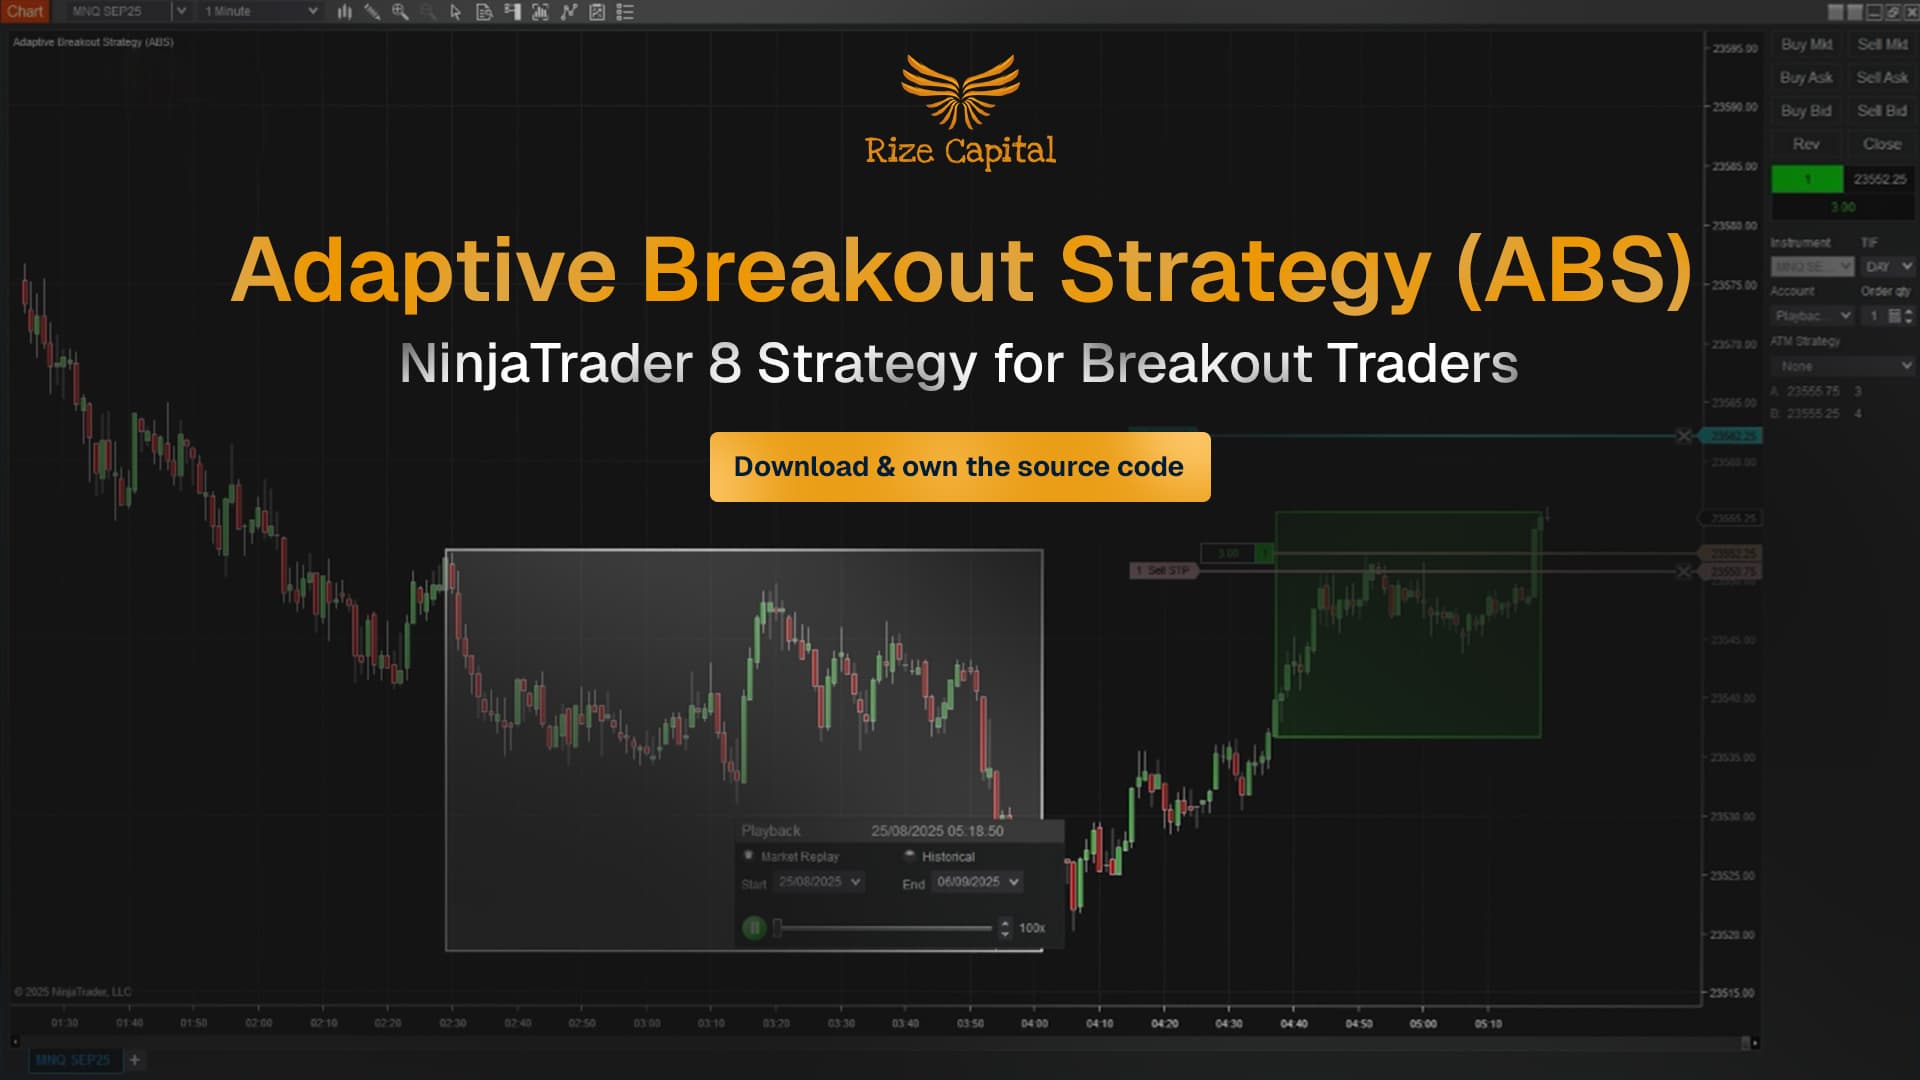
This is a fully automated breakout trading strategy developed for NinjaTrader 8 that works with any instrument in any financial market. This professional-grade strategy is specifically designed to capitalise on breakout opportunities by automatically detecting quiet market compression zones and executing disciplined breakout trades with comprehensive risk management. The Adaptive Breakout Strategy identifies low volatility consolidation periods where the market is "coiling" before potential explosive moves, automatically drawing compression zones on your chart and arming OCO breakout orders above and below each zone. The strategy features multiple preset configurations allowing you to tailor sensitivity to your trading style, built-in risk management with various stop loss placement options, trailing stops, and auto-healing bracket orders. Visual feedback is provided through colour-coded zones - white for neutral, lime green for long breakouts, and red for short breakouts. One of the most powerful features is the strategy's ability to resume operations seamlessly if you close your platform, automatically recalculating open positions when you restart. When you purchase the Adaptive Breakout Strategy from Rize Capital, you receive complete NinjaScript source code, meaning total freedom to modify the strategy, integrate it with other systems, or adapt the logic to your specific trading requirements with no restrictions whatsoever.

The TrendGuard Pullback Pro is a fully automated pullback trading strategy developed for NinjaTrader 8 that identifies and executes high-probability pullback entries within established trends. It combines a dynamic linear regression trend line with adaptive ATR-based volatility zones and volume confirmation to pinpoint precise continuation opportunities, automatically entering trades when price retraces into validated pullback zones with momentum backing. When you purchase the TrendGuard Pullback Pro from Rize Capital, you receive the complete NinjaScript source code. For a detailed overview, check out our video tutorial above.
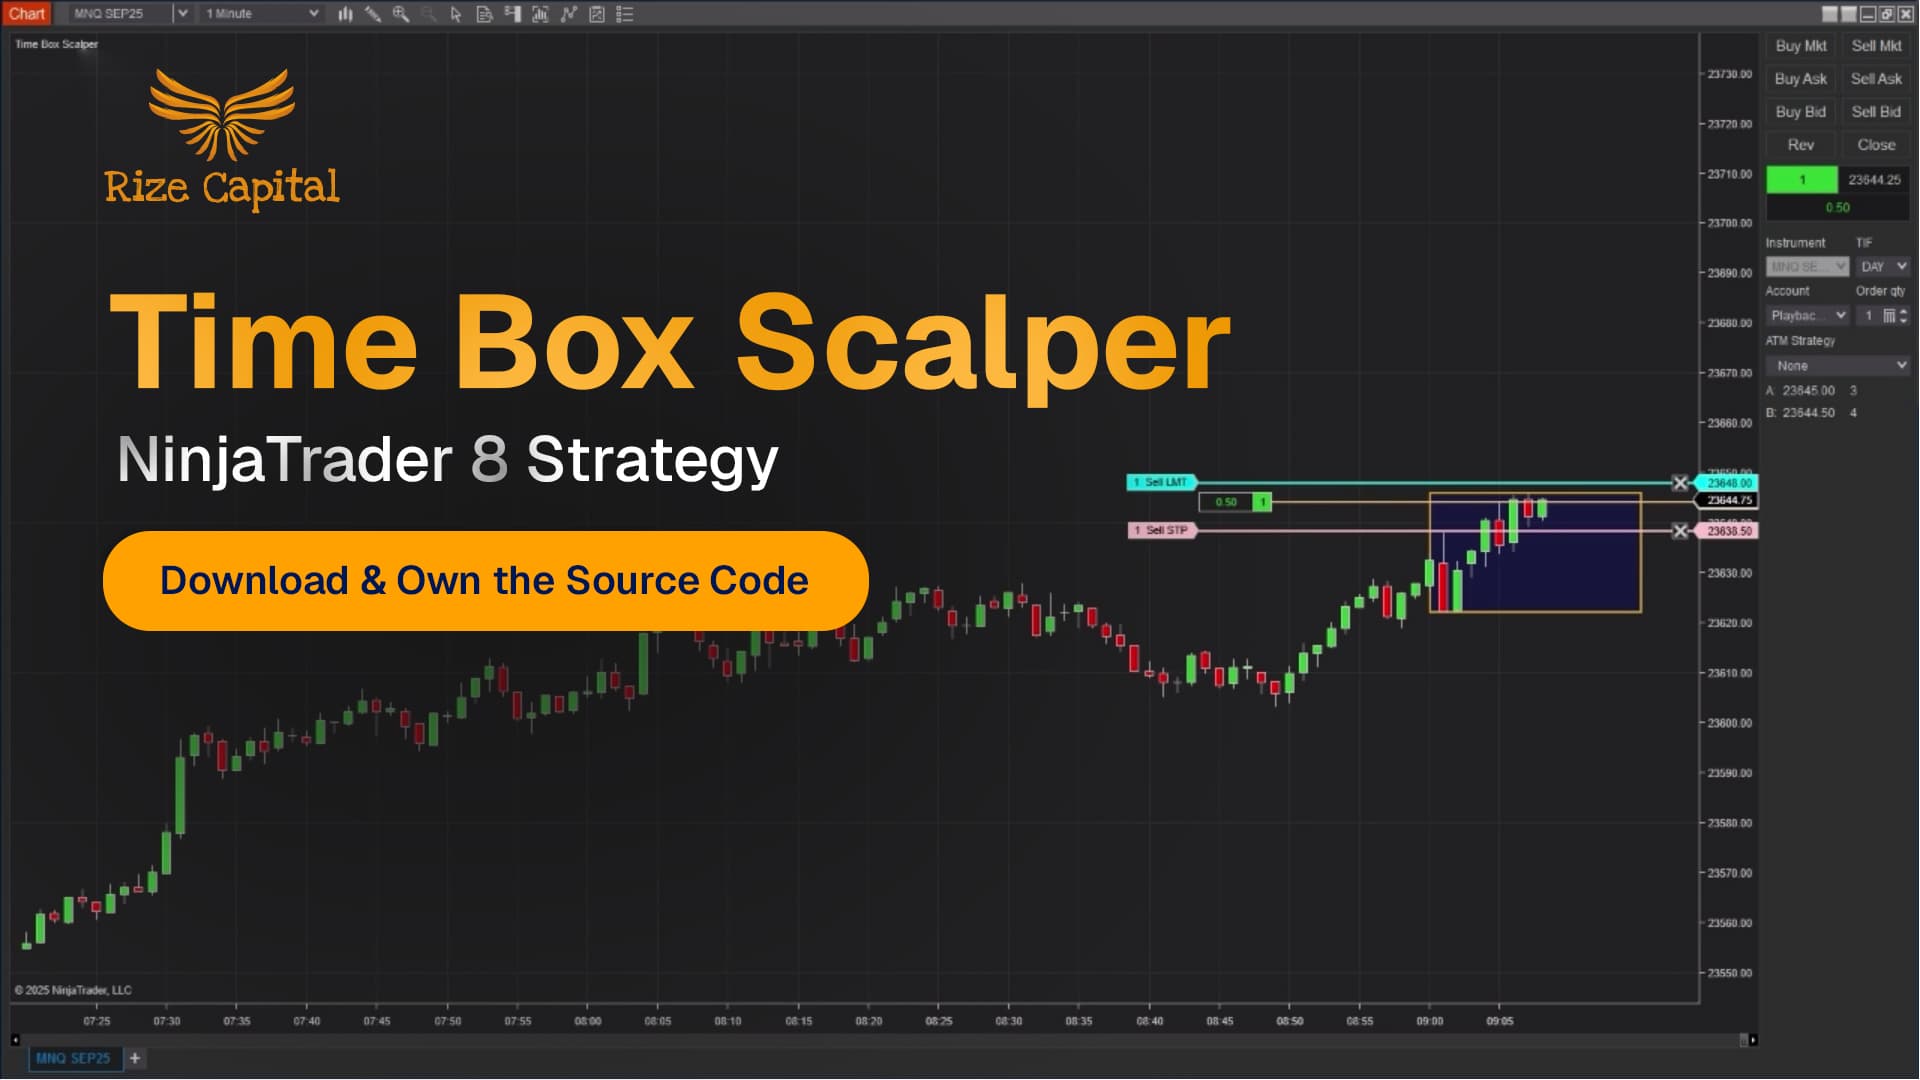
The Time Box Scalper Strategy is an advanced NinjaTrader scalping bot that identifies and captures high-momentum breakouts within fully customisable time windows. When you purchase the Time Box Scalper Strategy from Rize Capital, you receive the complete NinjaScript source code for the best scalping strategy, providing total freedom to modify the breakout detection logic, customise the time box parameters and momentum filters, adjust the news avoidance settings, or integrate the strategy into your own automated trading systems with no restrictions whatsoever. For a detailed overview, check out our video tutorial above.
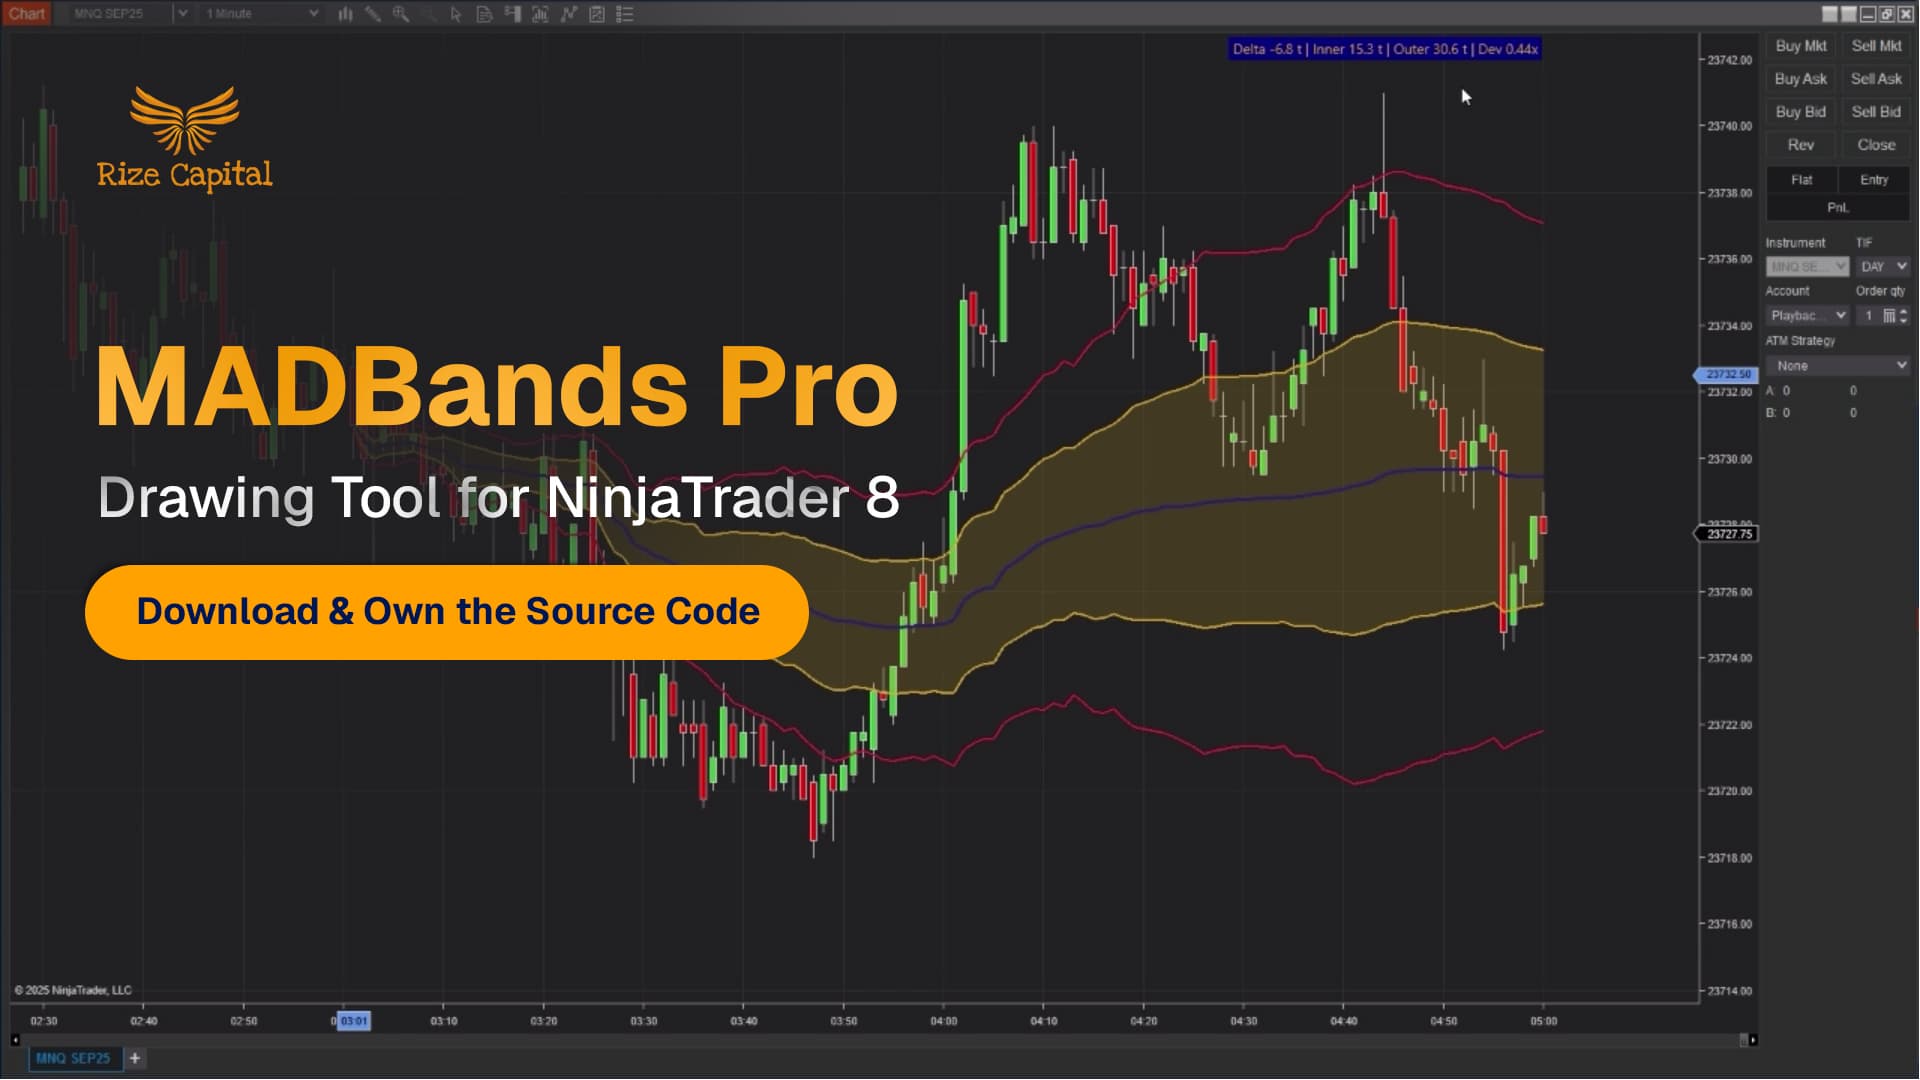
This pro-level premium NinjaTrader drawing tool is engineered to provide traders with a significant competitive advantage in day trading, swing trading, and position trading. It delivers intelligent market structure analysis through automatic equilibrium zone calculation based on volume-weighted median absolute deviation (MAD). This adaptive drawing tool is developed by Rize Capital, and it comes with complete NinjaScript source code ownership. Watch the comprehensive video tutorial to learn how this dynamic drawing tool works.
.jpg&w=2048&q=75)
This pro-level premium NinjaTrader drawing tool is engineered to provide traders with a significant competitive advantage in day trading, swing trading, and position trading. It delivers adaptive market structure analysis through volatility-based corridor projection. The Dynamic Corridor was specifically developed for NinjaTrader 8 users who demand precision in breakout and range trade analysis, and the exceptional value is that it works seamlessly with any type of NinjaTrader 8 license. Drawing tools of this sophistication are exceptionally rare because they automatically adapt to market volatility using advanced algorithms that combine ATR, percentile range analysis, and geometric symmetry principles, giving you a substantial edge over traders relying on static drawing tools or expensive institutional-grade software. While other providers offer basic corridor tools, they typically charge premium prices for limited functionality and don't provide the source code, making customisation impossible for most traders. However, we've developed this comprehensive solution from the ground up and include the complete NinjaScript source code along with detailed tutorial documentation, allowing you to modify, expand, and integrate the tool into your own custom strategies without restrictions. Watch the comprehensive video tutorial to discover how this adaptive corridor system can transform your market analysis approach, and experience firsthand why traders consider it an indispensable addition to their trading arsenal.
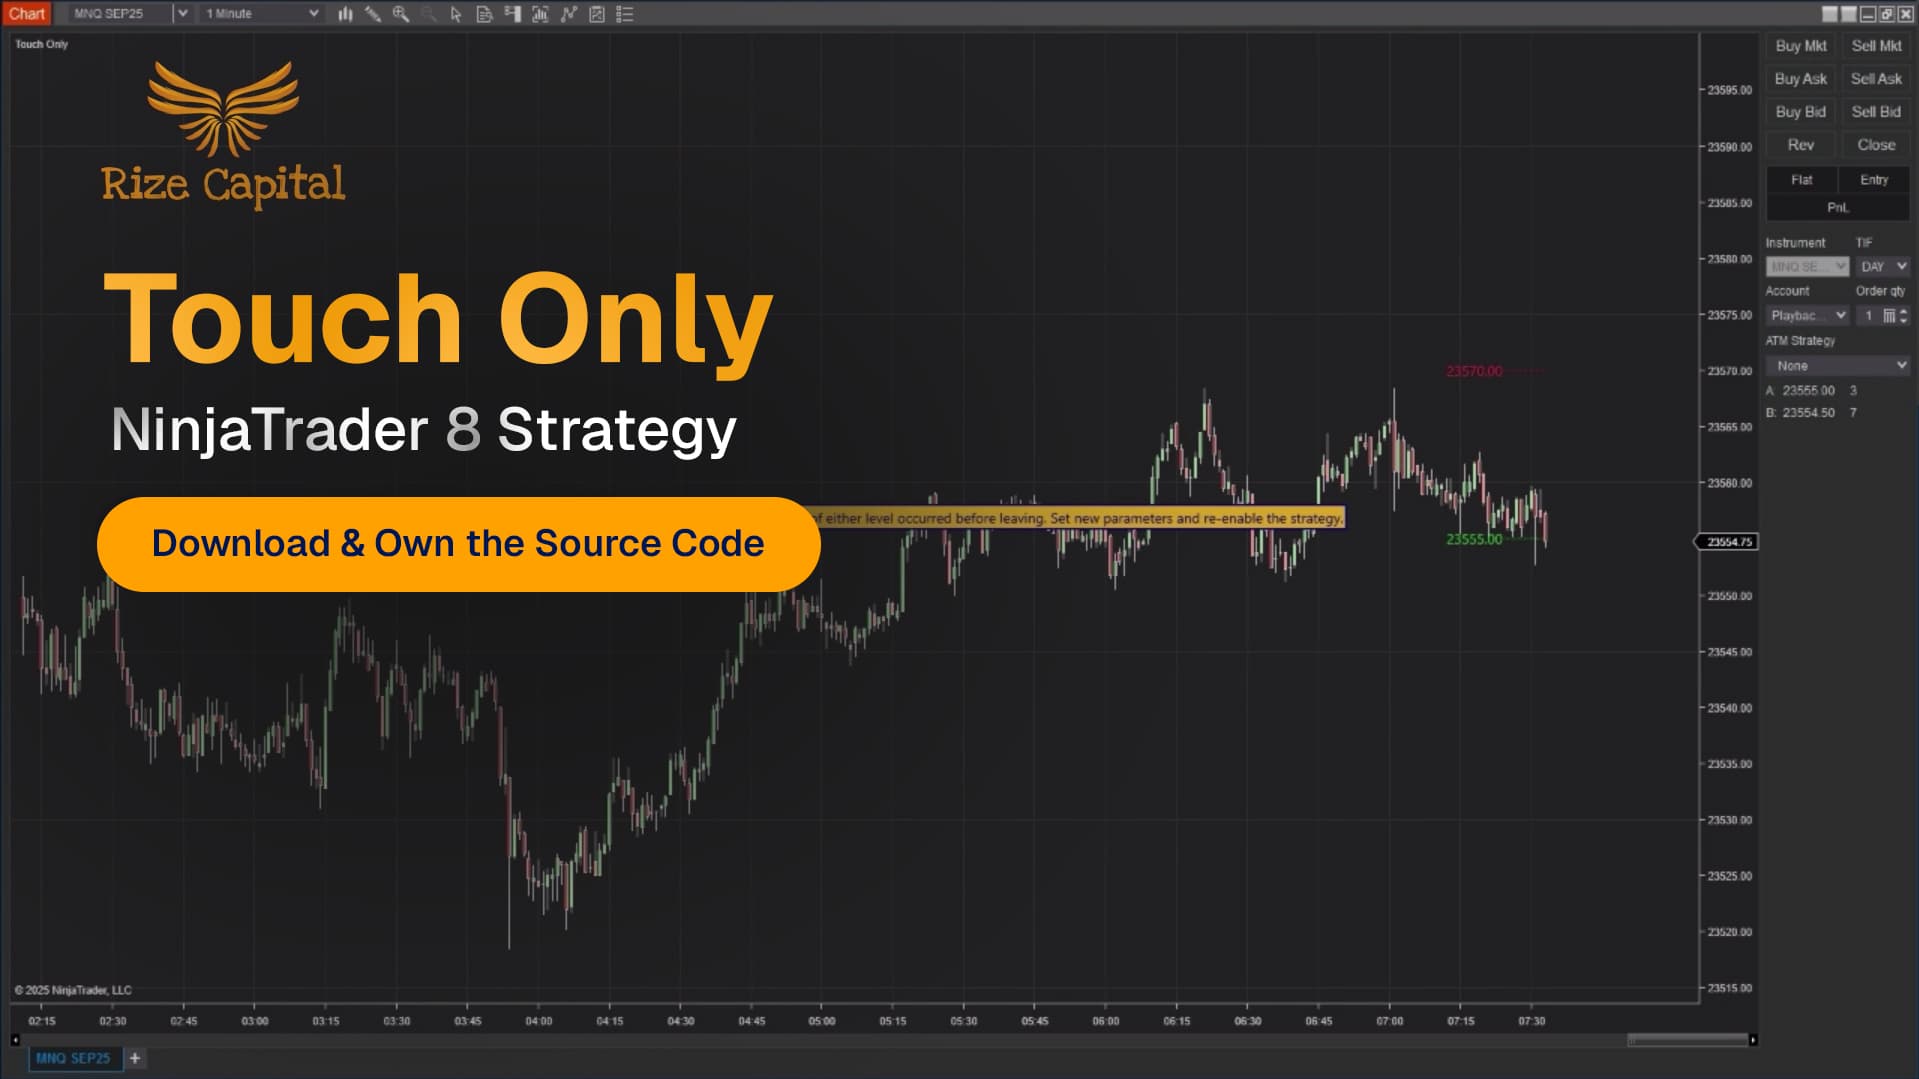
The Touch Only Strategy for NinjaTrader 8 is a precision-engineered limit-based entry system. Developed by Rize Capital, it executes trades only when price exactly touches predefined support or resistance levels, eliminating false signals and premature fills through exact tick-level precision. The support and resistance trading strategy comes with complete source code ownership, allowing traders to modify parameters, integrate the touch-based execution logic into their own systems, and fully customise the strategy to their specific trading style and risk management approach. Check out our video for a full NinjaScript tutorial.

The DayType Radar is one of the sophisticated market classification NinjaTrader 8 trend indicators we have. It specialises in identifying the likely market regime early in the session by measuring price structure and directional consistency during a configurable time window, automatically classifying each day into three distinct categories—Trend Day Ready, Balanced Rotational, or Choppy Two-Sided—whilst using ATR normalisation to adapt across different instruments and timeframes. When you purchase the DayType Radar from Rize Capital, one of the best NinjaTrader indicators in our platform, you receive the complete NinjaScript source code, providing total freedom to modify and customise the indicator. For a detailed overview, check out our video tutorial above.
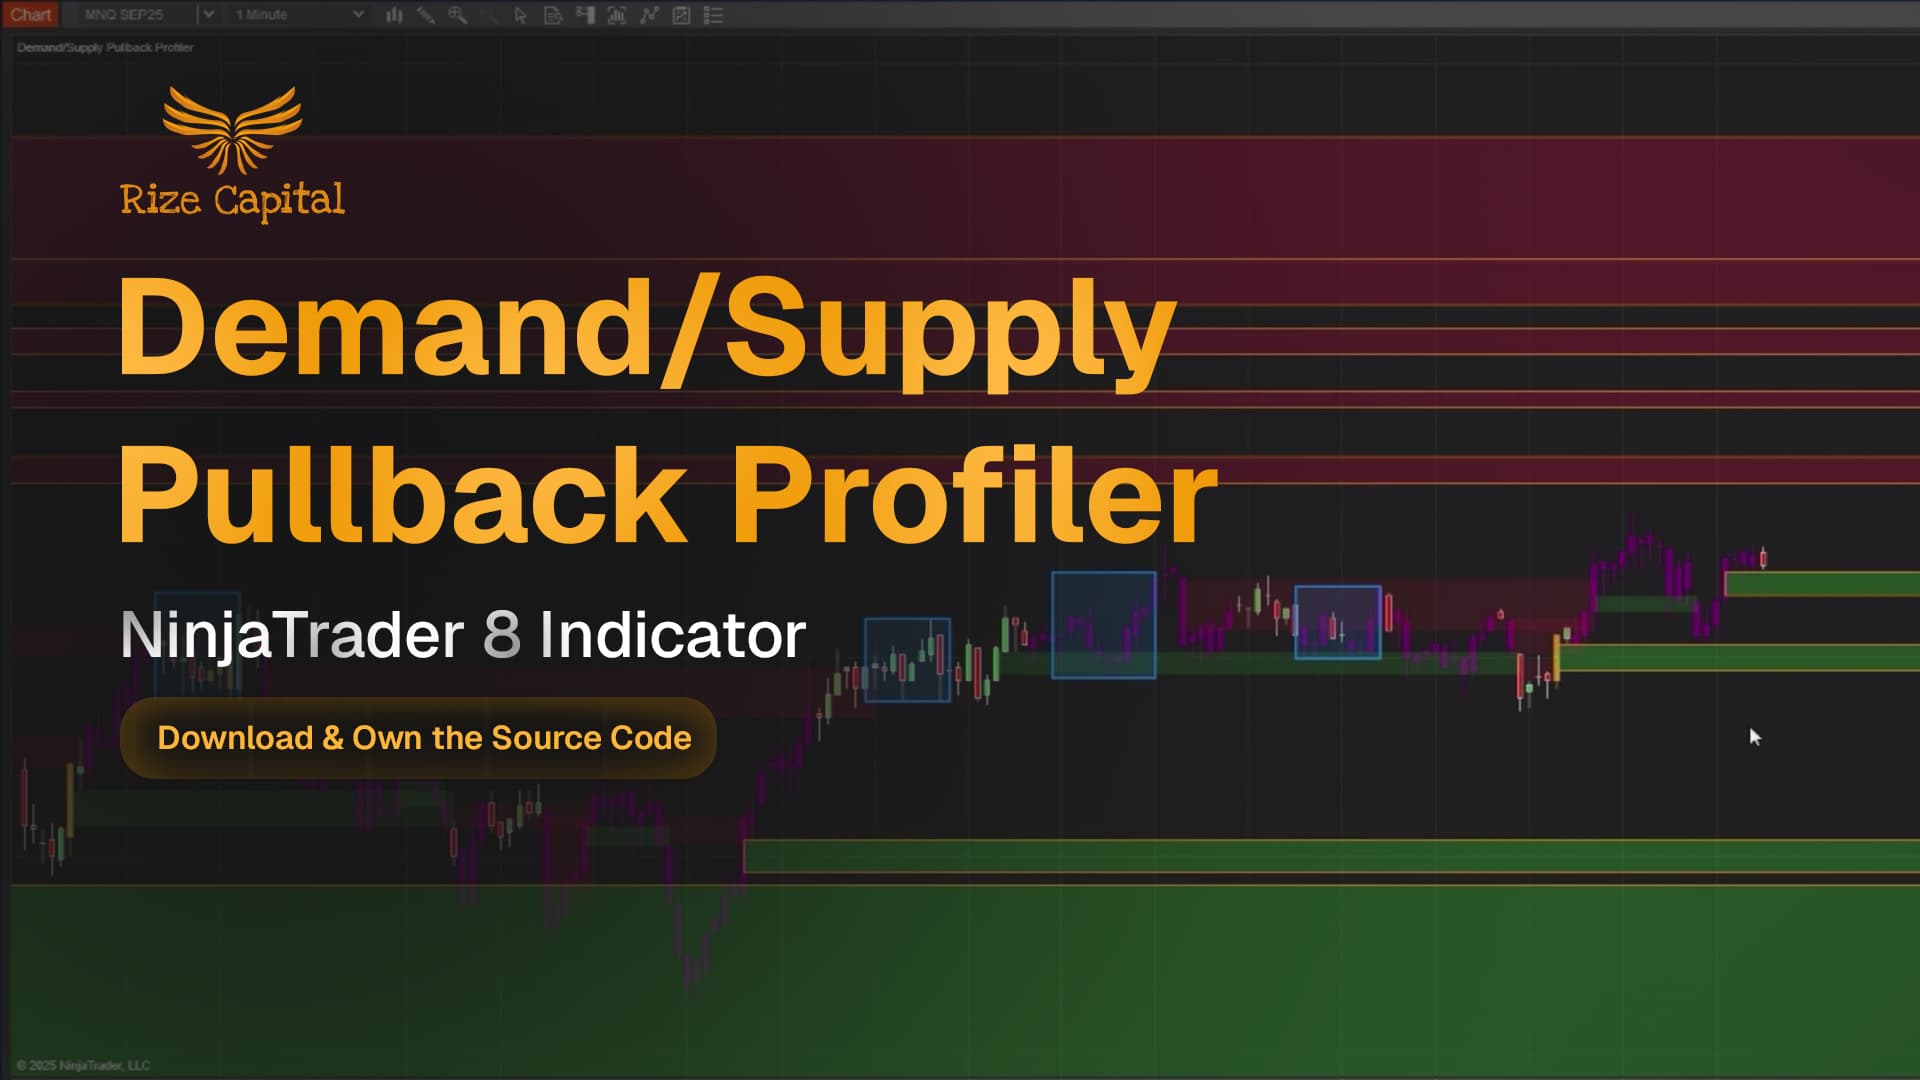
The Demand/Supply Pullback Profiler is a sophisticated market analysis indicator developed for NinjaTrader 8 and 8.1. It specialises in identifying institutional demand and supply zones combined with real-time pullback opportunities, automatically detecting areas where price previously moved with strong imbalances and painting visual signals when these zones are tested. When you purchase this NinjaTrader 8 Supply and Demand indicator from Rize Capital, you receive the complete NinjaScript source code, providing total freedom to modify the detection logic, customise the zone parameters and opacity settings, or integrate the indicator into automated strategies with no restrictions whatsoever. For a detailed overview, check out our video tutorial above.

The William Fractal is a sophisticated swing structure indicator developed for NinjaTrader 8 and 8.1. It specialises in identifying confirmed swing highs and swing lows using the classic fractal concept developed by Bill Williams, automatically plotting triangle markers at validated pivot points that meet strict left-right bar comparison requirements, providing objective market structure visualisation for both discretionary analysis and programmatic integration into automated strategies. When you purchase the William Fractal from Rize Capital, you receive the complete NinjaScript source code, providing total freedom to modify the indicator. For a detailed overview, check out our video tutorial above. Important Note: This indicator follows the classic fractal concept developed by Bill Williams. Any purchase amount paid is for the programming effort and implementation, not for the underlying idea itself.
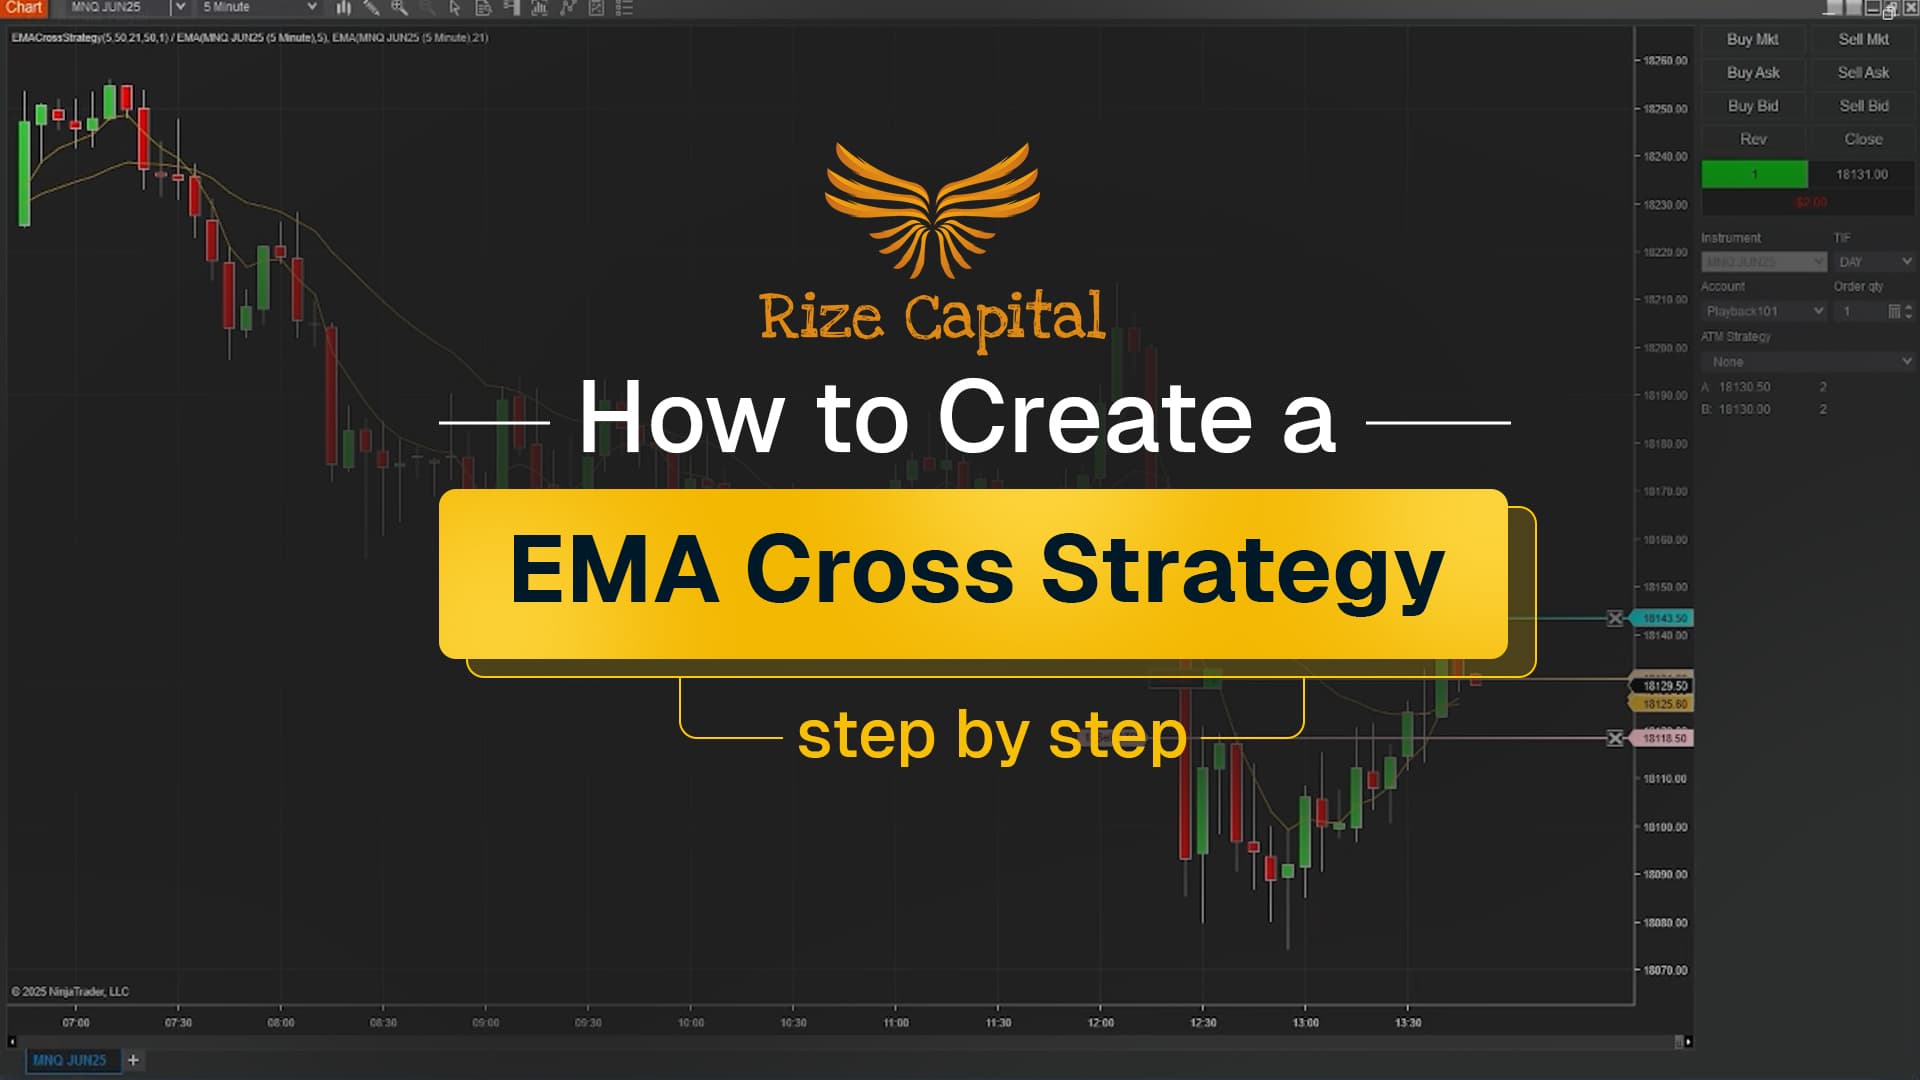
The EMA Cross Strategy for NinjaTrader 8 is a premium automated trading strategy that leverages dual Exponential Moving Average (EMA) crossovers to generate precise long and short entry signals with built-in risk management. Developed by Rize Capital, the EMA Cross Strategy automatically enters long positions when the fast EMA crosses above the slow EMA and short positions when the fast EMA crosses below the slow EMA, with each trade protected by predefined stop loss and profit target levels calculated in ticks. The EMA cross strategy for day trading comes with complete source code ownership, allowing advanced users to customise the logic to their specific trading requirements and risk tolerance. Check out our video for a full NinjaScript tutorial.
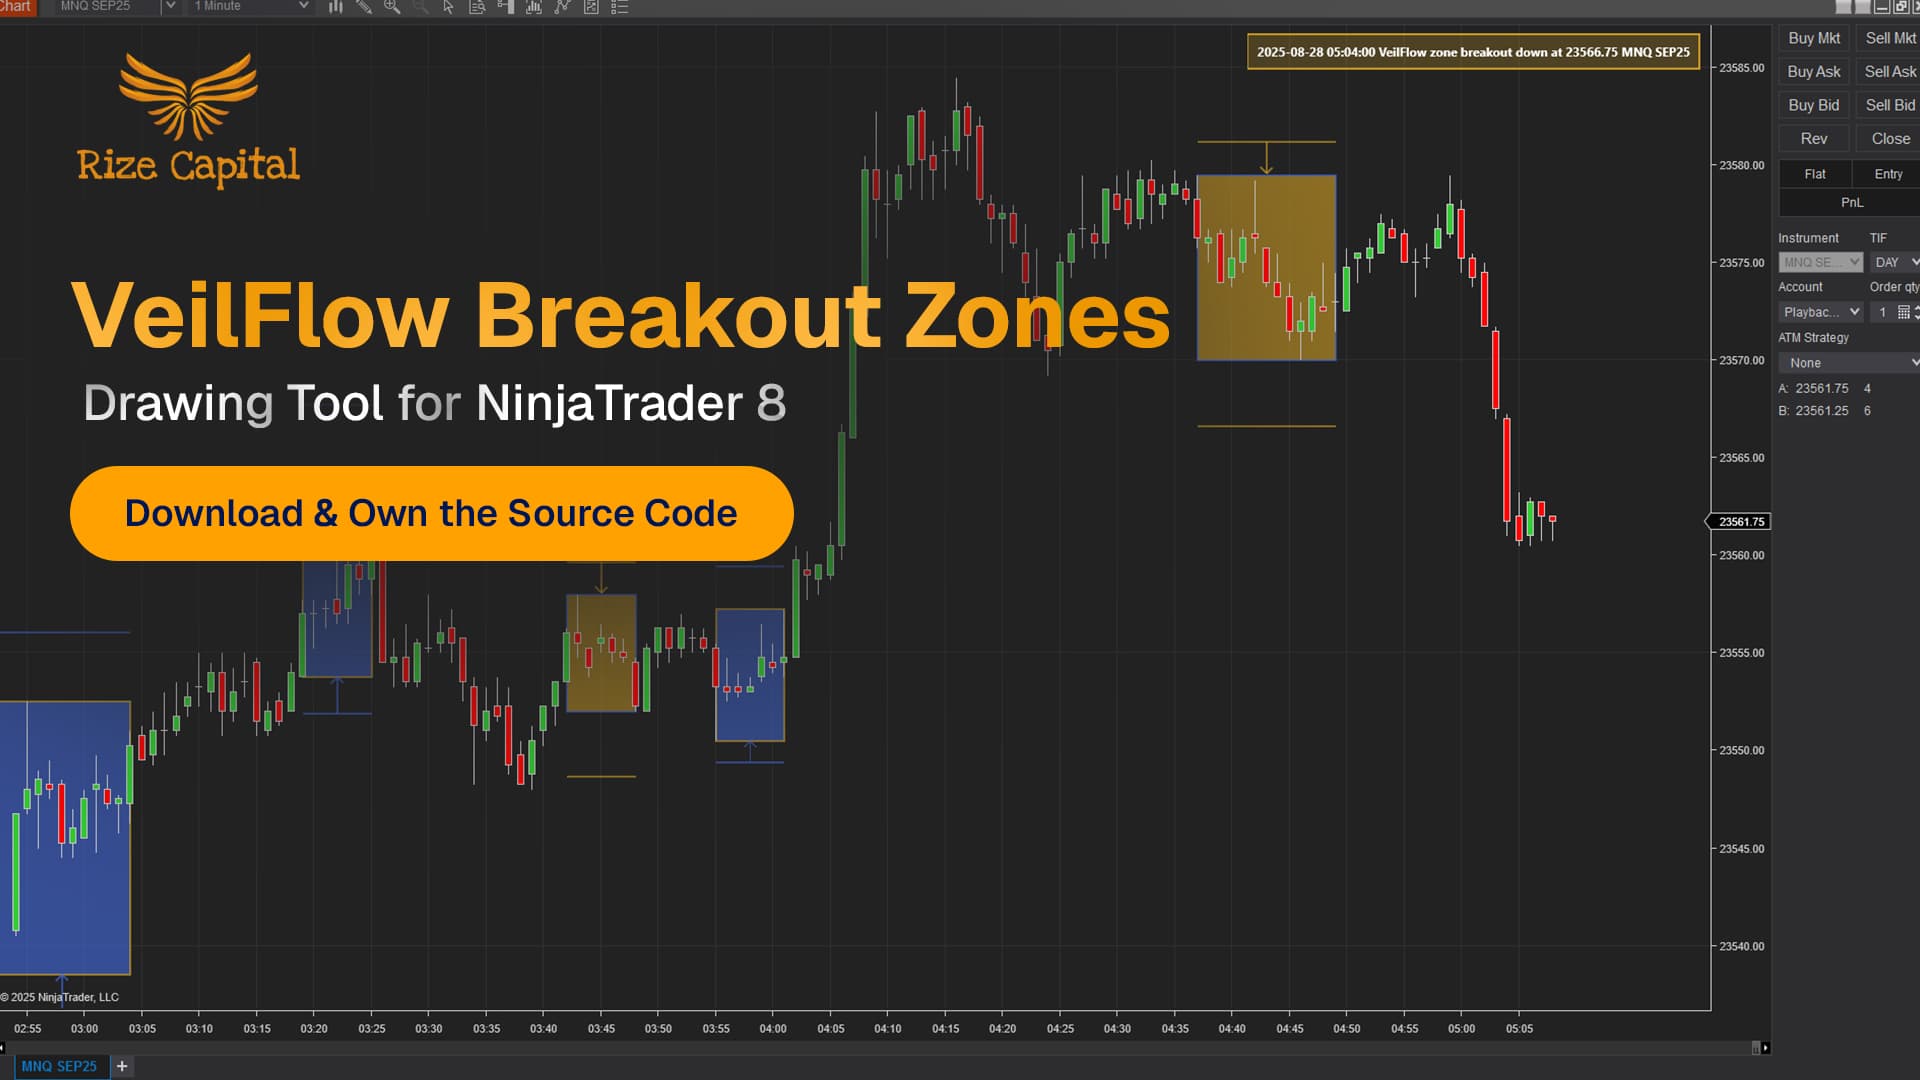
This pro-level premium NinjaTrader drawing tool is engineered to provide traders with a significant competitive advantage in day trading, swing trading, and position trading. It delivers intelligent market structure analysis through automatic detection of compression veils—low-volatility consolidation zones that often precede explosive price breakout in trading. Developed by Rize Capital, it comes with complete NinjaScript source code ownership. Watch the comprehensive video tutorial to learn how this dynamic drawing tool works.

The Fade Gauge is a sophisticated NinjaTrader reversal indicator. It specialises in identifying high-probability mean reversion trading setups by measuring real-time price deviation from moving averages and combining this with session-specific probability analysis, automatically painting visual signals when price becomes overextended and statistically likely to snap back. When you purchase the Fade Gauge from Rize Capital, you receive the complete NinjaScript source code, providing total freedom to modify the deviation thresholds, customise the time bin parameters and bar colours, or integrate the indicator into automated strategies with no restrictions whatsoever. For a detailed overview, check out our video tutorial above.

The Gap Tracker is a real-time analytical NinjaTrader 8 swing indicator that automatically detects, visualises, and monitors price gaps between session closes and opens. It identifies gap-up zones where price opened above the previous close and gap-down zones where price opened below, maintaining these visual markers on the chart as potential support, resistance, or continuation areas. When you purchase the Gap Tracker from Rize Capital, you receive the complete NinjaScript source code. For a detailed overview, check out our video tutorial above.

The StopHunt Sniper Pro is a sophisticated automated trading strategy developed for NinjaTrader 8 and 8.1. It specialises in capitalising on stop hunt liquidity events by detecting when price breaches key swing levels and snaps back towards the mean, automatically executing entries with multi-layered confirmation filters including volume spikes, candle body strength, and mean distance validation, whilst painting visual signals and displaying real-time profit and loss overlays directly on the chart. When you purchase the StopHunt Sniper Pro from Rize Capital, you receive the complete NinjaScript source code, providing total freedom to modify the detection algorithms, customise the entry execution logic and breakeven parameters, or integrate the strategy into your own automated trading systems with no restrictions whatsoever. For a detailed overview, check out our video tutorial above.
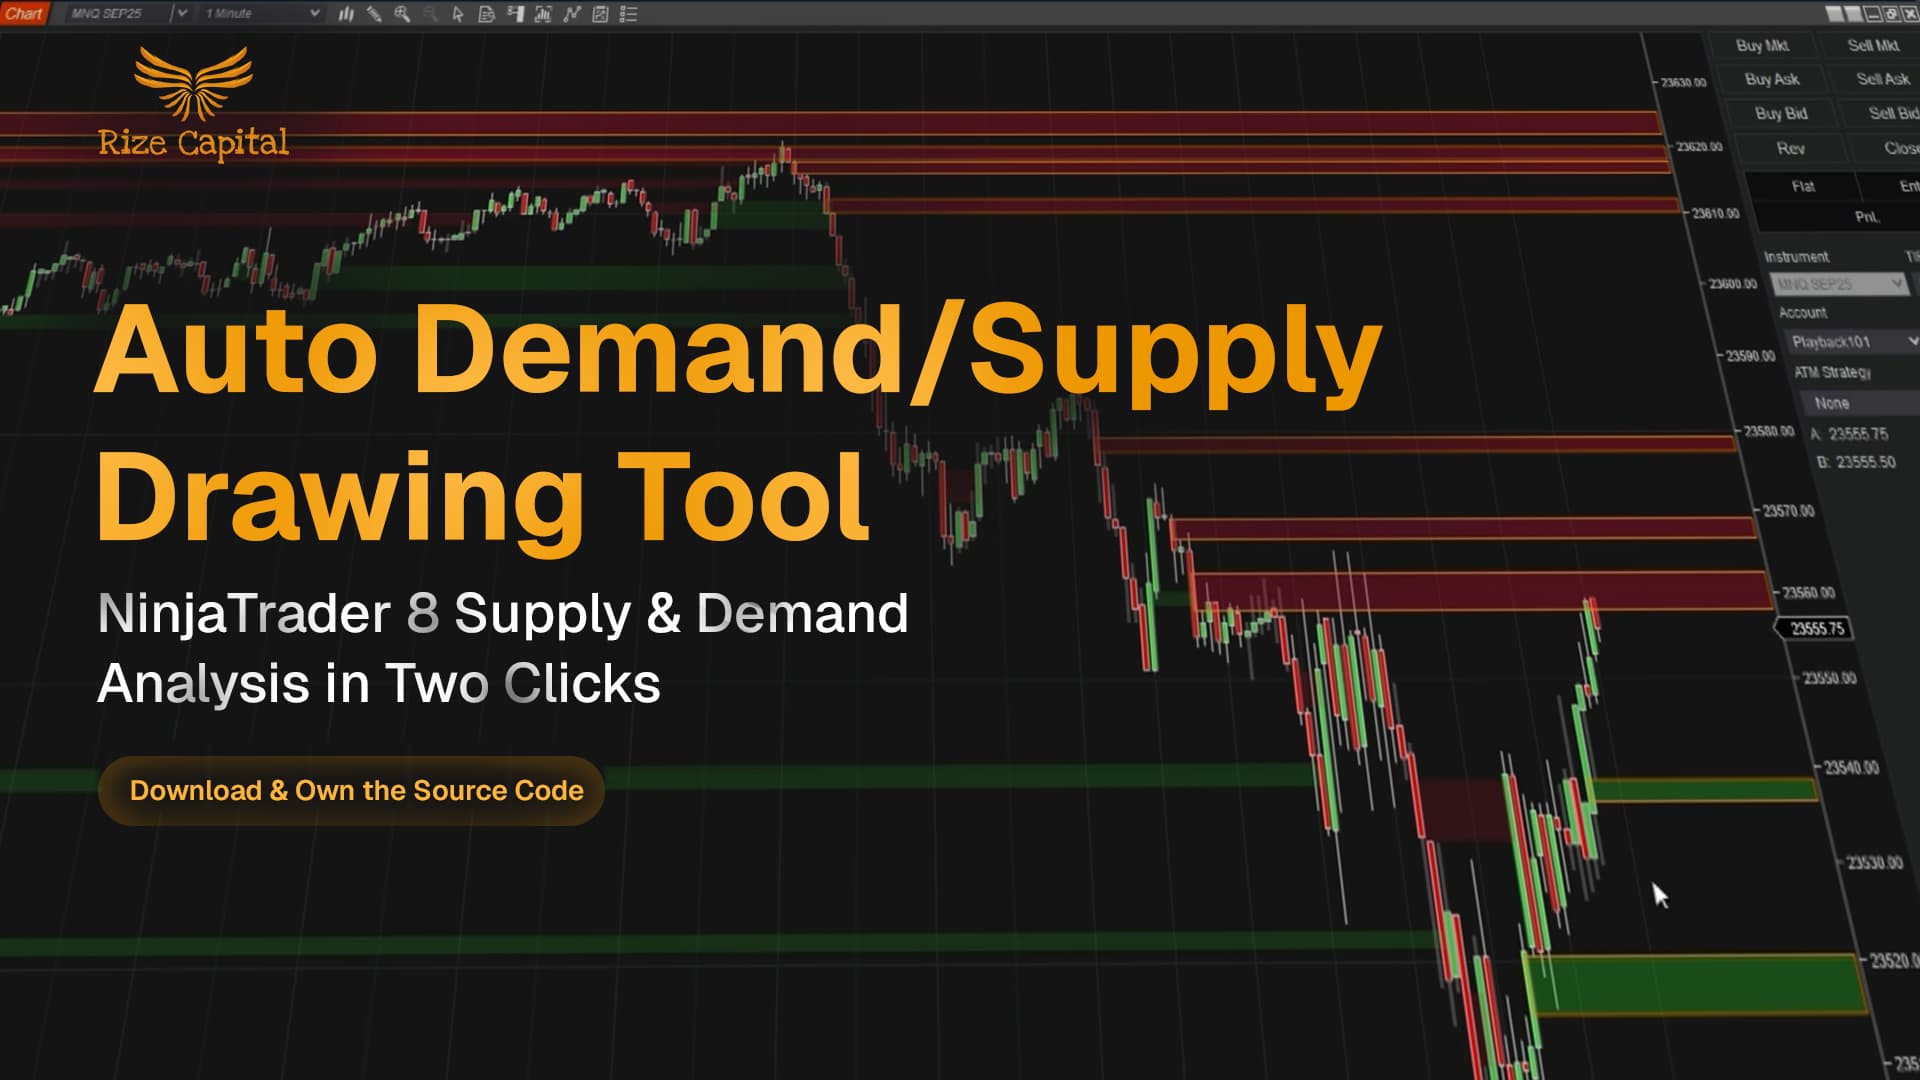
This pro-level premium NinjaTrader drawing tool is engineered to provide traders with a significant competitive advantage in day trading, swing trading, and position trading. It delivers intelligent market structure analysis through automatic supply and demand zone detection based on price imbalances and order flow gaps. The Auto Demand/Supply Tool was specifically developed for NinjaTrader 8 users who demand precision in support and resistance analysis, fair value gap identification, and order block logic, and the exceptional value is that it works seamlessly with any type of NinjaTrader 8 license. This drawing tool is developed by Rize Capital, and it comes with a complete NinjaScript source code. Watch the comprehensive video tutorial to learn how this automatic zone detection system with real-time alerts, historical fill analysis, and terminated zone tracking.

The Flow Shift Trajectories is a professional-grade visual NinjaTrader 8 drawing tool developed that identifies major turning points and trend shifts by tracking changes in price slope using a built-in regression model. When trend direction changes or momentum increases sharply, the tool automatically places an inflection marker at the exact candle where the shift occurs and projects a fan of angled lines showing the new trajectory, with the thickest line representing the dominant slope direction and thinner rays displaying supporting angles between previous and current trends. When you purchase the Flow Shift Trajectories from Rize Capital, you receive the complete NinjaScript source code. For a detailed overview, check out our video tutorial above.

The Price Memory Zones is one of the best NinjaTrader indicators for professional-grade analytics that automatically identify and visualise price levels where candle bodies have historically overlapped most frequently across recent sessions. It analyses historical price activity using sophisticated density calculations to detect high-memory regions where institutional and retail traders have repeatedly interacted, transforming these findings into clean, shaded zones that represent natural support and resistance areas. When you purchase the Price Memory Zones from Rize Capital, you receive the complete NinjaScript source code. For a detailed overview, check out our video tutorial above.
Master NinjaScript programming with our comprehensive online training. Our expert-led course takes you from a beginner with no prior programming experience to an expert level, teaching you to build professional-grade indicators, strategies and add-ons.
Get started with our collection of free NinjaTrader indicators that give traders an edge without the cost.


Our free indicators give traders an edge without the cost. You'll find high-quality indicators and educational resources that demonstrate our commitment to the trading community. These free tools showcase our programming expertise while helping you improve your trading results. The best part? They are free for a lifetime.
Download our collection of free custom indicators designed specifically for NinjaTrader 8. Experience the quality of our work before investing in our premium offerings. Our free tools include indicators such as Zone Drawing, Daily Deviation Counter, and Daily Change.
Alongside free indicators, you can also find free tutorials with source codes to kickstart your NinjaScript programming journey. On top of all of this, access our blogs with educational resources related to trading, forex, NinjaTrader 8, NinjaScript, and a lot more.
Our professional-grade trading indicators and strategies for NinjaTrader 8 help the most proficient of traders to make calculated decisions.
Gain precise market insights with our professional-grade technical indicators designed for serious traders.


Execute trades with precision and consistency using our battle-tested automated trading systems.
Transform your trading ideas into reality with our expert NinjaScript development services.

Choose your preferred membership from below
By registering and subscribing to our Subscription List, you'll receive exclusive offers, early access to new tools, and trading insights directly to your inbox.
With a free account, you can still browse this website's different content and explore free trading indicators, educational videos, and blogs. Doesn't include source code download products.
Save money by subscribing to all premium indicators available on our platform. Enjoy an exclusive discount on your subscription. If you don't like it, you can cancel at any time. Doesn't include source code download products.
You get full access to all premium automated strategies, indicators, member only videos, updates and free bonuses. Doesn't include source code download products.


