
Premium iNDICATORS
TRY FREE OUR MOST POPULAR INDICATORS
Price Level Volume Insights - Premium Indicator
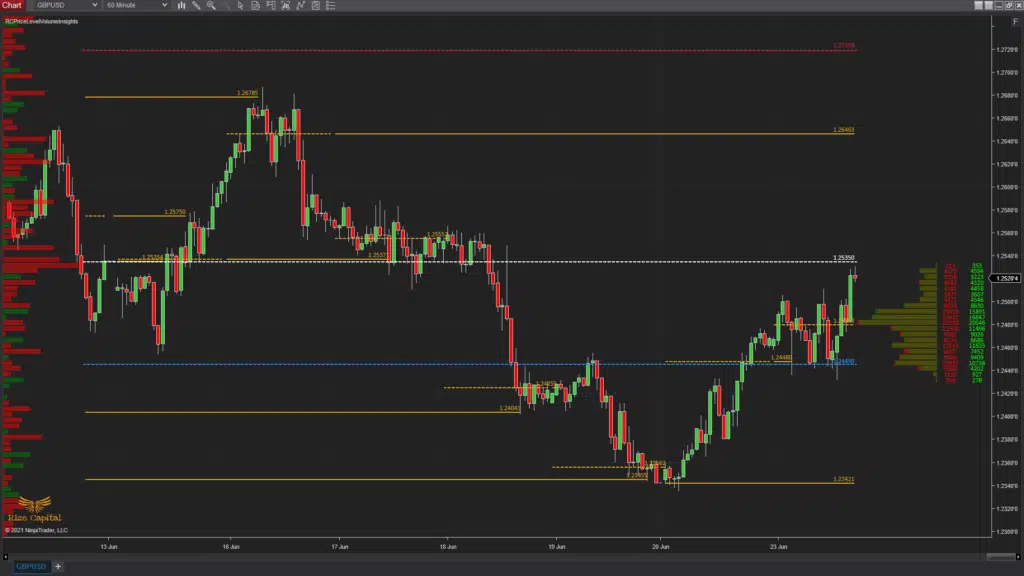
This Pro-level premium NinjaTrader 8 custom indicator is developed to give you an edge on market for your day trading, swing or position trading. Price Level Volume Insights indicator is developed for using with NinjaTrader 8 and the best part is, you can now access these insights with any type of NinjaTrader 8 license. The reason this kind of indicators are rare to find, because it gives you an edge over many other traders and investors in the market. As a result, it’s considered as one of the best NinjaTrader indicators. Some of the providers offer something close to it, but they charge users lots of money which even makes it difficult for some professional traders and nearly impossible for retail traders to use these kind of information for trading. However, we have developed it from scratch and can provide you subscription for such a low fee. If you watch the video tutorial, you will agree with how beneficial this indicator will be for your trading. Try it for FREE 1st month and watch the video to see how it works and then make your decision.
Multi Time Frame Trend Line - Premium Indicator
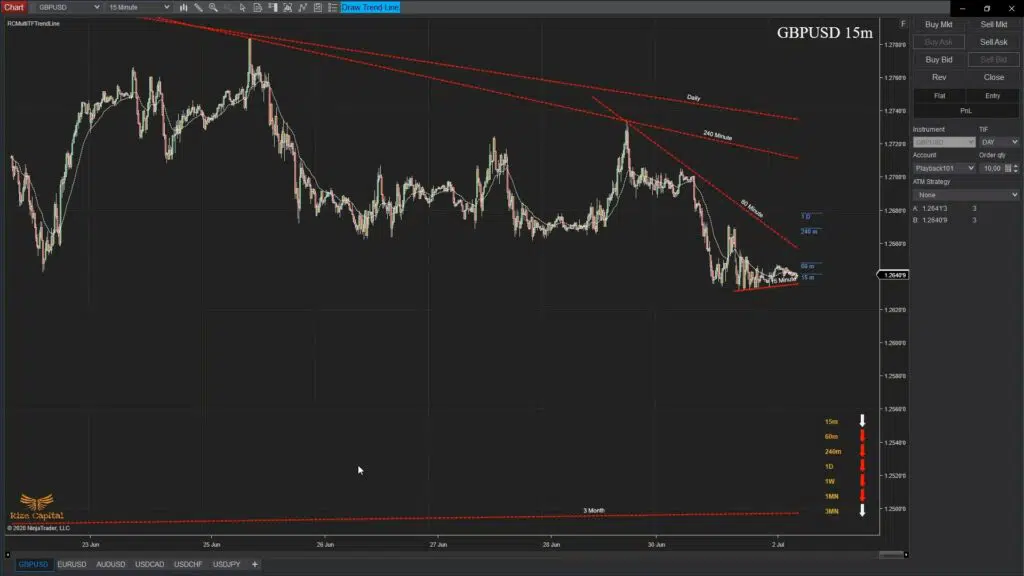
This is one of the best NinjaTrader indicators and most useful Pro-level Premium Indicator which will help you to draw Trend Lines on your chart for Multi Time frames and get entire market Trend Lines view being on a single Time Frame chart. You will also have overall idea of market flow with EMA lines of all those different TF, just by being on the same chart. When Trend changes on different TF or Trend Lines are broken, without changing the chart TF, you will be able to know everything at once. Watch the video to see how it works and then make your decision. Try it FREE for 1st month Now.
Multi Time Frame Zone Drawing - Premium Indicator
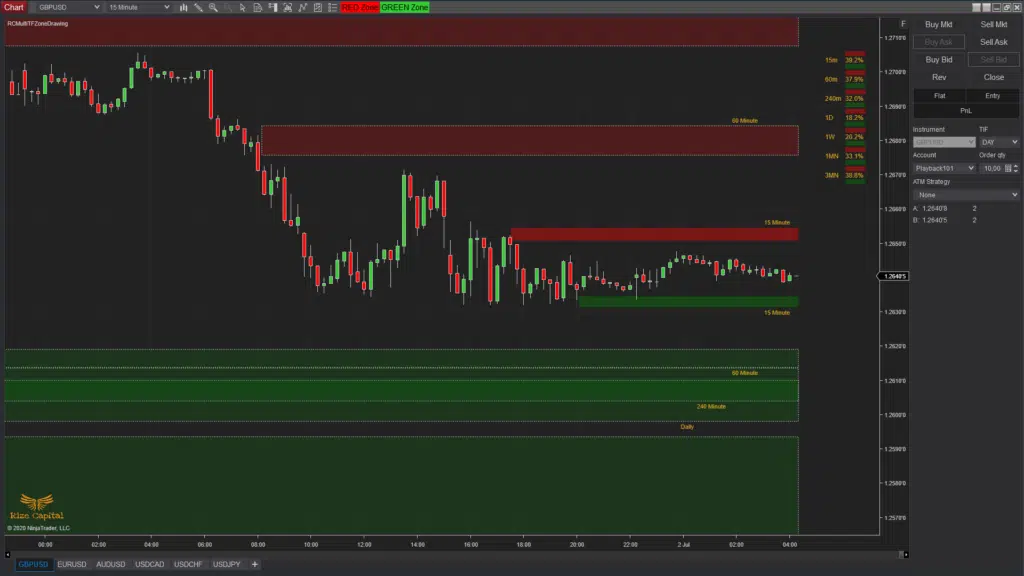
This Premium NinjaTrader custom Indicator will help you to draw Support/ Resistance or Supply/ Demand or any other zones for Multi Time Frame on NinjaTrader 8, while getting all the calculation and entire view of the market, being on just any Time Frame chart. This indicator helps you to find out where current market price is, compared to all different time frames. It is a must have premium indicator for all professional Traders and Investors. If you watch the video tutorial, you will agree. Try it for FREE 1st month and watch the video to see how it works and then make your decision.
Trend Change Indicator - Premium Indicator
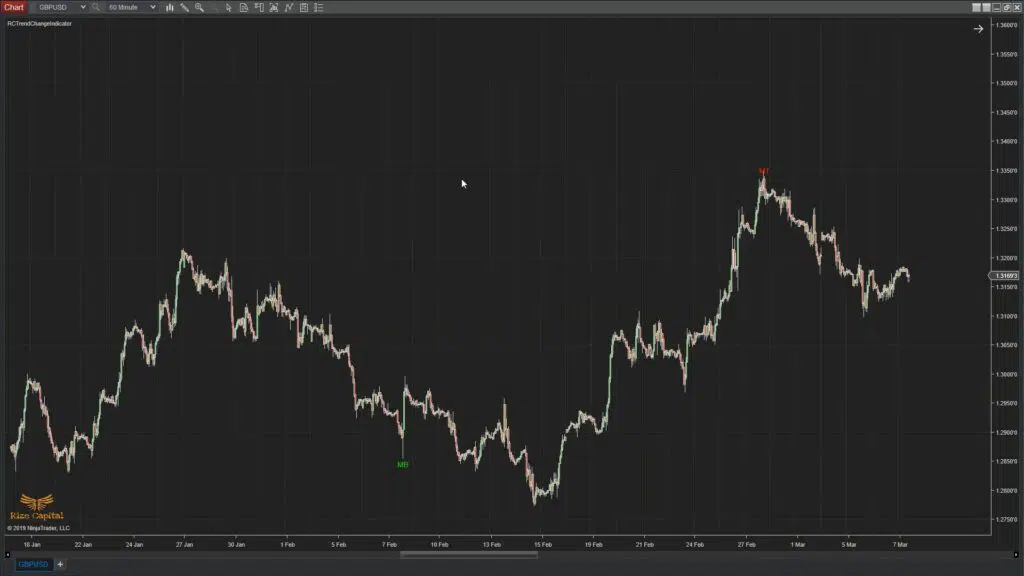
This Pro-level Premium Indicator’s name says it all. It plots different trend changes in the market on your charts so that you can see way before the market trend is highly likely to change. If you know the market change is expected soon, you can build your trading plan and moves accordingly with this indicator with more precision and also you will have enough time for your effective Risk management as well. This NinjaTrader custom indicator can be used for plotting the big trend moves. Try it FREE 1st month and watch the video to see how it works to make your decision.
Current Deviation - Premium Indicator
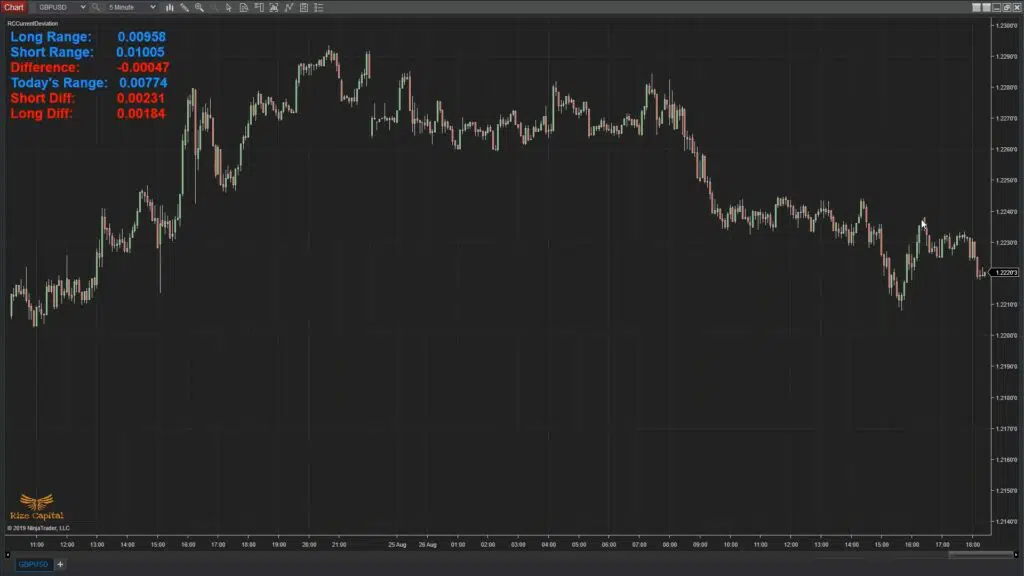
This very useful Indicator plots Today’s market deviation live from Open price. And also it plots live market’s deviation compared to short and long Term periods. You will have the option to choose the periods for Short and long Term. This indicator is very useful for both Day Trader and Swing Trader. This Premium Indicator tells you, whether the market is stretched too much or not compared to Short and Long Term. Historically, if the market is extremely stretched, it is highly likely to reverse and this indicator will help you to find out exactly that to make your trading or investment decisions. Why don’t you try FREE for 1st month and test it yourself.
Daily Extremes - Premium Indicator
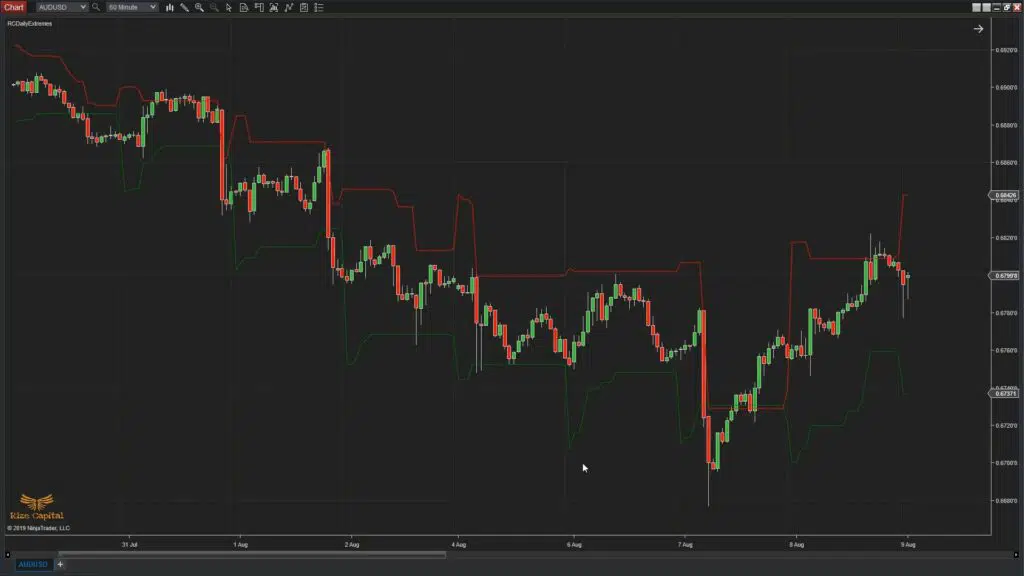
This indicator is very useful for Day Traders, but also can be used for Swing Trading Strategies. This Premium Indicator shows you with 2 plots on your chart where is the highly likely market Top or Bottom is going to be for the day. When the Market reaches the Market Top Line, it is highly likely that its going to reverse and same for the Market Floor Line. This premium indicator keeps calculating and plots the lines for you on chart so that you can see the high probable likely Market Top and Market Floor for the day. Who doesn’t want to know the Market Top and Bottom early in the Day? Try it for FREE now for 1st month to check if it meets your expectation or not.
Institutional Entry Exit- Premium Indicator
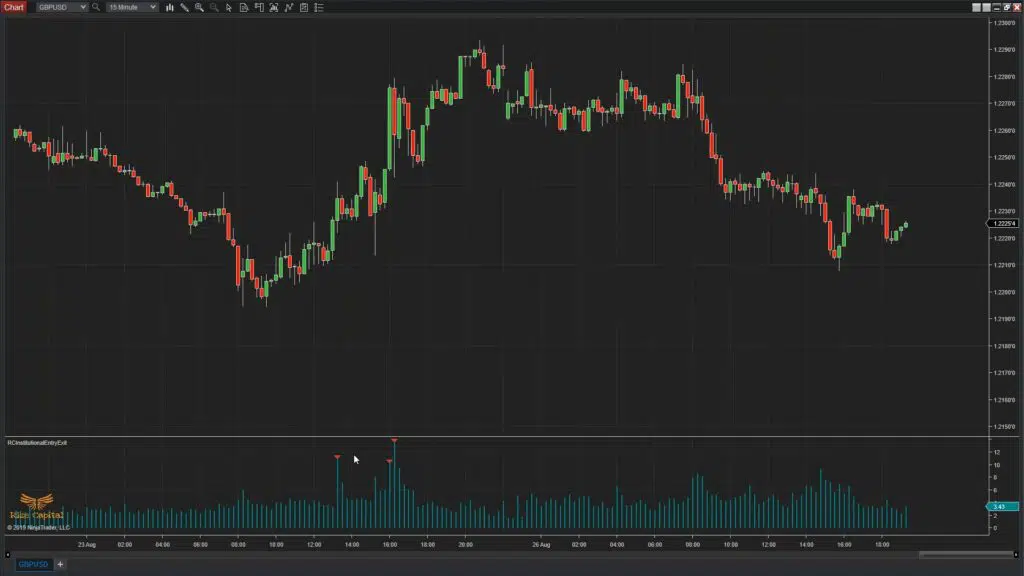
This Pro-Level highly useful Premium Indicator shows you on chart when a probable institutional level trade has taken place. It plots marker on chart to show you the move, so that you can follow the big institutional level traders in the market and take decisions accordingly for your entry and exiting the market position. And everyone knows, only institutional level trades can move a market and if your strategy is to follow their moves, then this can be a very useful indicator for you. If you are still not sure, you can watch the video tutorial and try it yourself for free for 1st month and you will see the effectiveness of this indicator on your charts.
Smart Entry Exit - Premium Indicator
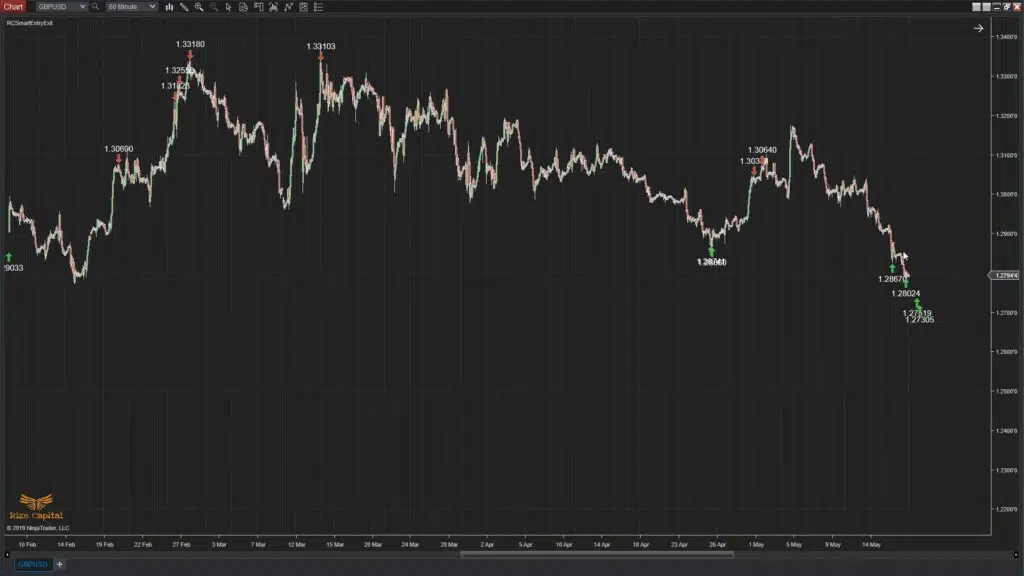
This Smart Premium indicator can plot different market direction changes for you. This indicator’s algorithm is smart enough to predict trend changes and plots potential entry exit with more accuracy. If you are a trader who likes market direction changes as one of your strategies, this indicator is the best to help you making your decisions to enter and exit a position more wisely. This indicator will plot the big direction changes coming with more accuracy; so that you can catch the trend change moves in very early stages. Check this indicator’s video tutorial and try this premium indicator FREE for 1st month.
Smart Money Levels - Premium Indicator
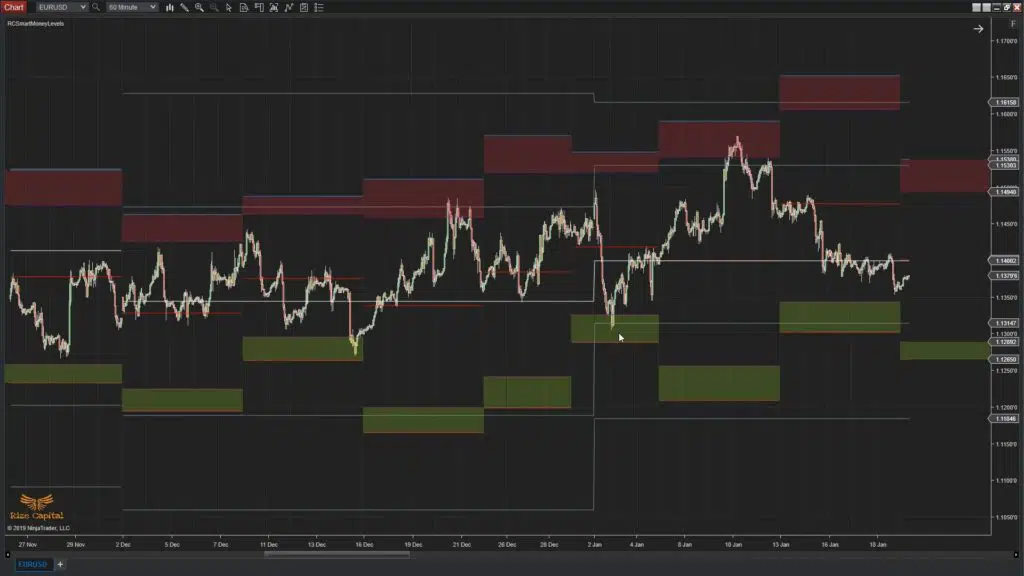
This Pro-level Indicator will plot weekly levels at the start of the week, where market is highly likely to bounce back or face high resistance / support. Really good for swing and long term traders. Do you not want to see the levels for the week in advance, where market is highly likely to bounce? You will see for yourself different smart money levels on your chart, which are decided by the smart players of the market, at the start of the week and these levels will remain plotted on your chart for rest of the week . Why don’t you watch the video and try FREE now. You have 1st month Trial Period for FREE.
Point & Figure Entry Exit - Premium Indicator
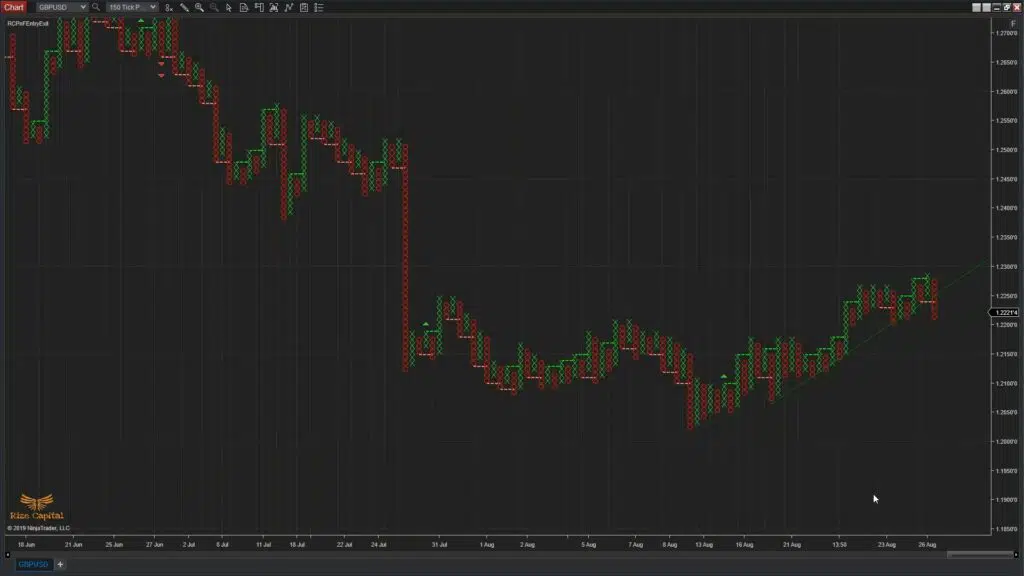
This is a professional level Premium Indicator. It can only be used on Point and Figure charts. It will plot best possible Buy and Sell signals, but you need to choose which one to take yourself. It shows Trend Line at the same time as well. If you are a PnF chart user, No doubt, it is a must indicator for you. If you have been in Financial Market for good number of years, you definitely know how effective this indicator will be. Why not watch our video tutorial for this indicator and see for yourself? Then if you are happy, try for 1st month free before you continue using this premium indicator.
Trading Zones With Extension - Premium Indicator
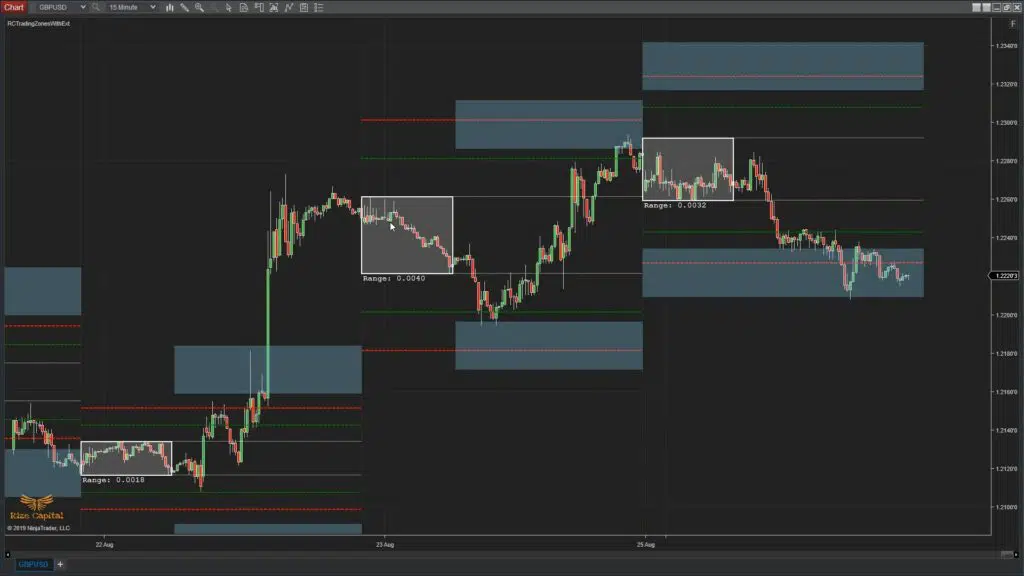
This most Popular Premium Day Trading indicator plots daily forecasting levels on charts. If you use this indicator, early in the session, you will be able to see the forecasting levels plotted on your chart to predict the movements in the market for rest of the day, so that you can wisely make your move. You can use this indicator to see weekly market’s overall moves as well. You can use this indicator to plan highly likely Stop hunts levels, market turn around levels and profit target levels for the day. Watch the video tutorial before making your decision and try 1st month FREE.
Buy Sell Volume - Premium Indicator
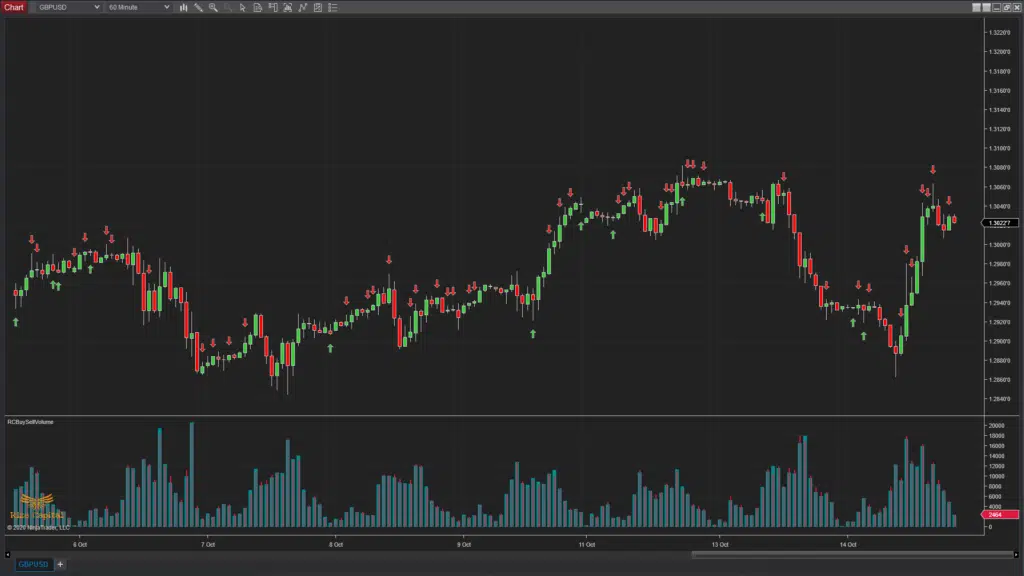
This Premium Indicator separates Buy / Sell volume and plots them on chart with capability of plotting volume Delta as well. This upgraded version also has option to plot separate buyer and seller pressure with arrows on chart. Traditional Volume indicators plot total volume where you will have no clue about who is controlling the market. But this Pro-level indicator plots volumes so accurately tick by tick that you will have very clear idea on who is controlling the price move ie, Are buyers moving the price or sellers? Try it 1st month FREE before you make your decisions.
Absolute Delta - Premium Indicator
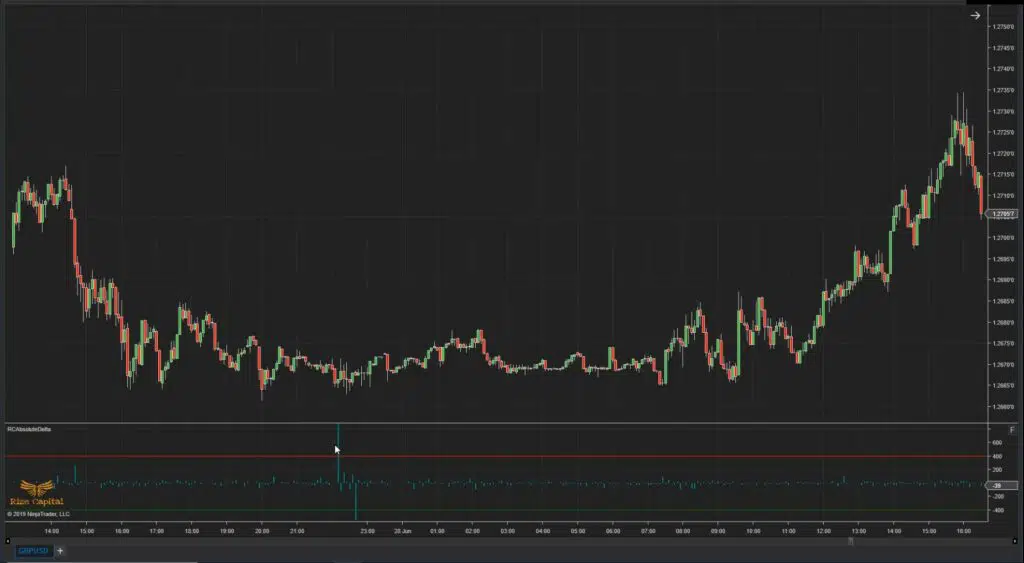
This premium Indicator can reveal you where Buyers have taken over the market and when Sellers have taken over the market. It is such a secret revealing indicator that you will be surprised to see the skeleton of the market. And if you know where Buyers or Sellers are having absolute power, then you can make your move accordingly. You don’t want to Buy in a sellers’ market and you don’t want to sell in a buyers’ market, are you? You can watch our video tutorial to learn more about this pro-level premium indicator and try 1st month free before you believe it.
Get OFFERS & DISCOUNT Every Month
by registering and subscribing to our Subscription List Here
Subscribe here for our Offers / Discounts/ Bonus/ Promotions
Not ready to subscribe yet, join us for free to explore more
With free account, you can visit different parts of this website. You can get free indicators, strategies, videos and free bonuses. There is nothing to lose with free account.