First month is always free to try. You PAY NOTHING for your trial period and it’s a no obligation trial period. There is no minimum term, if you don’t like it – you can cancel your subscription any time you want.
Try FREE for 1st MONTH
after first month just £9 /month
Your subscription will be processed through Paypal
If you are already subscribed to this indicator and want to unsubscribe, Please click here
WATCH THE VIDEO TO KNOW MORE ABOUT
Daily Extremes - Premium Indicator
1st month FREE TRIAL
Access to all future updates
24/7 update and technical support
Cancel subscription anytime
Indicator Details:
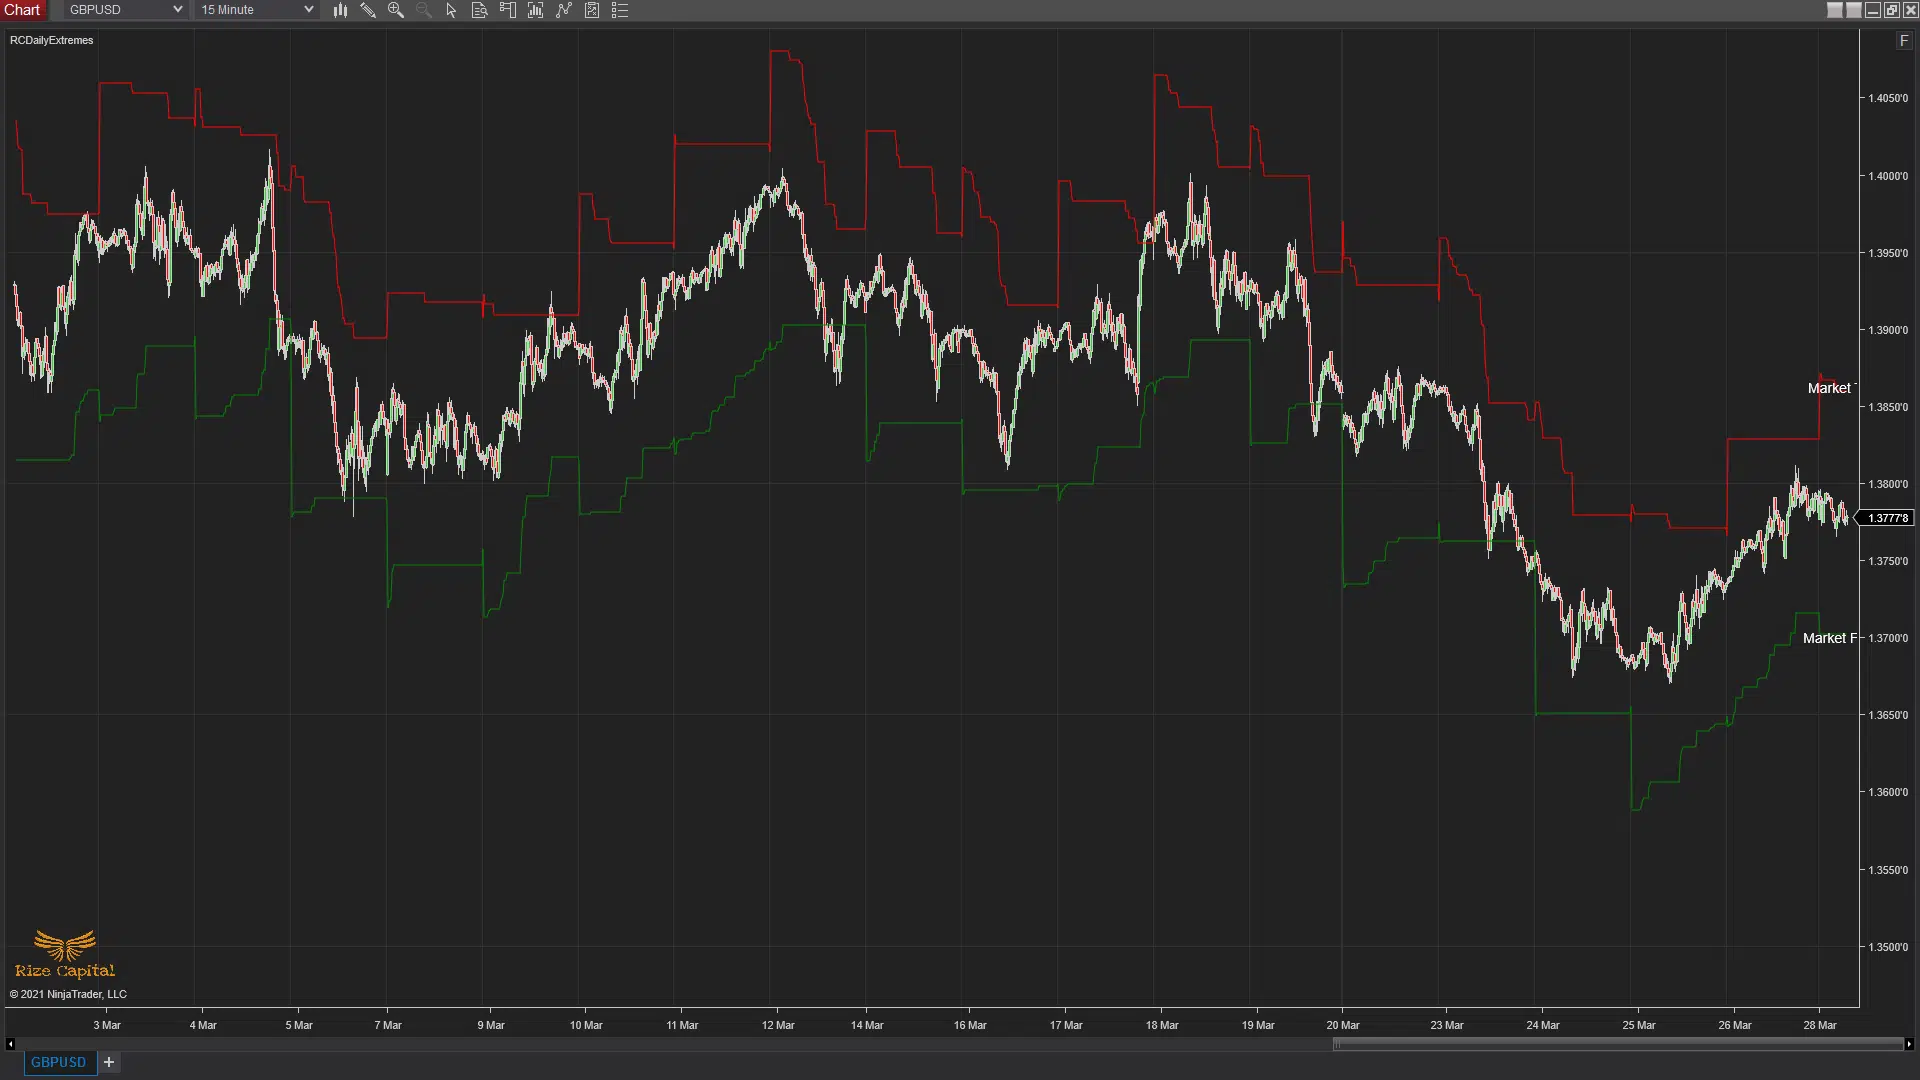
Image - 1 (Click to ZOOM)
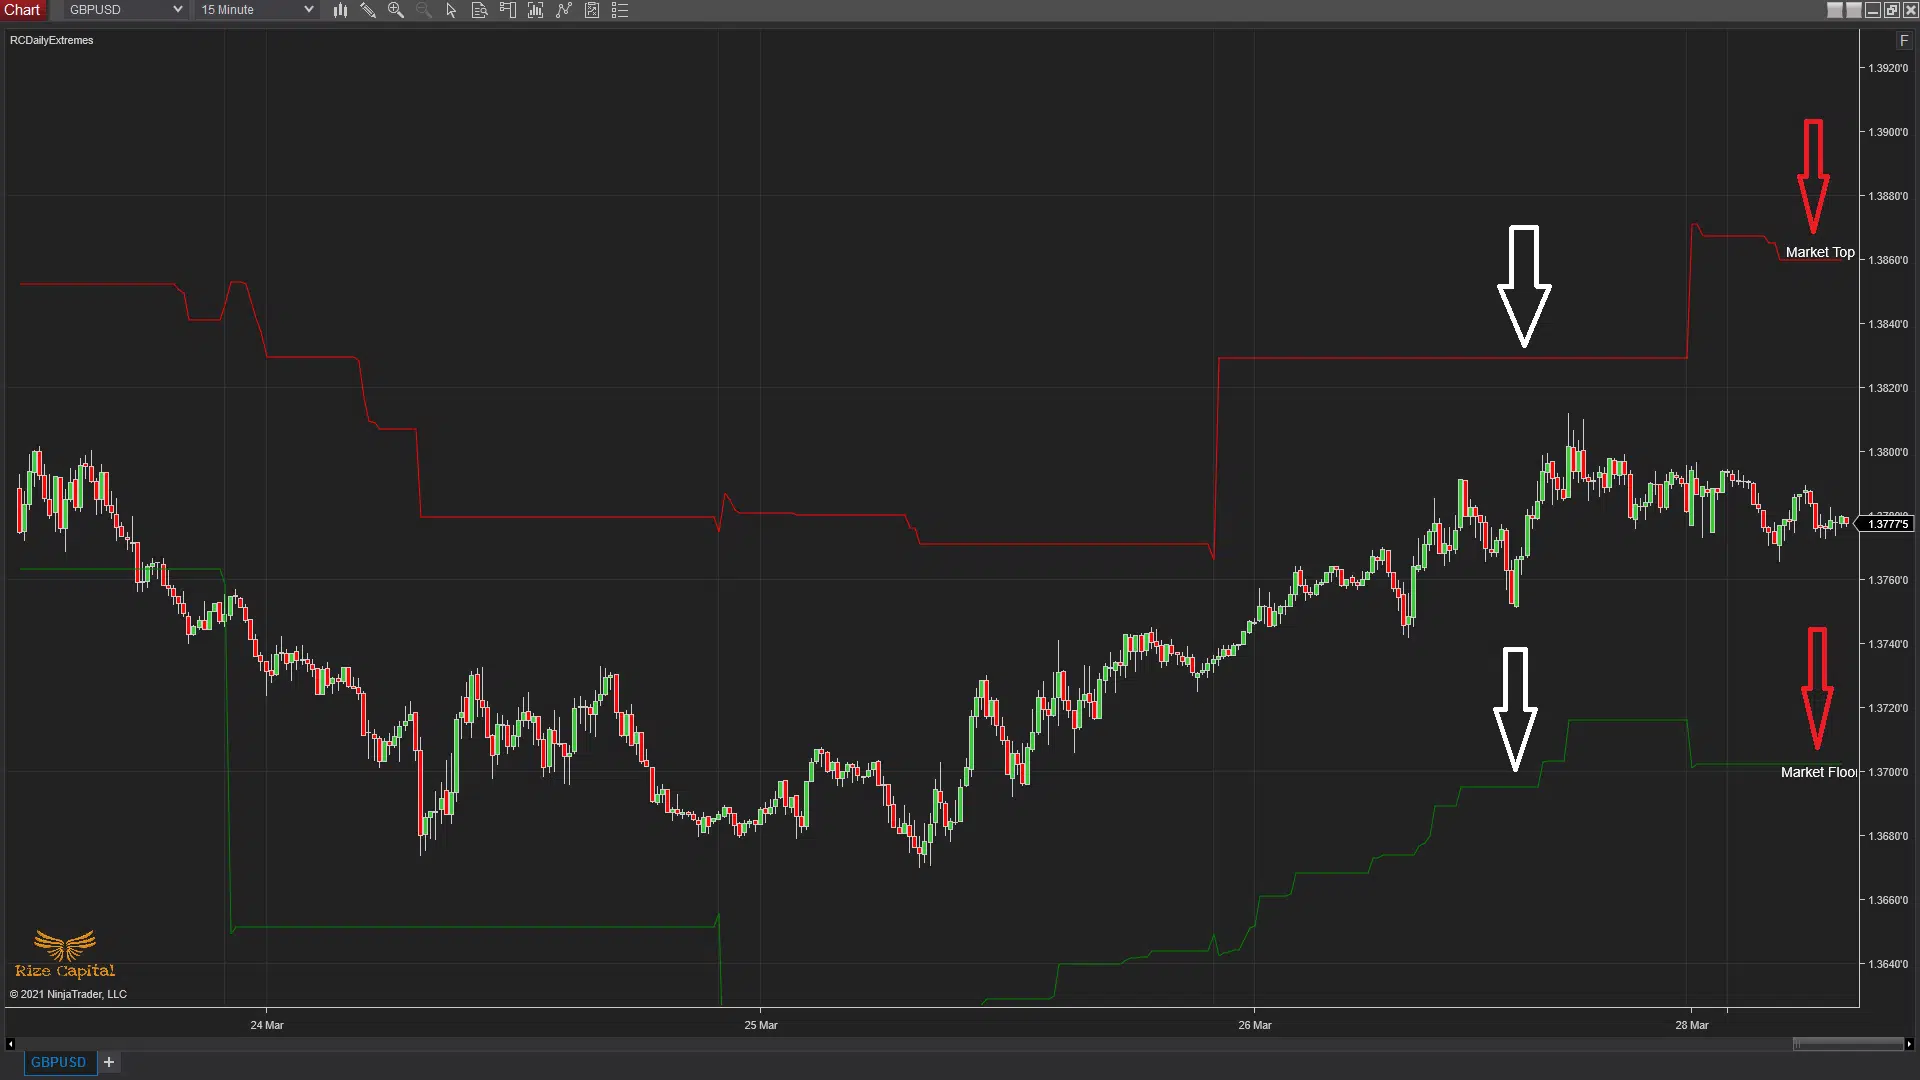
Image - 2 (Click to ZOOM)
Daily Extremes is a custom programmed indicator developed by Rize Capital to be used on NinjaTrader 8 trading platform. This indicator plots potential daily top and bottom of the market on live data. When you add this indicator on your chart, it will look similar to Image – 1. Now, if you look at Image – 2, you will see potential ‘Market Top’ and ‘Market Floor’ text plotted on the chart which are marked by red down arrows. It also plots dynamic red and green lines which are pointed by white down arrows in Image – 2 to show you historical top and floor of the market. Now from Image – 1 or on your chart, you will see sometimes price goes through the market top and floor lines which are indications that market price is going to reverse. You can use this indicator to manage your risk/ reward or you can use it for entries and exits – which will depend on your trading style or strategy.
This indicator works on any market, any instrument. Please note, this indicator works on intra-day time frame only as the purpose is to plot the daily market top and floor.
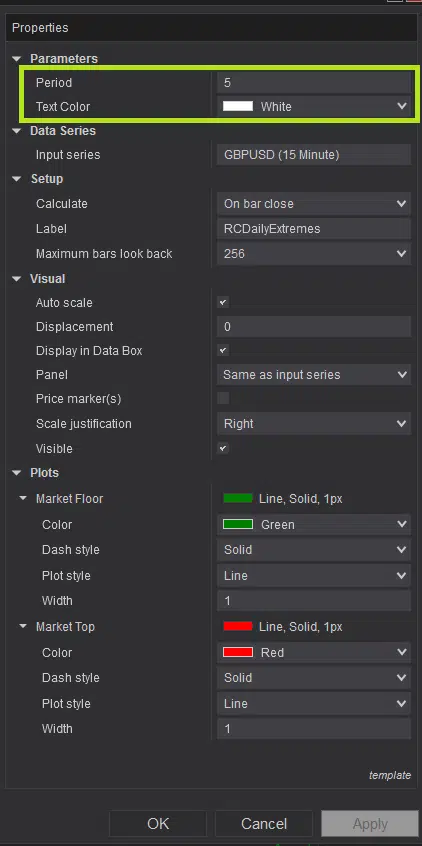
Image - 3 (Click to ZOOM)
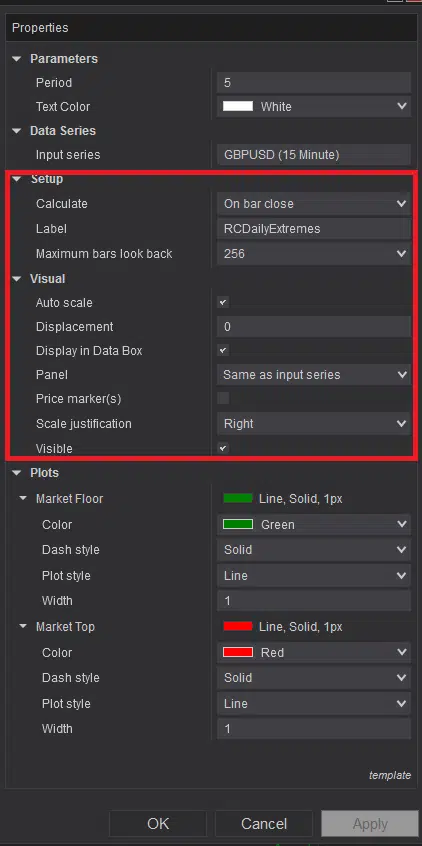
Image - 4 (Click to ZOOM)
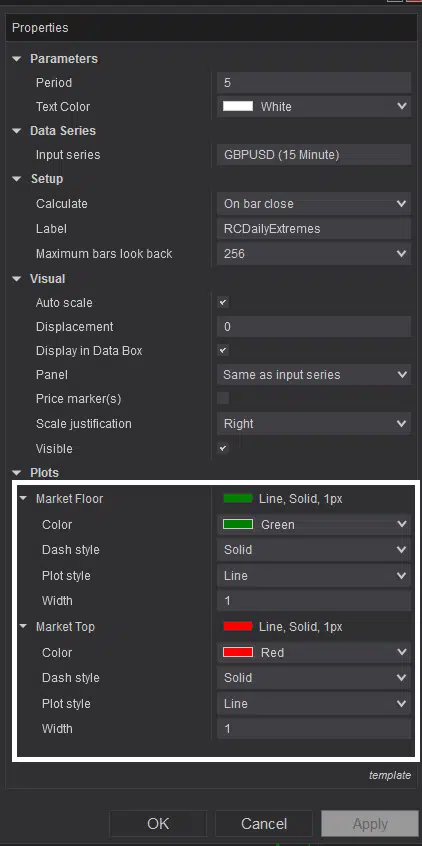
Image - 5 (Click to ZOOM)
Now you can change Period value or plotted text colors from the indicator’s settings which are marked by lime green rectangle in Image – 3. It is recommended not to change any default settings which are within red rectangle in Image – 4 for proper functioning of this indicator. Now, depending on your chart background or any purpose, if you decided to change the market top and floor lines colors, you can do that from parameters marked with white rectangle in Image -5.
However, if you still have any further query – please do watch the video tutorial above to understand how this indicator and settings works.