First month is always free to try. You PAY NOTHING for your trial period and it’s a no obligation trial period. There is no minimum term, if you don’t like it – you can cancel your subscription any time you want.
Try FREE for 1st MONTH
after first month just £14 /month
Your subscription will be processed through Paypal
If you are already subscribed to this indicator and want to unsubscribe, Please click here
WATCH THE VIDEO TO KNOW MORE ABOUT
Smart Money Levels - Premium Indicator
1st month FREE TRIAL
Access to all future updates
24/7 update and technical support
Cancel subscription anytime
Indicator Details:
Image - 1 (Click to ZOOM)
Image - 2 (Click to ZOOM)
Image - 3 (Click to ZOOM)
Image - 4 (Click to ZOOM)
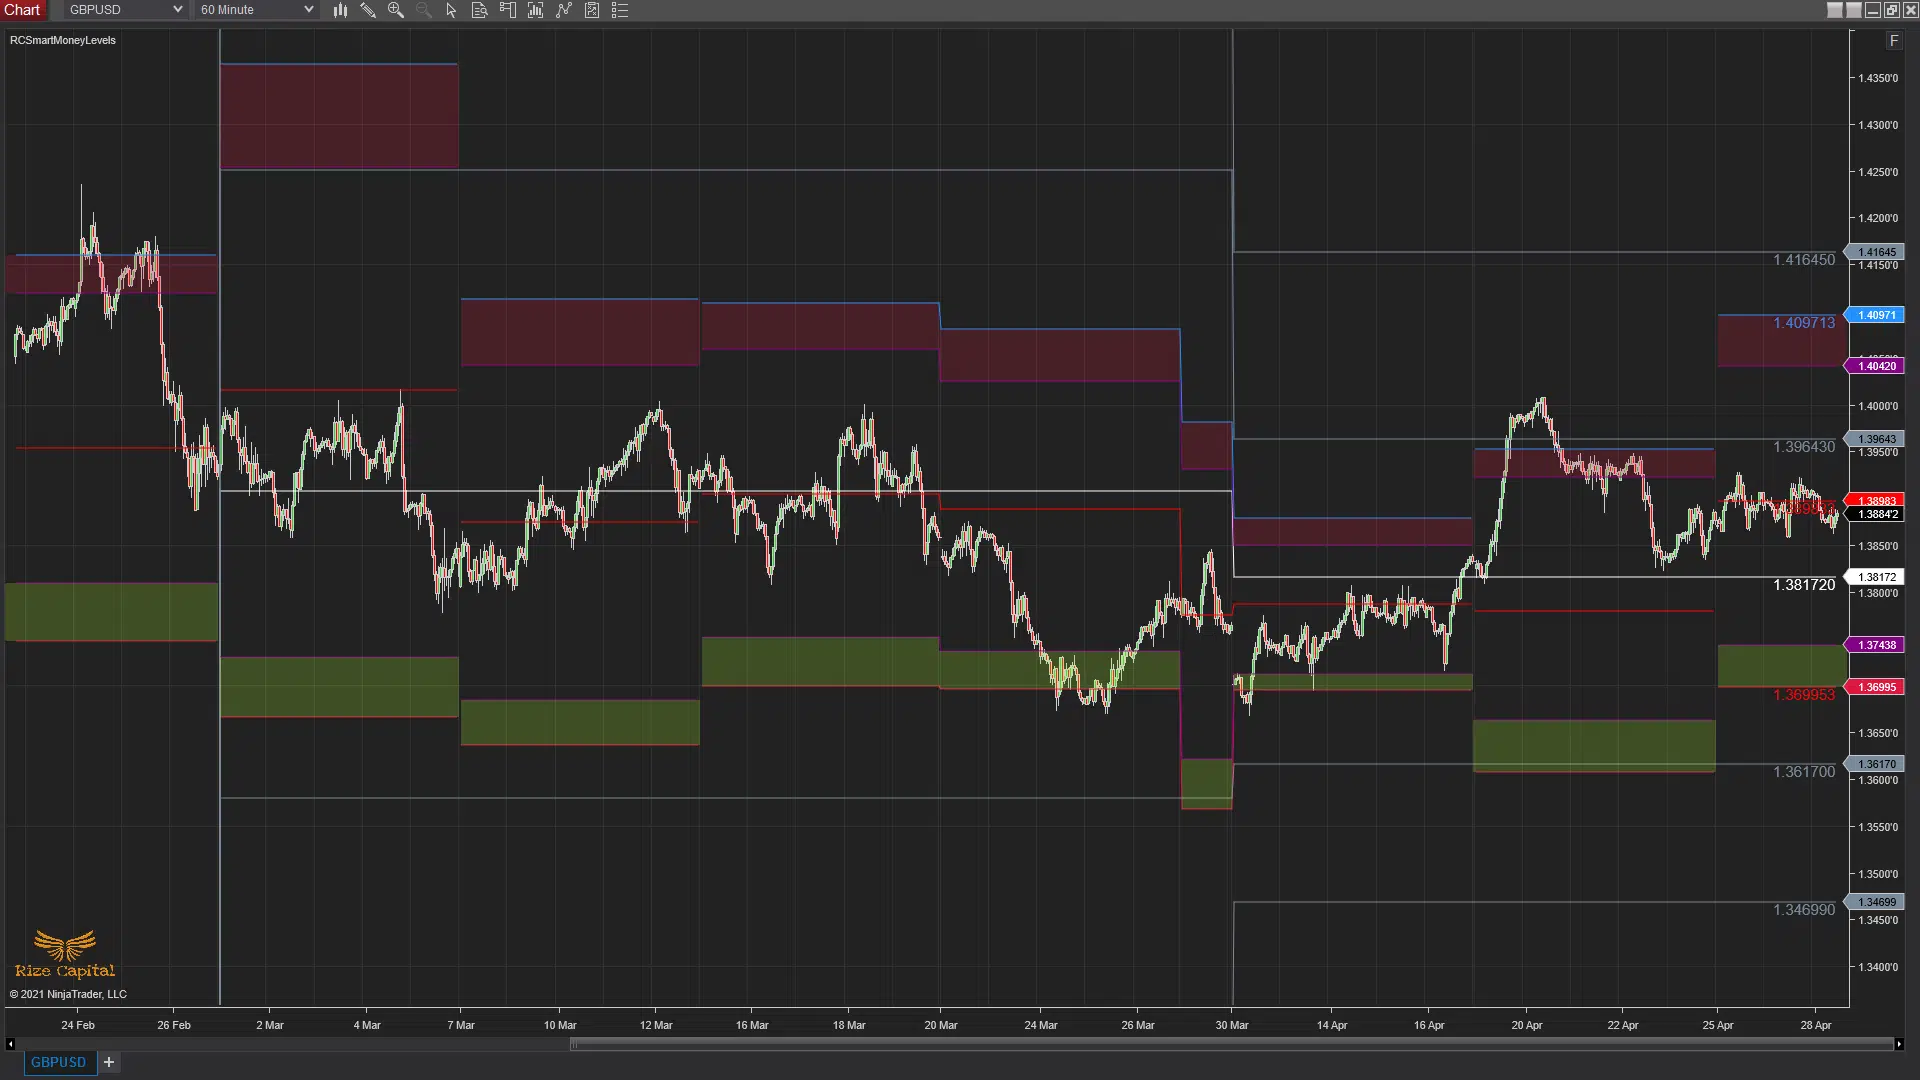
Smart Money Levels indicator is another custom programmed leading indicator developed by Rize capital to use on NinjaTrader 8 platform. When you add this indicator to your chart, it looks like Image -1. It plots different zones and levels on your chart to show you where the market is highly likely to react in future. As all these zones and levels are plotted start of the week and doesn’t change, it is such a effective leading indicator which will help you to know how different instruments will behave at different price levels in week ahead.
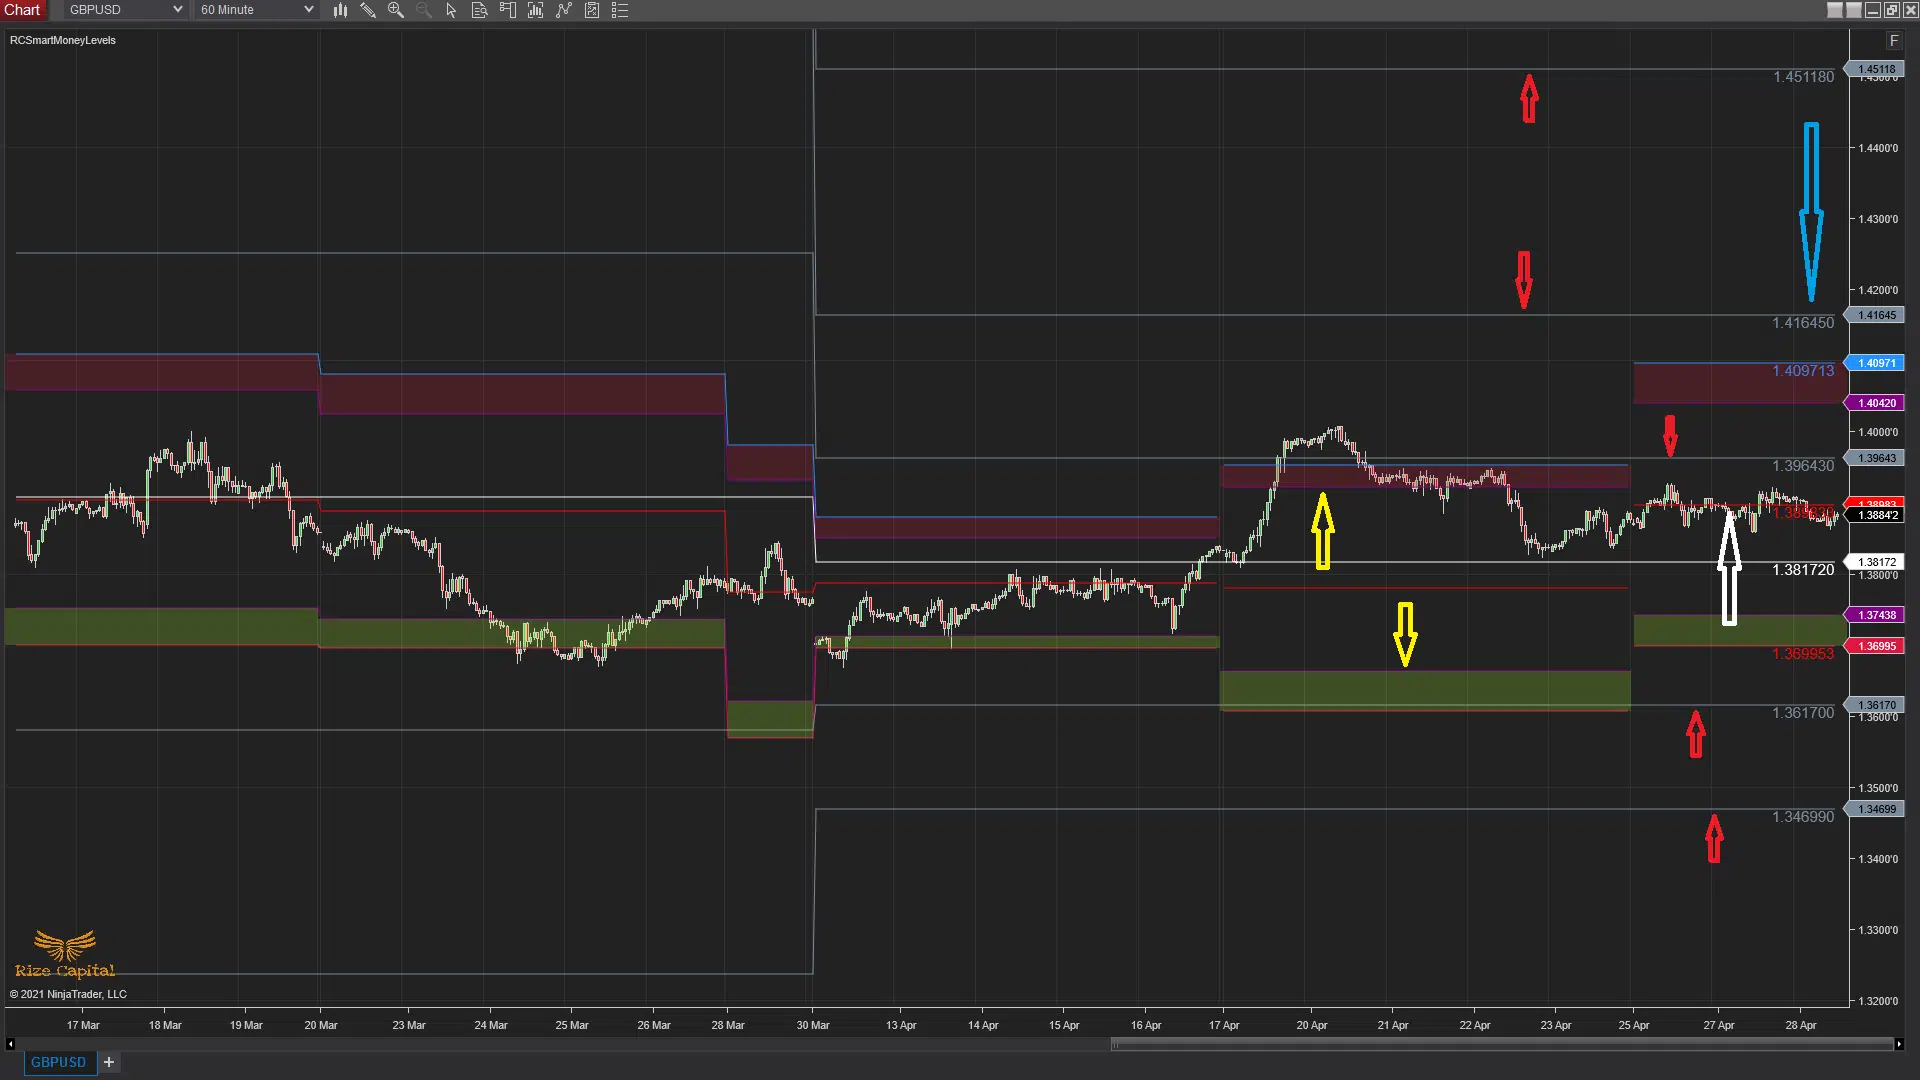
In Image – 2, lines marked with red arrows are plotted at the start of the month to give you heads up on important levels for the month at the very beginning of the month. Zones plotted in Red and Green colors which are marked with yellow arrows are plotted at the start of the week to give you competitive advantage and provides you important levels where market price is going to react and suitable zones to build a position with odds in your favour. You can also see the price labels of each line on the right margin of the chart, shown with blue down arrow in Image -2. Line pointed by white arrow is the weekly middle line to show you possible middle point of the market where it will have no trend and avoid placing any order as it is where most of the traders lose all the profits gained. Watch our video tutorial for understanding how this indicator works on chart.
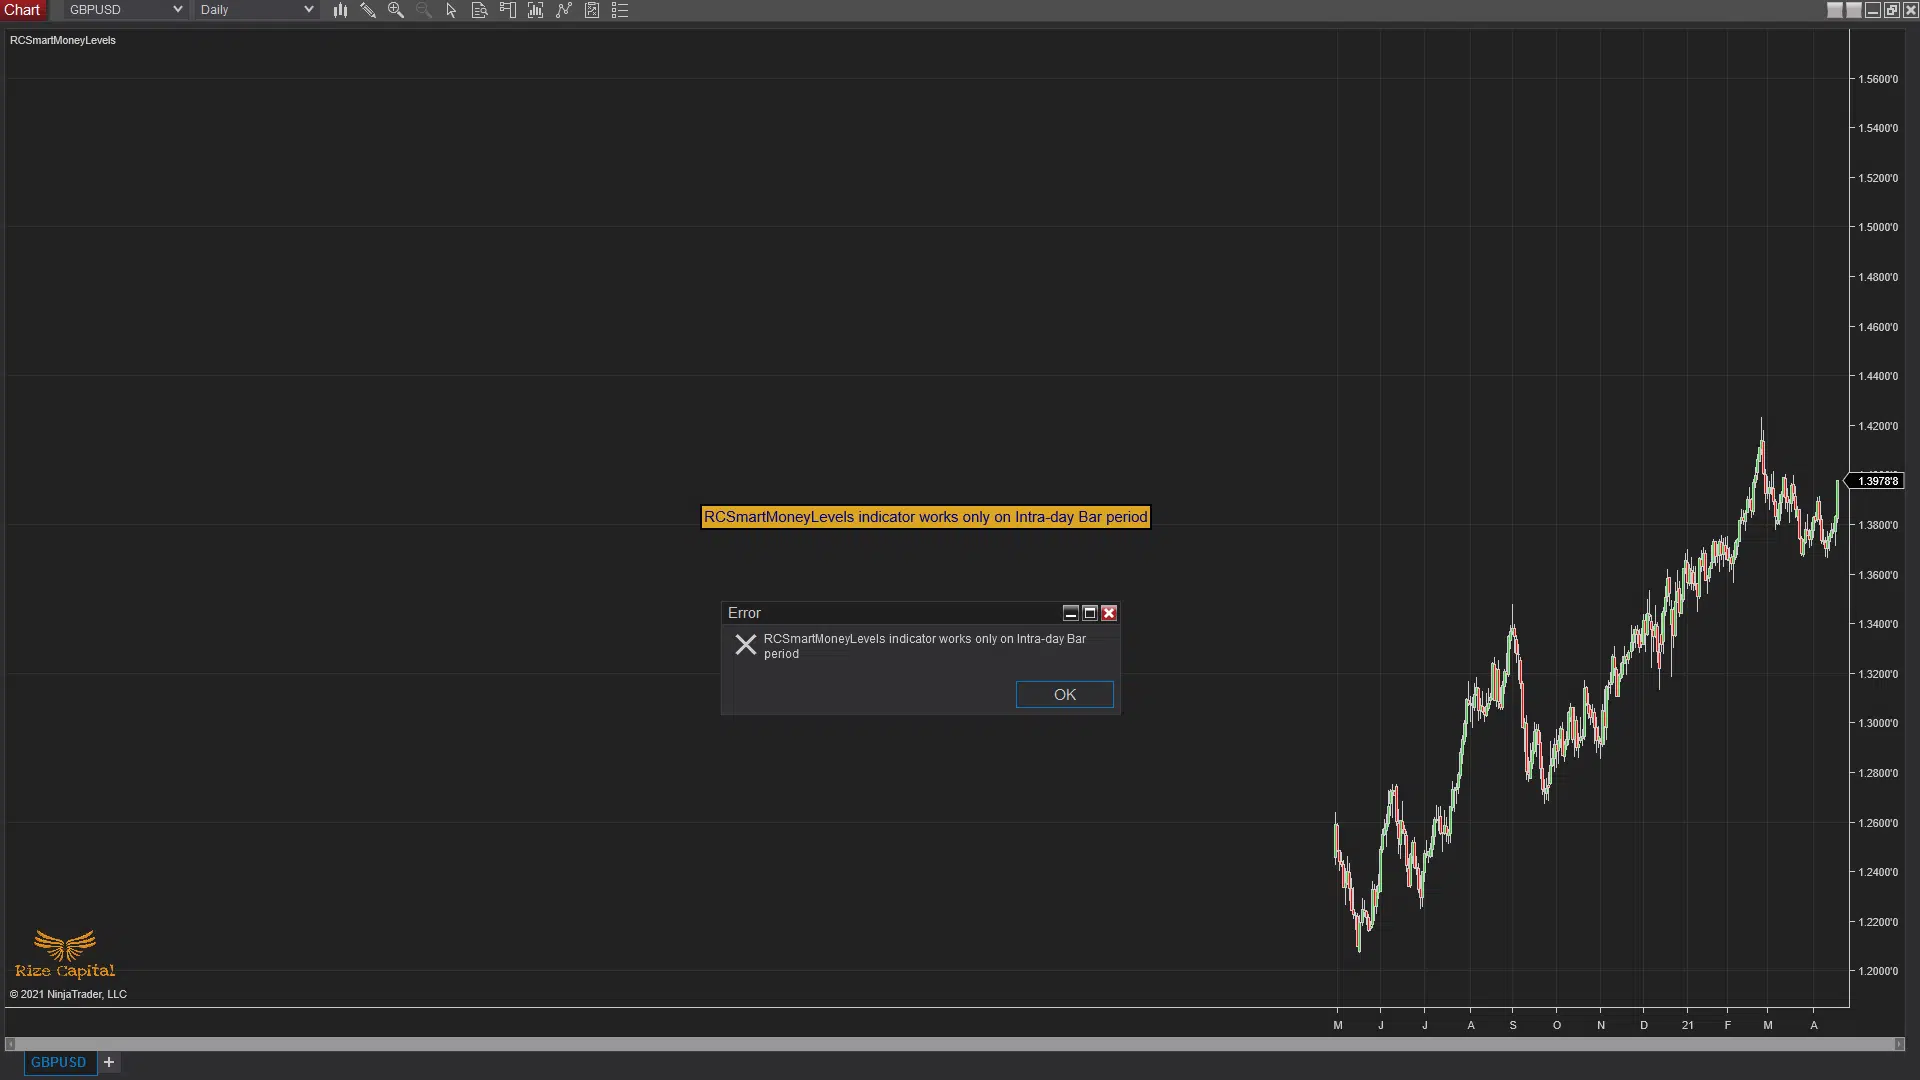
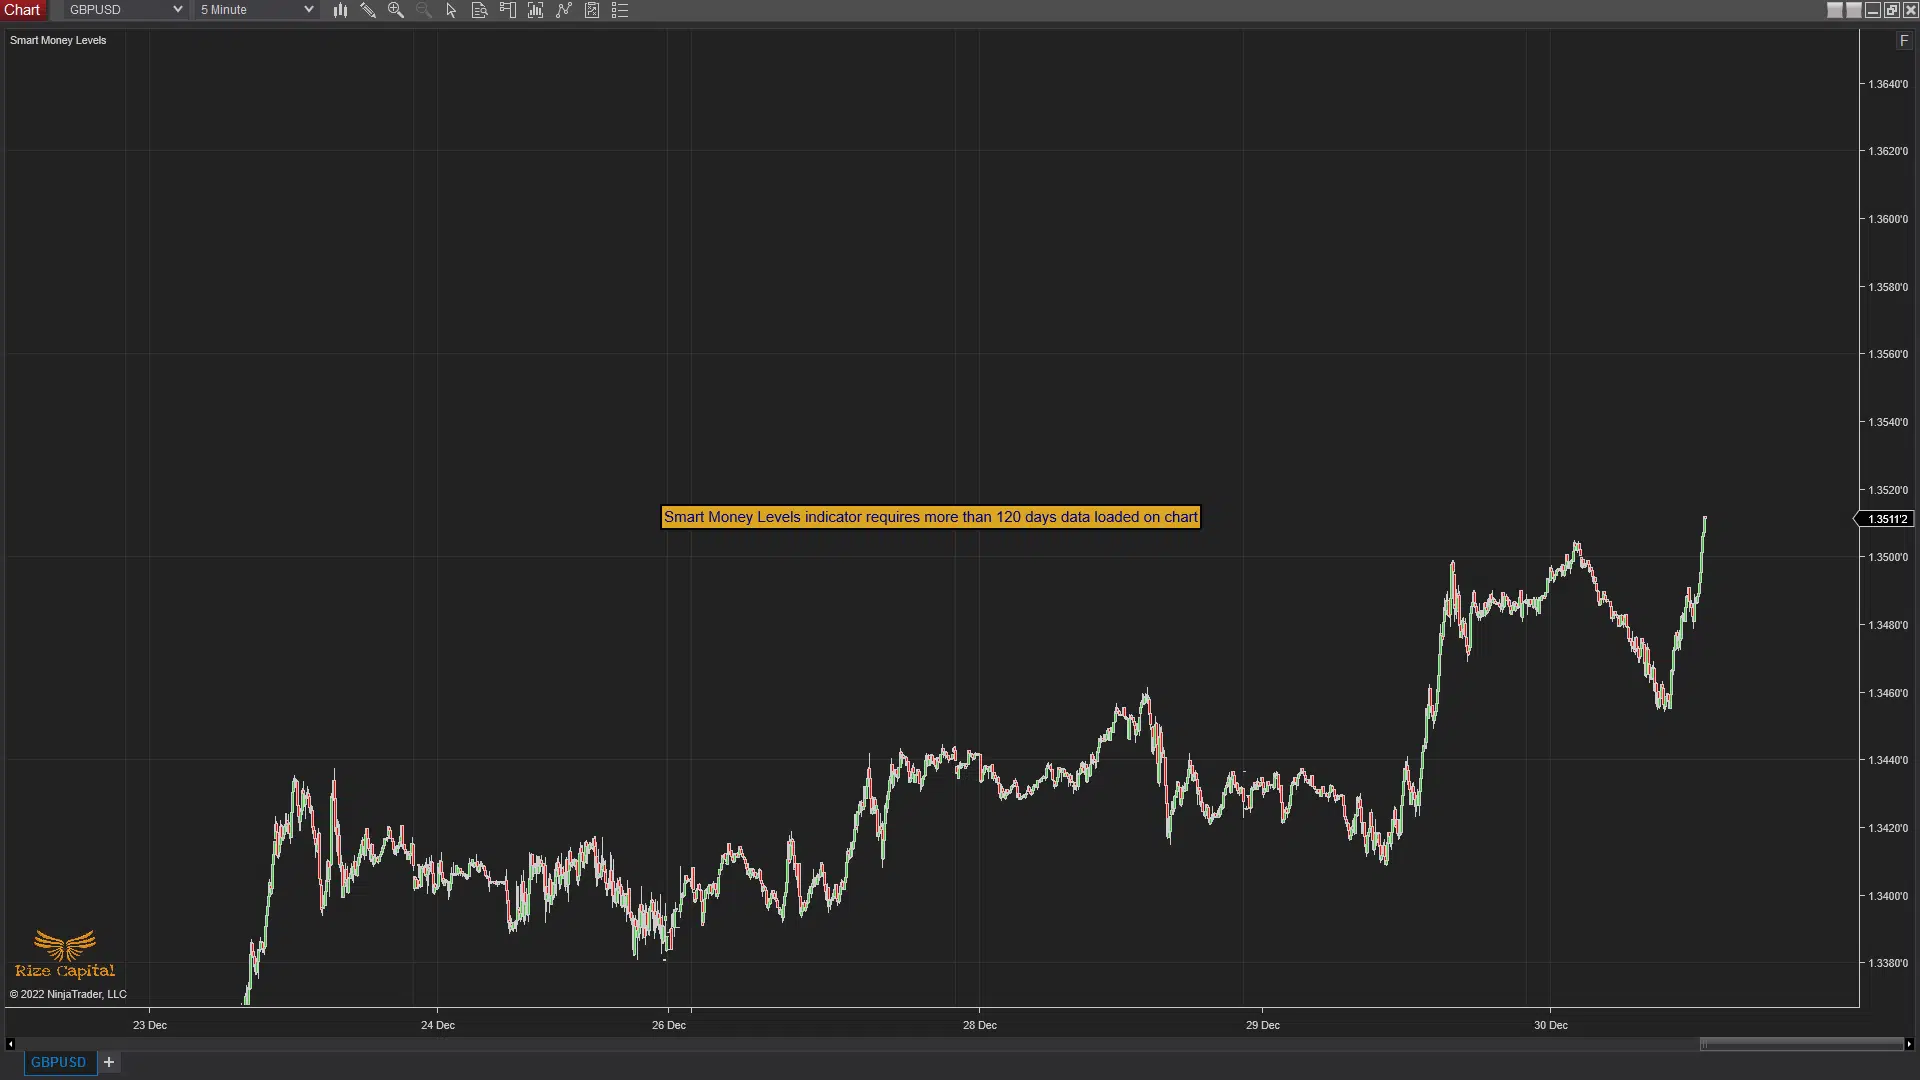
It is recommended to load minimum 120 days data on the chart; other wise you will see a message on chart and info on NT8 log to remind you about this (shown in Image -4). This indicator works on intra-day time frame only. In case if you forget to load intra-day time frame on your chart, you will see a reminder message on your chart as shown on Image -3. This indicator can be used on any market and any instrument.
Image - 5 (Click to ZOOM)
Image - 6 (Click to ZOOM)
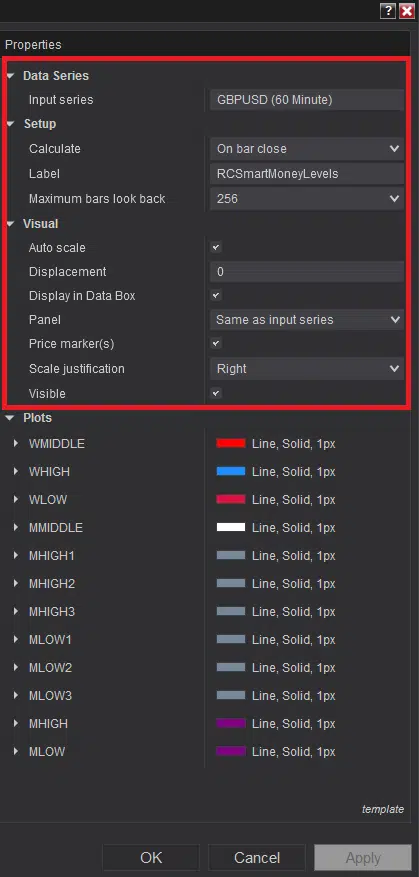
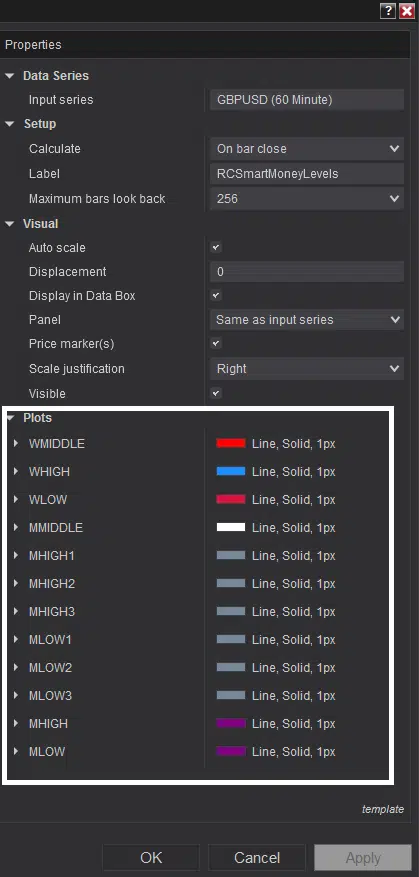
Now, it is recommended not to change any default settings marked with red rectangle in Image – 5. If you want to customize the colors of the lines or zones plotted on the chart, you can do that from the parameters marked with white rectangle in Image -6.
Upgrade Notes:
Version: 5.3.0.2
Price label plots updated to plot figures according to instrument
Plots' auto scaling corrected
Version: 5.3.0.1
Chart data load min requirement updated
Name Display updated
Version: 5.2.0.1
This can be used on any instrument
Minimum 120 days chart data requirement text plot added