First month is always free to try. You PAY NOTHING for your trial period and it’s a no obligation trial period. There is no minimum term, if you don’t like it – you can cancel your subscription any time you want.
Try FREE for 1st MONTH
after first month just £9 /month
Your subscription will be processed through Paypal
If you are already subscribed to this indicator and want to unsubscribe, Please click here
WATCH THE VIDEO TO KNOW MORE ABOUT
Point & Figure Entry Exit - Premium Indicator
1st month FREE TRIAL
Access to all future updates
24/7 update and technical support
Cancel subscription anytime
Indicator Details:
Image - 1 (Click to ZOOM)
Image - 2 (Click to ZOOM)
Image - 3 (Click to ZOOM)
Image - 4 (Click to ZOOM)
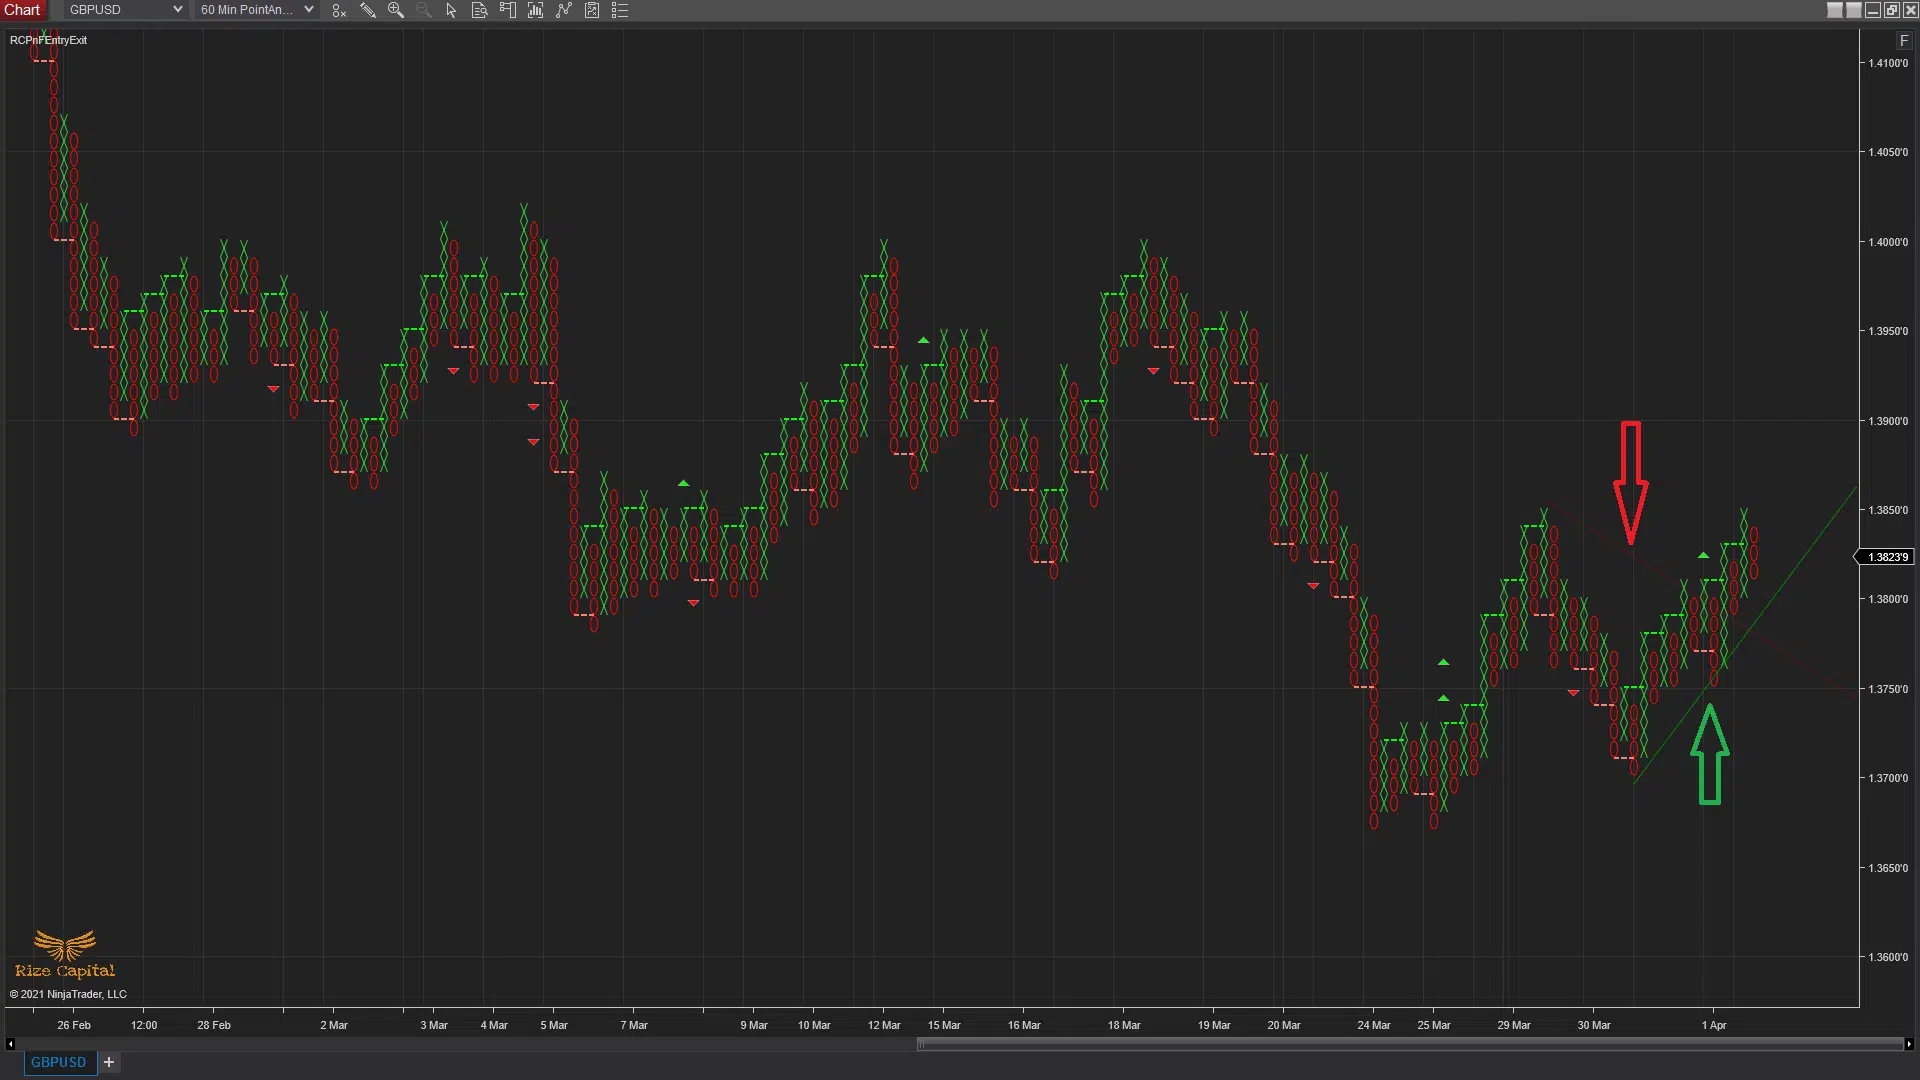
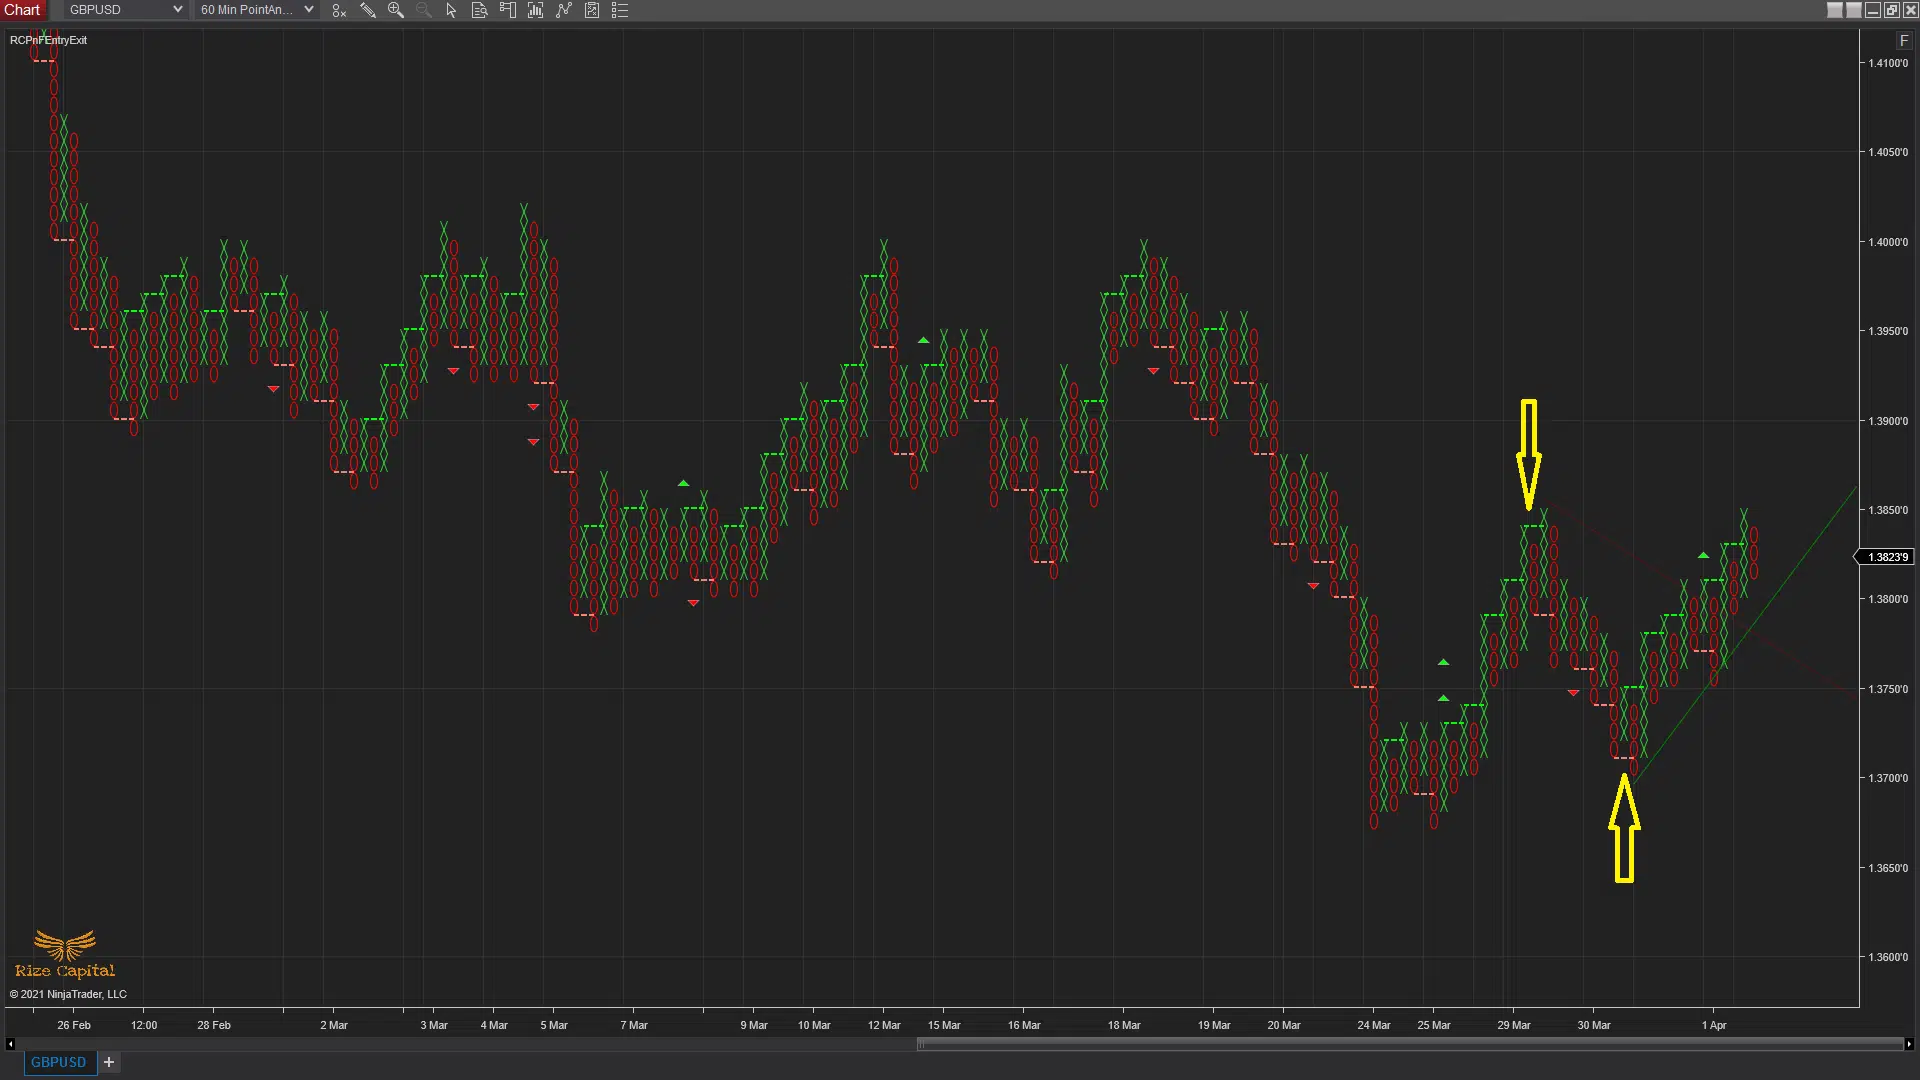
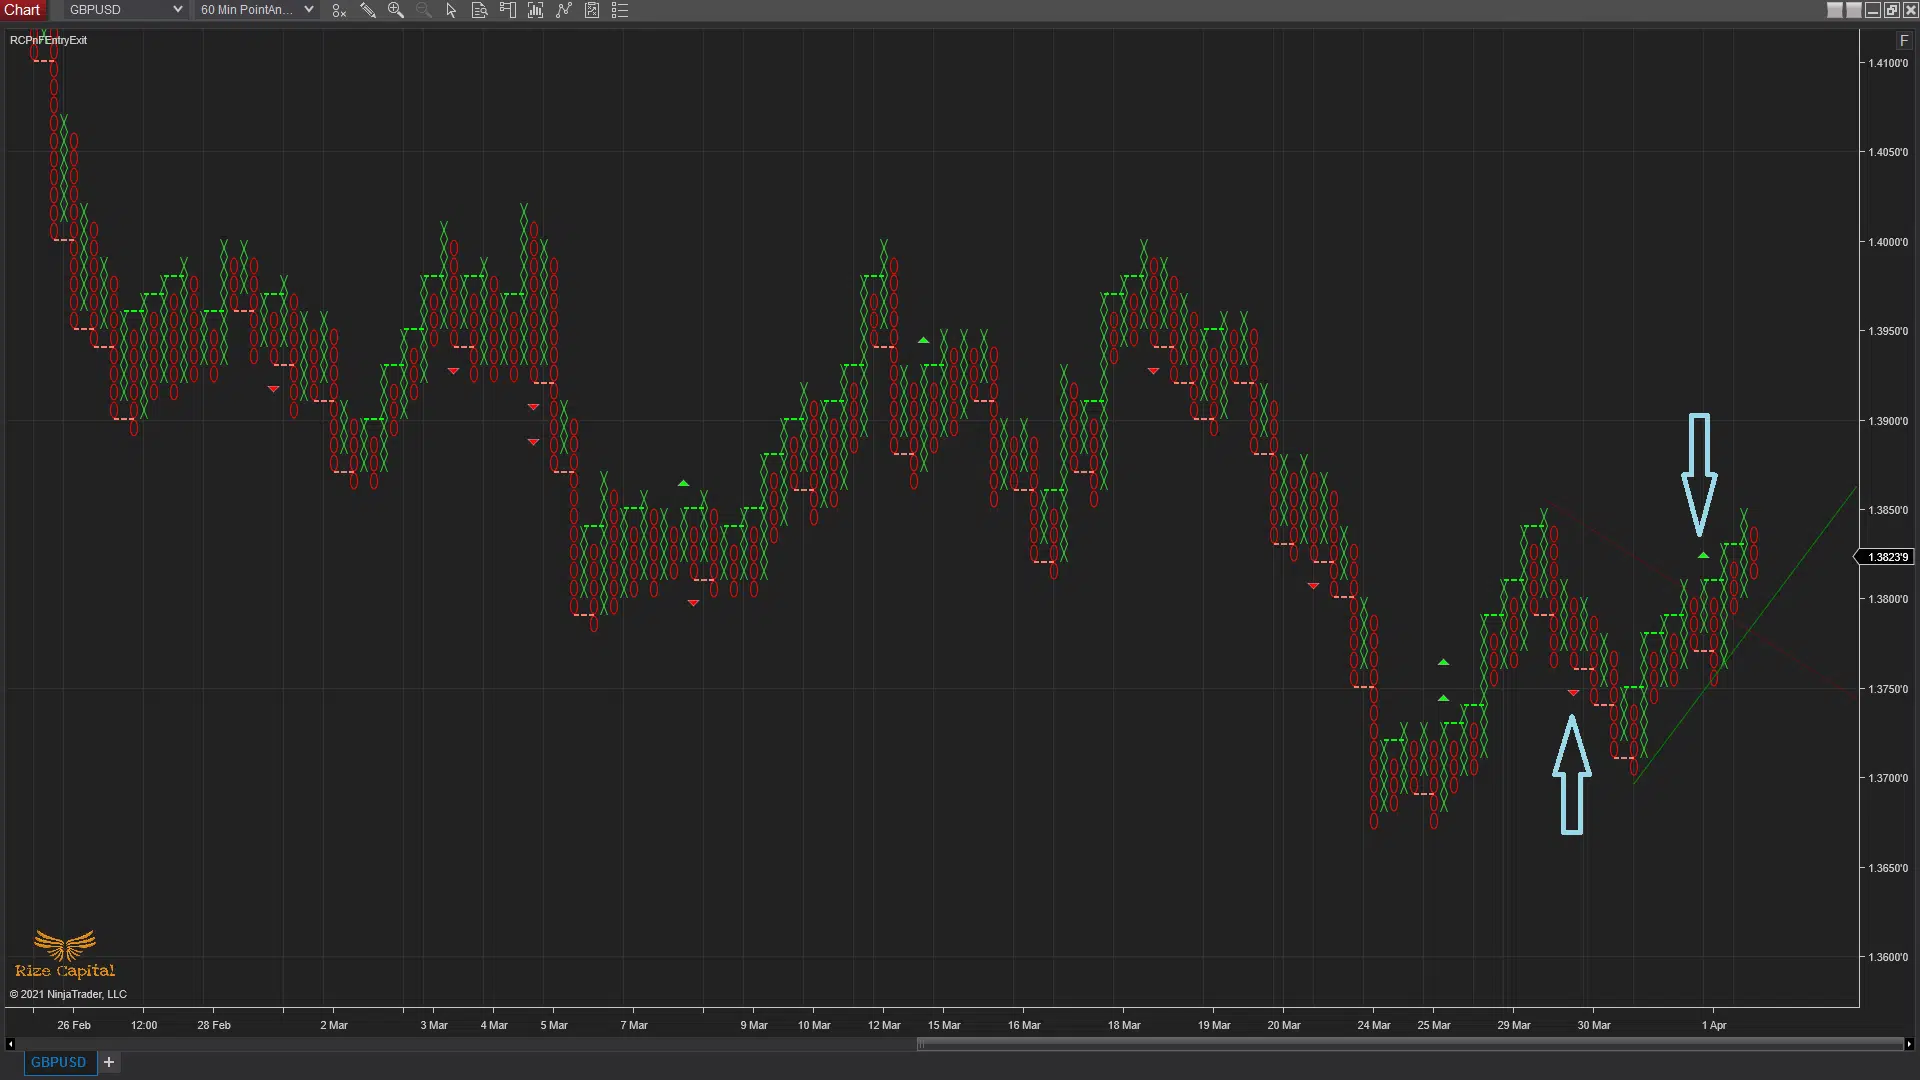
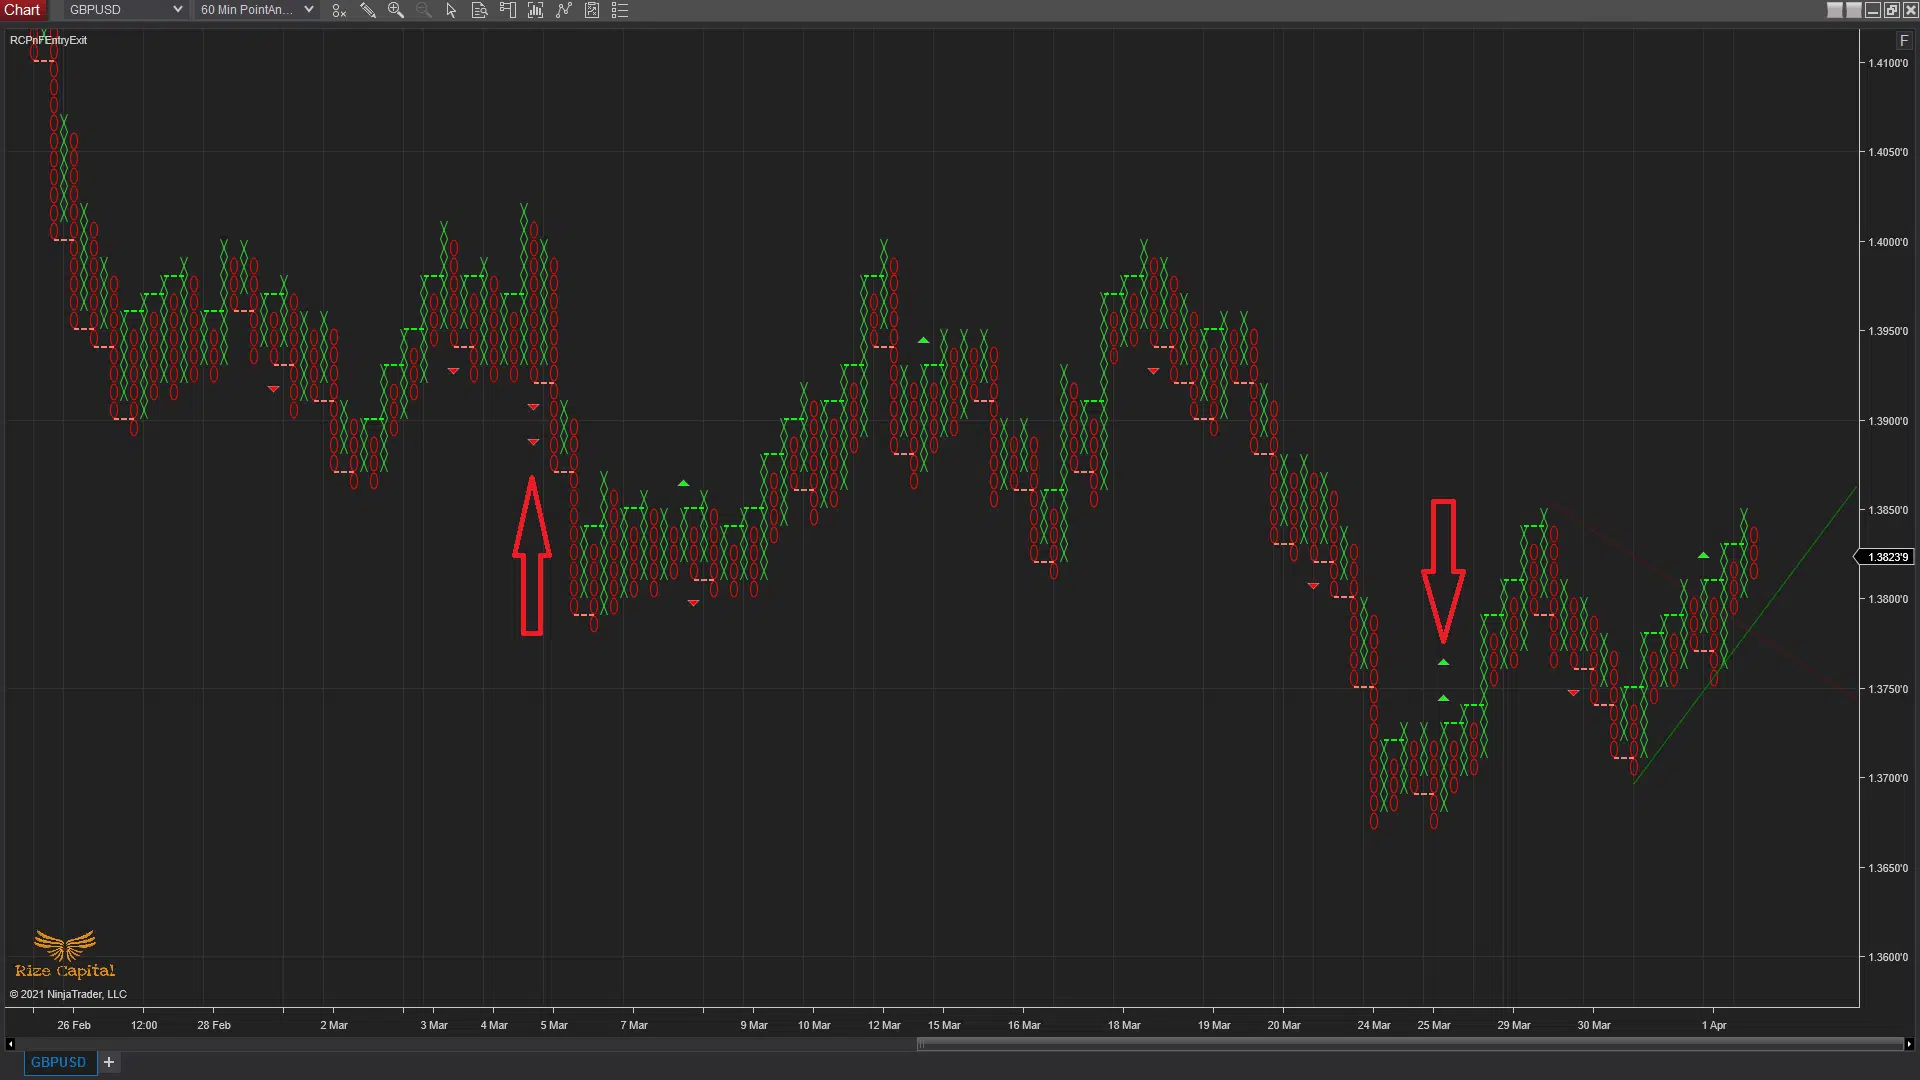
Point & Figure Entry Exit custom indicator for NinjaTrader 8 platform is developed by Rize Capital for professional traders who are passionate about using Point & Figure charts for their trading. Point & Figure charts are used mainly by professional traders who have got good in-depth knowledge about using this special charting type. However, if you use this indicator to your Point & Figure chart, it will make your trading decisions much easier with trading signals. This indicator plots Up and Down Trend lines to give you an idea about the current market trend, as shown with Green and Red arrows in Image -1. However, it will keep plotting buy and sell signals for trade entries, pointed by yellow arrows in Image 2, as well; where green lines are for buys and reds are for sells. If you prefer to take only double top buy and sell signals, this indicator automatically plots them on the chart for you as well, like signals pointed by light blue arrows in Image – 3. Double top buy and sell signals are plotted with additional 1 triangle where green triangle signals for buy and red for sell. Now, if you just want to take high probability Triple top buy and sell signals, then you can take the signals plotted with double triangles as pointed by red arrows in Image – 4; where double green triangles is for buy and double red triangles is for sell.
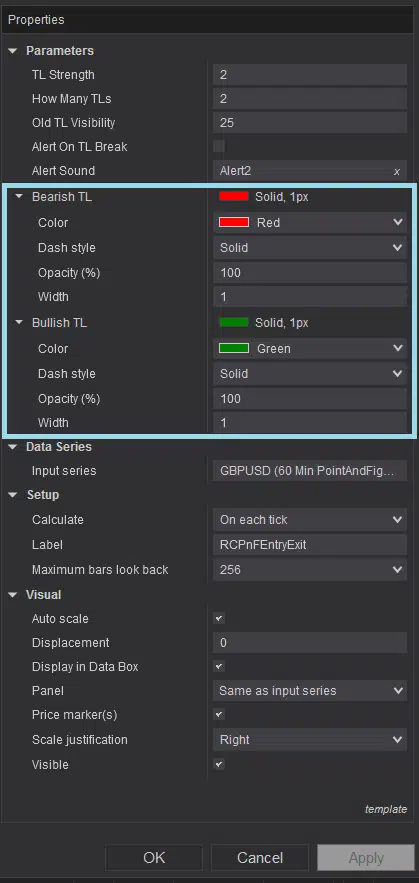
This indicator can be used on any market and any instrument. But can only be used on Point & Figure chart type; otherwise, you will see a reminder text on chart to change the chart type. If you don’t like to plot trend lines, then you can simply change the color of trend lines to transparent from indicator settings which is marked by light blue rectangle in Image – 7 below. But if you still want to keep the trend lines, but want to plot them with different colors and styles, you can customize them from the same settings option.
Image - 5 (Click to ZOOM)
Image - 6 (Click to ZOOM)
Image - 7 (Click to ZOOM)
Image - 8 (Click to ZOOM)
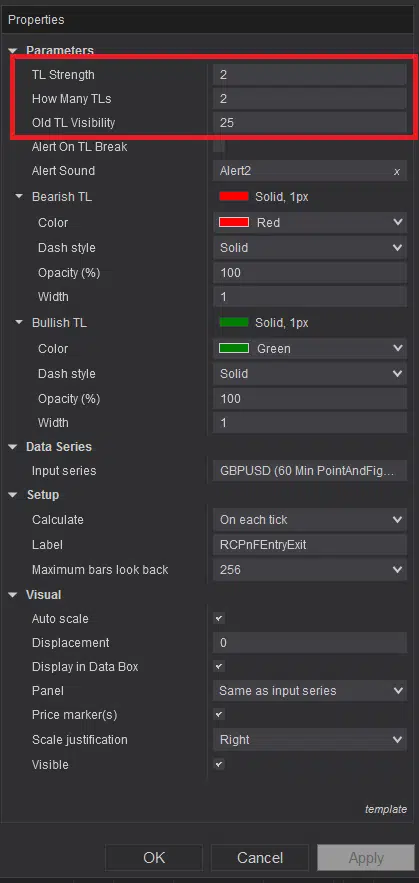
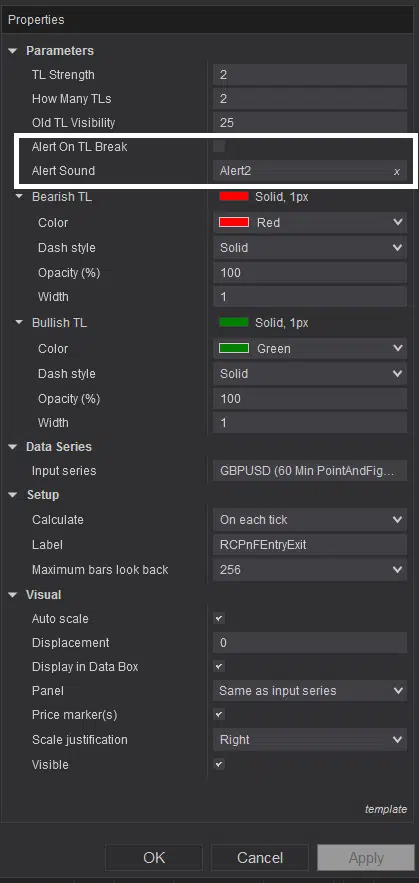
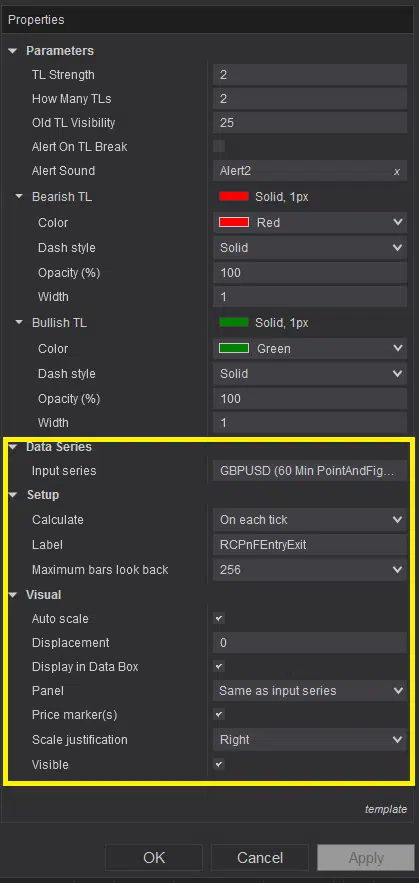
Now as shown in Image -5, you can setup your own trend line strength and number of trend lines you want to plot from the setting options marked by red rectangle. It also gives you an option to control the visibility of previous trend line with a value. Besides, if you want to activate an alert when the trend line is broken and specify a sound for that, you can do that from the options marked with white rectangle in Image -6. If you have decided to activate the alert, you just need to check the box; otherwise keep it unchecked. Settings option marked by yellow rectangle in Image -8, is the default settings. It is recommended not to change any of that for accurate functioning of this indicator.
If you still have further query or clarification needed, please watch the video tutorial above.
Upgrade Notes:
Version: 5.2.0.1
This can be used on any instrument
Parameter order reorganized
Indicator location folder updated
Script Optimized
Hard coded value is changed to dynamic for more accurate plots