


How to Trade the Bearish Engulfing Candlestick Pattern (Step-by-Step)
A bearish engulfing candlestick pattern occurs when a larger bearish candle completely engulfs the body of the preceding bullish candle.
You've spotted the pattern. Two candles. The first closes green. The second opens higher, then falls, closing red. The second candle's body completely engulfs the first. The textbook bearish engulfing candlestick pattern.
You take the short. Price drops initially. You feel validated. Then price reverses. Your stop triggers. The pattern failed. Again.
You've experienced this repeatedly. The bearish engulfing appears at what looks like a perfect turning point. You enter based on the pattern alone. Sometimes it works. Often it doesn't. You can't distinguish between valid signals and traps.
The problem isn't the pattern itself. Bearish engulfing formations do mark reversals—when they appear in the right context. Context is what most traders ignore. They see the two-candle pattern and trade it mechanically without understanding what it actually represents or when it matters.
What the Bearish Engulfing Actually Tells You
A bearish engulfing candlestick pattern occurs when a larger bearish candle completely engulfs the body of the preceding bullish candle. The pattern requires specific conditions:
- First candle closes bullish (close higher than open)
- Second candle opens at or above the first candle's close
- Second candle closes bearish (close lower than open)
- Second candle's body completely covers the first candle's body
The wicks don't matter for pattern identification. Only the bodies must satisfy the engulfing relationship. A small bullish candle followed by a large bearish candle that engulfs it—that's the formation.
But what does this formation actually indicate?
The first candle shows bullish sentiment. Buyers pushed price higher from open to close. Demand exceeded supply. The close near or at the high suggests strength continued until the end of the period.
The second candle opens with a gap up or at the previous close—initial continuation of bullish momentum. Then something changes. Sellers overwhelm buyers. Price doesn't just stall—it reverses completely, closing below the previous candle's open. The entire gain from the previous period gets erased, plus additional downward movement.
This sequence reveals a shift in control. What began as bullish continuation became bearish reversal within a single period. The larger the second candle relative to the first, the more decisive the shift.
You've seen this pattern fail because you've traded it without considering where it appears. A bearish engulfing at a major resistance level after a sustained uptrend carries different weight than one appearing in the middle of a range with no structural context.
Context: Where the Pattern Actually Matters
Bearish engulfing patterns appear constantly on any timeframe. Most are meaningless. The ones that matter share specific contextual characteristics.
- After an extended move higher. The pattern signals reversal. If price has been consolidating or already trending down, the bearish engulfing doesn't reverse anything—it's just another down candle. You need a preceding bullish move for the reversal to matter.
- At resistance levels. When bearish engulfing forms at a previous swing high, a volume-weighted equilibrium zone, or a round number where price historically reversed, the pattern confirms structural resistance. The candlestick formation adds conviction to a level that already matters.
- With volume confirmation. The second candle should show increased volume relative to recent averages. Higher volume validates that the reversal represents genuine participant commitment, not just random price fluctuation.
- Within momentum divergence. If oscillators like the Stochastic Momentum Index show weakening upward momentum whilst price makes new highs, the bearish engulfing confirms what momentum was already suggesting—upward pressure is exhausted.
Context transforms the bearish engulfing from a two-candle pattern into a confluence signal. The pattern itself shows what happened during those two periods. The context explains whether what happened matters for future price movement.
Step-by-Step: How to Trade Bearish Engulfing Candle
Step 1: Identify the Setup Conditions
Don't hunt for bearish engulfing patterns on your charts. Instead, identify areas where reversals would be structurally significant—resistance zones, overbought conditions, the upper bands of equilibrium channels. Then watch for bearish engulfing to appear at these levels.
This inverted approach prevents you from trading patterns in isolation. You've already determined that a reversal here would make structural sense. The bearish engulfing becomes confirmation, not the primary signal.
Use tools like MADBands Pro to identify volume-weighted equilibrium zones. When price stretches to the upper deviation bands—areas where historical volume shows previous resistance—those become candidate locations for bearish engulfing trades.
Step 2: Wait for Pattern Completion
The bearish engulfing requires two candles. The second must close. You cannot trade the pattern until the engulfing candle completes. This seems obvious but causes consistent errors.
You see the second candle opening higher and immediately falling. It looks like it will engulf the previous candle. You enter early, anticipating completion. Then price recovers. The candle closes higher than the previous close. No engulfing occurred. Your early entry turned a neutral bar into a losing trade.
Wait for the close. Confirm the engulfing relationship. Miss the first few ticks of the move. This patience prevents false entries on candles that ultimately don't complete the pattern.
Step 3: Validate Volume
Before entering, check the engulfing candle's volume. It should exceed the recent average, ideally by 50% or more. High volume confirms the reversal represents genuine selling pressure, not just profit-taking from a few participants.
Low volume bearish engulfing patterns fail frequently. The price action looks bearish but lacks conviction. Volume measures conviction. Without it, the pattern is cosmetic.
Step 4: Determine Entry Location
You have three entry options, each with different risk-reward profiles:
- Aggressive entry: Enter immediately when the engulfing candle closes. You get the best price but the highest risk—no confirmation beyond the pattern itself.
- Confirmation entry: Wait for the next candle to break below the engulfing candle's low. This confirms sellers remain in control. You sacrifice some initial move but reduce false signal risk substantially.
- Pullback entry: Wait for price to retrace toward the engulfing candle's close or the resistance level, then enter when selling resumes. This optimises entry price but risks missing the move entirely if price doesn't pull back.
Most traders should use confirmation entry. The aggressive approach requires exceptional skill in reading context. The pullback approach frequently results in missed trades. Confirmation entry balances getting involved with avoiding obvious failures.
Step 5: Place Your Stop Loss
Your stop goes above the engulfing candle's high. If price trades above that level, the bearish reversal has failed. The location where you thought resistance would hold didn't. The pattern is invalidated.
Some traders place stops above the swing high that preceded the bearish engulfing. This wider stop accounts for potential volatility but requires smaller position sizing to maintain consistent risk per trade.
Never use arbitrary stop distances like "20 ticks above entry" or "1% above the high." Your stop location should reflect market structure. The engulfing candle's high represents the structural invalidation point—where the bearish thesis fails objectively.
Step 6: Set Your Profit Target
The measured move approach projects the engulfing candle's range downward from the entry. If the engulfing candle spans 50 ticks, target 50 ticks below your entry. This assumes the reversal will produce a move at least as large as the pattern itself.
More sophisticated targeting uses support levels. Identify the next structural support—previous swing low, volume-weighted equilibrium zone, or lower deviation band. That becomes your initial target. You're not projecting arbitrary distances. You're trading to the next level where buyers might re-engage.
Partial profit-taking makes sense with bearish engulfing trades. Take half your position off at a conservative target like the measured move. Let the remainder run to structural support with a trailing stop. This approach captures immediate profit whilst leaving exposure for larger reversals.
Step 7: Manage the Trade
Once entered, your primary management task is determining whether the reversal is developing or failing. Watch the candles that form after your entry.
If price immediately accelerates downward with strong bearish candles, the reversal is confirmed. Trail your stop to protect profits but allow room for the move to develop.
If price consolidates sideways just below the engulfing candle, the reversal lacks momentum. Consider exiting at breakeven. The pattern appeared but isn't producing follow-through. Weak reversals often lead to trend resumption.
If price grinds slowly lower with small candles and frequent pullbacks, you have a marginal reversal. Keep your stop at the original location but be prepared to exit if price reclaims the engulfing candle's midpoint. Weak downward movement often precedes failure.
Common Mistakes That Destroy Bearish Engulfing Trades
- Trading the pattern anywhere it appears. You've done this. Every bearish engulfing looks significant when it forms. Without context—resistance levels, momentum divergence, volume confirmation—the pattern is just two candles.
- Entering before the engulfing candle closes. The pattern requires completion. Early entry converts what might have been a passing observation into an actual losing trade.
- Ignoring volume. Price patterns without volume backing fail regularly. Volume is the voice of conviction. Silent patterns rarely produce significant moves.
- Using fixed stops instead of structural stops. Your stop distance should reflect the structure, not your preferred risk level. If the structural stop is too wide for your risk tolerance, reduce position size or skip the trade.
- Holding for arbitrary targets. Profit targets should align with market structure. The measured move provides a baseline, but trading to the next support level better reflects how price actually moves through structure.
- Trading bearish engulfing in strong uptrends. Counter-trend patterns in strong trends fail more often than they succeed. The bearish engulfing might produce a pullback within the larger uptrend, but it rarely marks the trend's end. You need multiple timeframe alignment for high-probability reversal trades.
Combining Bearish Engulfing With Other Analysis
The bearish engulfing works best as confirmation within a broader analytical framework. You've identified a resistance zone through volume-weighted equilibrium analysis. Momentum indicators show divergence. Then bearish engulfing appears at this confluence. Now you have multiple independent sources agreeing that reversal is likely.
This multi-factor approach requires more patience. You'll identify fewer trades. The ones you identify will have higher win rates because you're not relying on a single two-candle pattern. You're using the pattern as one piece of evidence within a complete structural case.
Tools like MADBands Pro identify equilibrium zones based on volume-weighted median absolute deviation. When price stretches to the upper bands and forms bearish engulfing, you have both structural and pattern-based reversal signals. This combination substantially improves probability.
What Bearish Engulfing Can't Tell You
The pattern shows that sellers overwhelmed buyers during a specific period. It doesn't show:
- Whether this represents a minor pullback or major reversal
- How far the reversal will extend
- Whether buying pressure will re-emerge quickly
- What's happening on higher timeframes
- Whether the overall market structure supports continuation of the reversal
You've learned this with other indicators and patterns. No single signal provides complete information. Trading requires assembling multiple pieces of evidence, each contributing partial information about probable future price behaviour.
The bearish engulfing contributes one piece: within these two periods, bullish momentum failed and bearish control emerged. What you do with that information depends entirely on the surrounding context.
Building Versus Recognising Patterns
You could automate bearish engulfing detection. Write code that scans for the specific candle relationships. Alert when patterns appear at resistance levels with volume confirmation. Build a complete pattern recognition system.
Or you could develop the skill to recognise significant patterns visually within structural context. This skill develops through screen time and focused observation. You learn to see potential reversal locations first, then notice when patterns confirm your structural read.
Both approaches work. Automated detection ensures you never miss a pattern. Manual recognition ensures you only engage with patterns that appear within your complete analysis framework. Most traders benefit from combining both—automated scanning that brings patterns to your attention, manual evaluation that determines whether the context warrants a trade.
The bearish engulfing candlestick pattern isn't complex. Two candles. Specific relationship between them. What's complex is knowing when it matters and when it's simply noise in an ongoing trend.
You've traded patterns mechanically before. You've learned that mechanical pattern trading produces mechanical results—lots of signals, inconsistent outcomes, no edge. The bearish engulfing becomes valuable when you stop treating it as a standalone signal and start using it as confirmation within structural analysis.
Context transforms the pattern from a curiosity into a tradeable signal. Without context, it's just two candles.

Shariful Hoque
SEO Content Writer
Shariful Hoque is an experienced content writer with a knack for creating SEO-friendly blogs, marketing copies and scripts.
Related Posts
Best Trend Indicators for NinjaTrader 8: Your Complete Guide
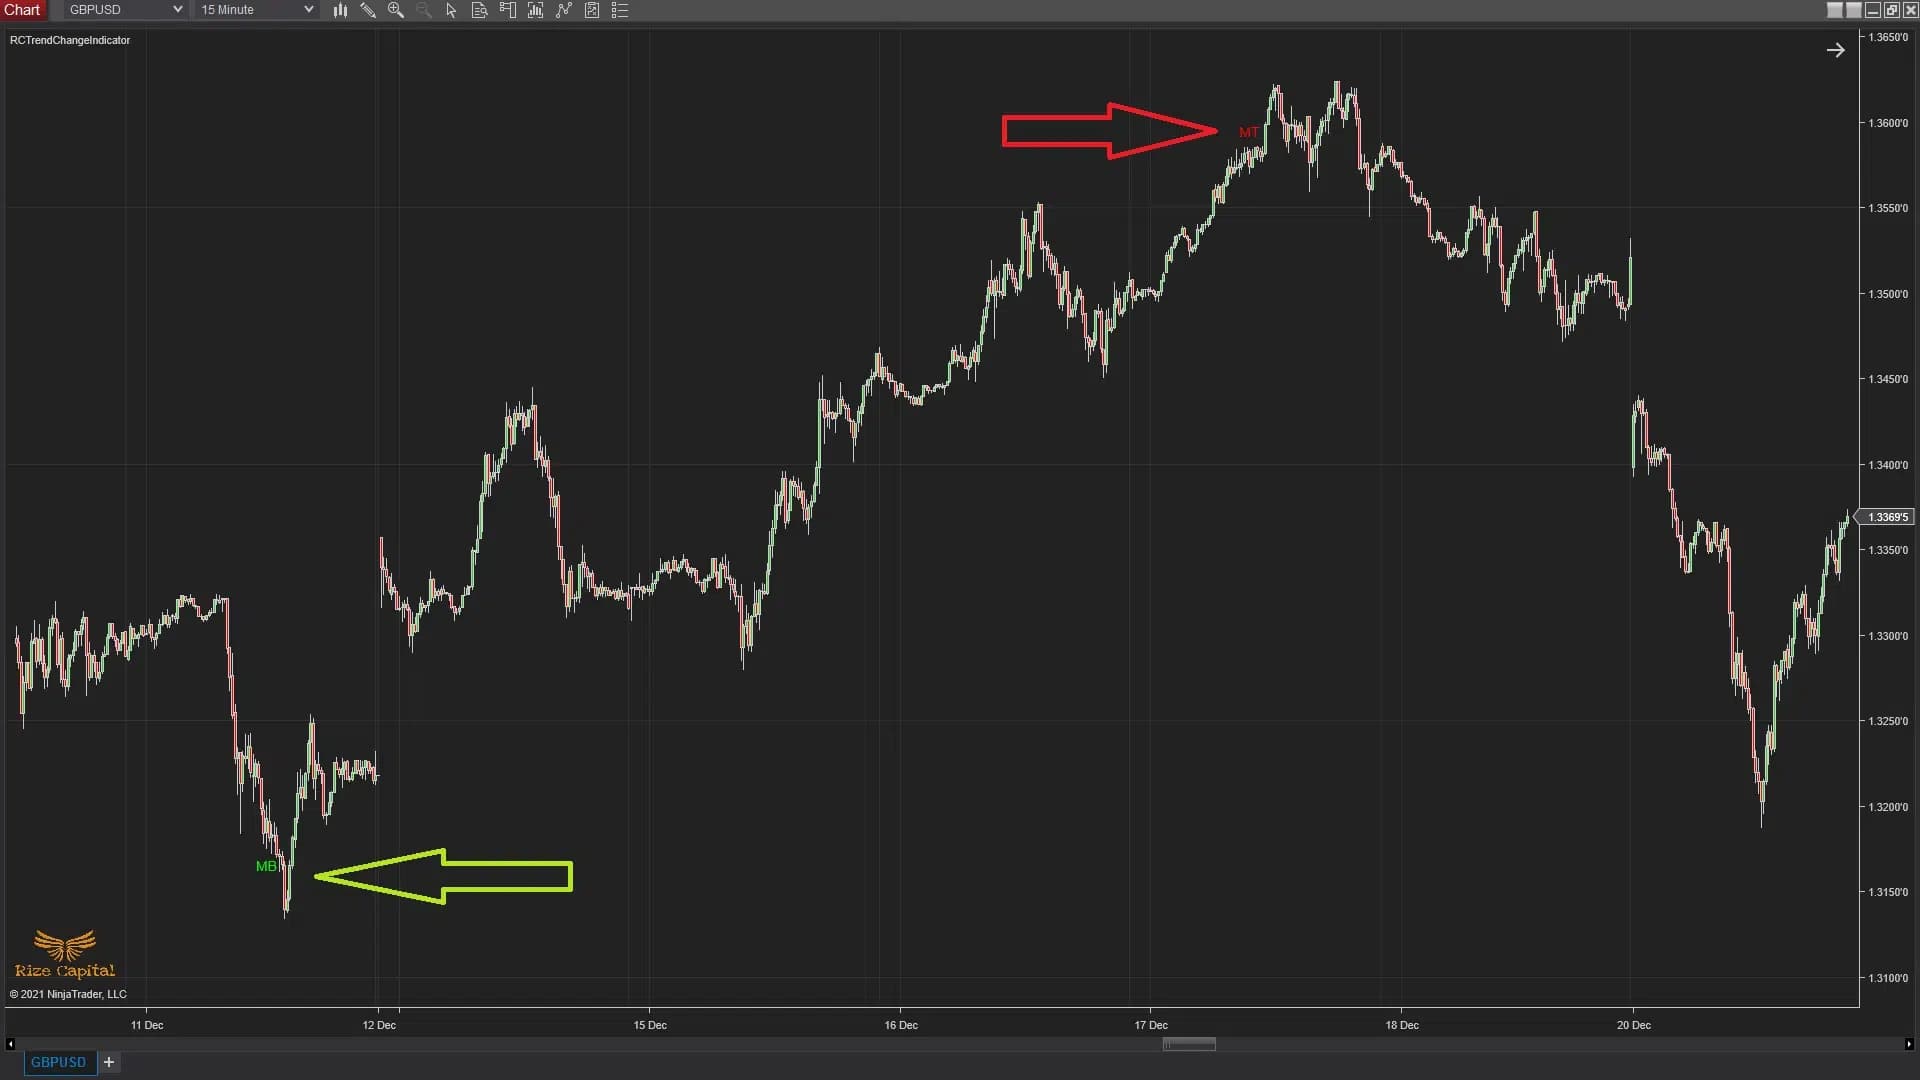
The Trend Change Indicator excels at predicting significant trend changes before they actually occur.

The Top 5 Mistakes Every New Trader Makes
New to trading? Don’t fall into common mistakes, learn what to avoid and grow with confidence.

What is Scalping Trading?
What if you could make a profit in just minutes? Scalping trading reveals the fast-paced world of small trades with big potential.
