


Master Market Volatility with the Daily Change Indicator
Learn about the Free Daily Change Indicator for NinjaTrader 8. Display real-time daily price changes as percentages on your chart.
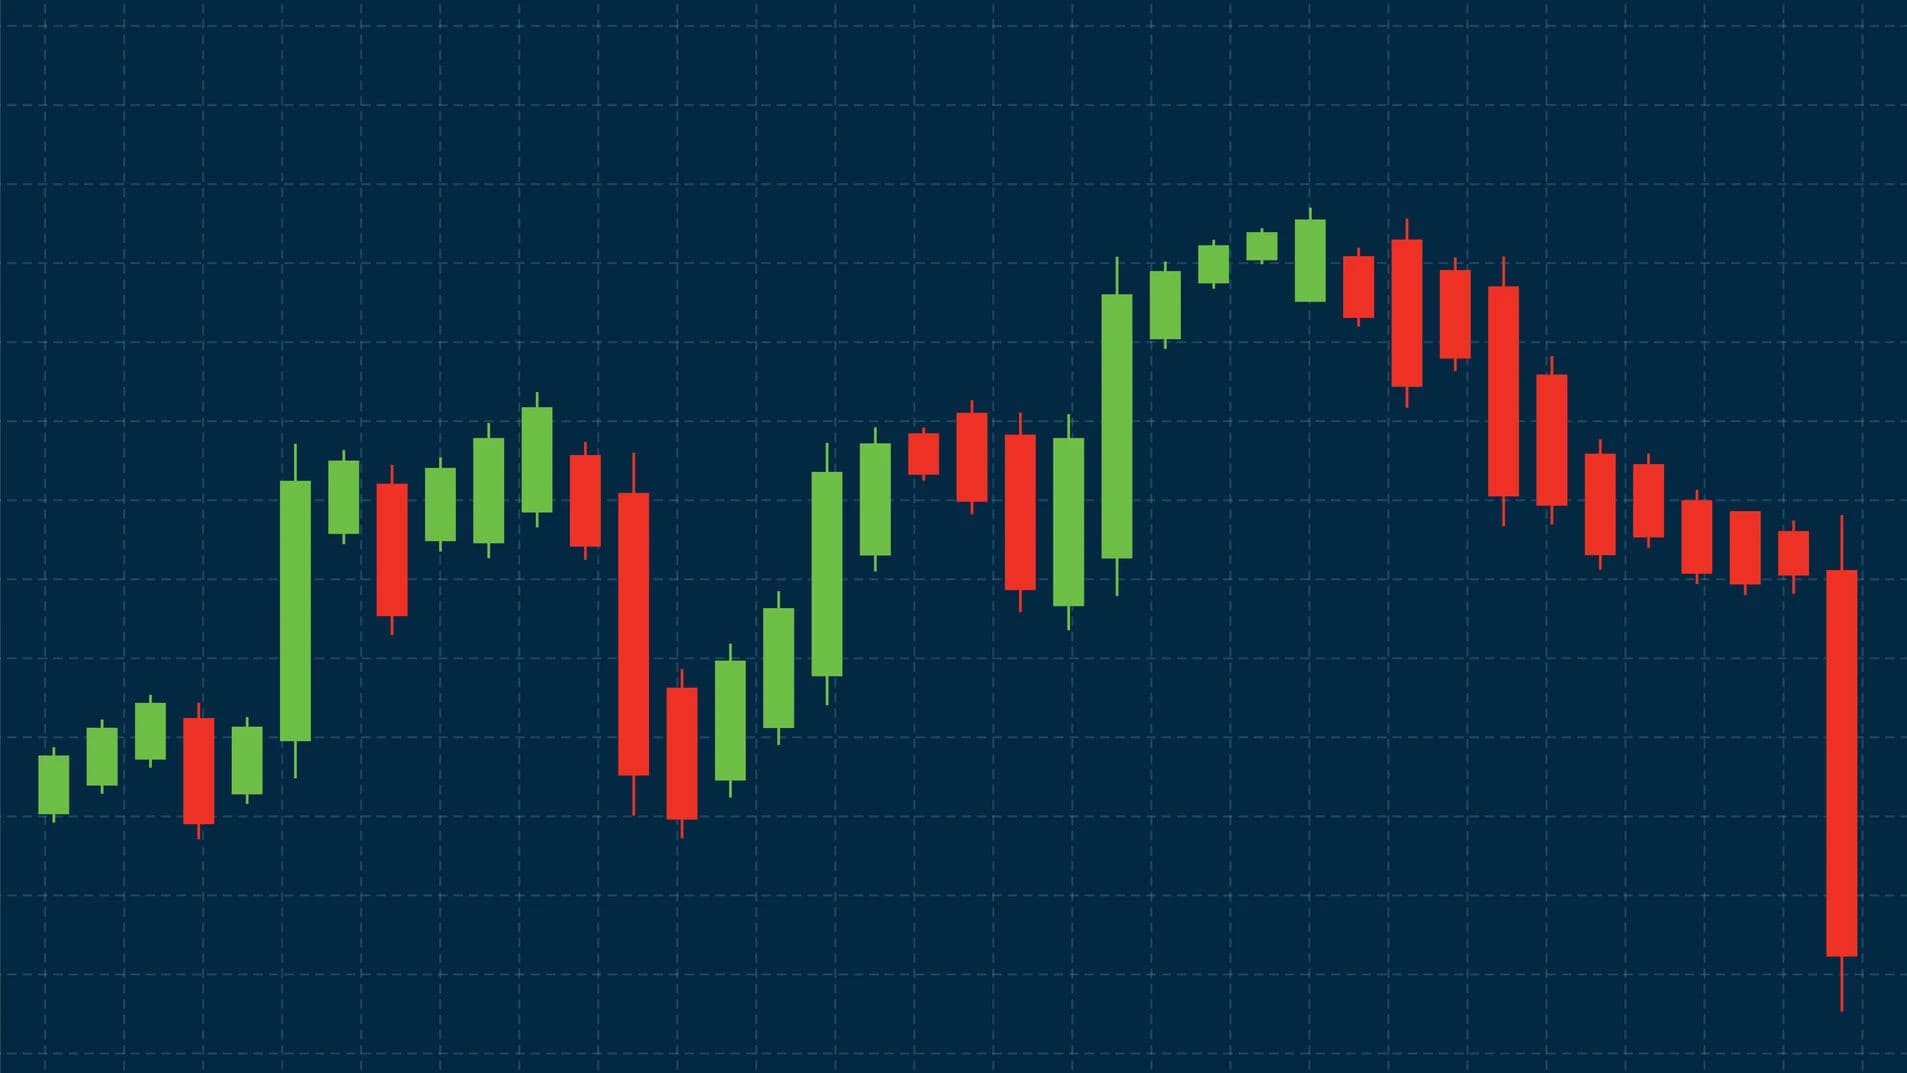
The financial markets are a fast-paced industry, and it is important to know what price changes happen on a day-to-day basis in order to make informed trading decisions. The NinjaTrader 8 Daily Change Indicator is a priceless tool that has completely changed the way traders view market volatility and daily price movement on all financial instruments.
This advanced but beautifully simple indicator shows the percentage changes in prices day by day as easily understandable percentages on your chart, giving you a real-time visual response to market performance. The Daily Change Indicator provides you with the most important information in a format that is simple to understand and easy to read, not a mess of other complex oscillators or multi-layered indicators that only serve to clutter your trading environment.
Tracking price fluctuations daily is a crucial aspect that cannot be overemphasised in contemporary trading techniques. As a day trader who is taking advantage of intraday volatility, a swing trader who is evaluating the change in momentum, or a position trader who is evaluating a longer-term trend, how much an instrument has moved in the current trading session is vital context to your trading decisions. This indicator uses that critical data to produce actionable intelligence that will enable you to spot high-volatility opportunity areas and evaluate market sentiment, and to time your entrances and exits more accurately in any market environment.
Understanding Daily Price Change Analysis
The analysis of daily price change is the basis of most successful trading strategies, and many traders ignore this simple fact of market behaviour. The Daily Change Indicator is the solution to this omission, as it not only displays daily percentage changes instantly and clearly on any given chart setup, but it is also easy to read and understand.
Typical price charts demonstrate absolute price changes, yet these bare numbers do not typically offer adequate framing of the meaning of the price changes. A PS10 move in a PS1000 stock will be a change of 1% and the same PS10 move in a PS50 stock will be a massive 20% change. To eliminate this confusion, the Daily Change Indicator shows all price changes in standardised terms expressed in percentage changes.
The Psychology of Daily Changes
An important part of the development of daily price changes and subsequent trading behaviour is dependent on market psychology. Big positive changes tend to draw momentum buyers who worry about missing the ongoing gains, and big negative changes may cause panic selling or attract value buyers who want bargains.
The Daily Change Indicator helps traders to learn about these psychological processes, as the unusual movements in prices are immediately confirmed visually. Daily changes above historical averages are an indication that something underlying has changed in market sentiment, whether as a result of news events, technical breakouts, or institutional action.
Such psychological understanding is especially useful to day traders who have to be able to quickly evaluate the nature of current price fluctuations as either long-lasting trends or transient emotional responses. The indicator allows a trader to keep sight during turbulent market conditions by highlighting daily changes that occur on the chart.
Key Features and Visual Implementation
The simplicity and functionality of the Daily Change Indicator are well above average, and the data it gives you is necessary without the cluttered analysis of your chart. The indicator presents percentage changes per day in an easy-to-understand colour-coded format: red for decreasing change, and green for increasing change, which creates instant visual clarity regarding the direction of the market.
Strategic Chart Positioning
The flexible positioning system is one of the highlight characteristics of this indicator. With no options, the daily change value is displayed in the upper right of your chart, placed where it causes minimal interference with the price action analysis. Nevertheless, it is important to note that traders may have a variety of chart layouts and preferences, which is why the indicator allows having four positioning options.
You can position the display anywhere on your chart - top left, top right, bottom left, or bottom right - so as to integrate best with the current chart setup. This flexibility is especially useful to traders with more than one monitor or with chart settings in which the default position may conflict with other analysis tools or indicators.
Different trading styles and information hierarchies are also supported by the positioning feature. Scalpers who require immediate access to daily change information may desire top-corner positioning so they can immediately see it, whereas swing traders may prefer bottom-corner positioning because they do not want to get distracted when examining price action in detail.
Comprehensive Customisation Options
Realising that effective trading needs customised tools, tailored to individual expectations and trading environments, the Daily Change Indicator offers much in the way of customisation. The font customisation panel lets them have full control of the text appearance, i.e. making adjustments to font type, font size and font style.
The changes in font sizes are especially critical to traders with varying monitor resolutions or sizes. A large monitor may need bigger fonts to be visible, but a smaller monitor may need smaller fonts to avoid eating up chart space. The indicator supports such diverse requirements by having extensive font control options.
Colour customisation tackles the various visual selections as well as platform arrangements embraced by different traders. It is a multi-colour enabled indicator that gives you the choice of a positive or negative change display independently, enabling the maximum visibility with your background colour or platform skin colour. This customisation is very helpful to traders who use dark colour schemes, light colour schemes, or custom colour schemes which may not match the default indicator colour schemes.
Practical Trading Applications
The Daily Change Indicator has many practical applications in different trading strategies and market approaches. Its flexibility enables its use by traders who may trade over a wide range of time scales and market environments, including scalawagging at high frequencies, or trading more long-term positions.
Volatility-Based Trading Strategies
Instant access to daily change information is of great advantage to day traders and volatility-oriented plans. Increased market volatility is created by higher day-to-day percentage changes than historical average changes, which tend to present greater trading opportunities. These volatile periods are usually associated with higher profit potential, but with a higher risk.
The indicator assists traders in easily detecting when the markets are encountering unusual volatility rates. When a stock moves an average of 1- 2% per day, and then starts to change 5%, it indicates that something has just happened - maybe earnings news or an analyst upgrade or institutional buying or selling. Such cases can normally give good trading chances to the traders who are ready.
Based on this information, volatility traders make changes in the position size, stop-loss and profit targets. Extrawider stops and bigger profit goals tend to be more suitable during turbulent times (as indicated by large daily movements). On the other hand, with low volatility and few fluctuations per day, the management parameters are usually tighter.
Market Sentiment Analysis
The changes in prices at a daily level give outstanding information about the current mood of the market and the activities of institutions. Unexpectedly positive changes in the daily data would be a good indication of accumulation by the larger participants, and unexpectedly negative changes could be a signal of distribution or shift of negativity.
These sentiment trends are instantly apparent via the Daily Change Indicator and can assist traders in aligning their interests with prevailing market trends. Whenever the changes observed in the market per day keep surpassing the norms, it is a likely sign that institutional investors or traders are at work in the market.
This sentiment analysis is especially useful when there is an earnings period, an economic announcement, or a major news event. The signal enables use by traders to easily determine whether market responses are transient emotional reactions or long-term changes in sentiment that could persist across more than one trading period.
Entry and Exit Timing Enhancement
Timing is everything; this is the difference between winning and losing traders. The Daily Change Indicator improves timing decisions by giving instant information about the current price movement compared to the overall movement of the day.
Under entry timing, traders may wait until daily changes hit specific levels and start positions. By way of illustration, a trader may wait until the changes are above 2% on a daily basis to enter into a momentum trade, or may want to wait until the changes are minimal on a daily basis to enter into a momentum trade.
The same case applies to exit timing benefits, which also use daily change analysis. When a position indicates significant profits and daily fluctuations start to smooth out, this could indicate that the momentum is weakening and profit-taking is justified. On the other hand, when positive changes happen every day, and they are in a profitable direction, there may be a reason to hold the positions longer to increase profits.
Performance Optimisation and Best Practices
The best way to maximise the performance of the Daily Change Indicator is to know best practices in its implementation and pitfalls to avoid. These best practices guarantee the reliability of performance and the delivery of information under all trading conditions.
Chart Setup and Integration
An ideal chart design would be to place the Daily Change Indicator in such a way that the utility of it is maximised with no interference with other analysis tools. Take into account your main analysis tools and select a positioning that would not oppose your current situation.
In bottom-corner positioning, price analysis may proceed without being interrupted by price areas, so the price analysis of candlestick traders, whose focus is on price levels, may be most effective when bottom-corner positions are used. Top-corner positioning may be more visible to traders who use more than one indicator in the upper part of their charts.
A combination with other indicators should be considered in terms of the information layer and graphics. The Daily Change Indicator must be used with other tools and must not introduce information overload that could compromise decision-making in the rapidly changing market environment.
Customisation for Different Trading Styles
Distinct trading approaches favour distinct customisation approaches. Scalpers who require immediate access to information may want large fonts and high contrast colours to ensure maximum visibility. Swing traders may also like less flashy displays that convey information without distractions when it comes to longer-term analysis.
When customising the indicator, consider your environment in the normal operations of your trade. Multiple monitor systems may need different font sizes than single monitor systems. Bright environments may need a different colour scheme than darker environments when trading.
Frequently checking and updating customisation settings will keep the indicator satisfying your changing needs as your trading style and environment evolve with time.
Troubleshooting and Maintenance
Knowledge of general problems and how they can be resolved can contribute to consistent Daily Change Indicator performance. The majority of problems are associated with display errors, calculation errors, or compatibility with other indicators or platform configurations.
Display and Visual Issues
Should the display indicator be difficult to read as a result of making platform skin alterations or modifying the monitors, reconsider the font and colour customisation options. Various themes on platforms may need colour changes to ensure they are most visible.
The size of the chart or monitor could influence whether the fonts use the correct font size, and hence they have to be adjusted after some time to ensure the right font size is used. Display settings should be revised regularly in order to remain effective even when trading in varied settings.
Periodic reconsideration and modification of visual settings are important to ensure consistent performance due to occasional updates in indicator displays.
Calculation Accuracy Verification
The methodology used to calculate the indicator places the measure in a strong position, but periodic verification of the indicator guarantees its continued relevance among various instruments and market environments. Periodically compare the readings of the indicators with hand calculations to check their correct operation.
Calculation timing may also be influenced by different data feeds or market sessions, especially market openings and market closings. Knowing these possible variations will inspire confidence in the accuracy of the indicator.
Market holidays or reduced days of trade may hamper daily change calculations; it is prudent to be aware of these special conditions to ensure that indicator readings are properly interpreted.

Shariful Hoque
SEO Content Writer
Shariful Hoque is an experienced content writer with a knack for creating SEO-friendly blogs, marketing copies and scripts.
Related Posts
Best Volume Indicators that Every Trader Should Know
Unlock the secret behind market moves – explore the best volume indicators every trader must know for smarter, stronger trades
.webp&w=2048&q=75)
How to See Market Trend in NinjaTrader 8: A Simple Guide
Discover how to analyze market trends in NinjaTrader 8 with this simple guide. Learn to use trend indicators and improve your trading strategies.

Best Free NinjaTrader Indicators That You Should Always Keep
Discover the best free NinjaTrader indicators that can enhance your trading strategies. Improve and automate your trades with these essential tools.