Mega Sale 50% OFF All Products & Memberships | Limited time onlyUse code RCSALE50ALL
Our Zone Drawing Indicator will help traders or investors who rely on Support/Resistance, Supply/Demand, or other market zones. Considered as one of the best free NinjaTrader 8 indicators, this tool shows higher time frame zones on lower time frame charts, giving you a comprehensive view of the market at a glance. Take control of your trading decisions. Get it for FREE now!
The Zone Drawing - Free Indicator is a professional-grade free indicator for NinjaTrader 8 platform. This indicator helps traders with technical analysis and market insights. Download now for free and enhance your trading strategy with this powerful tool from Rize Capital.
Click to play video
INDICATOR
Please Register for FREE account or Login to download this resource.
By downloading, you agree with our Terms & Conditions
Our Zone Drawing Indicator will help traders or investors who rely on Support/Resistance, Supply/Demand, or other market zones. Considered as one of the best free NinjaTrader 8 indicators, this tool shows higher time frame zones on lower time frame charts, giving you a comprehensive view of the market at a glance. Take control of your trading decisions. Get it for FREE now!
See how the Zone Drawing - Free Indicator looks in action with these screenshots
Enhance your trading experience with premium features
Use the Zone Drawing indicator by Rize Capital without any restriction by subscribing to its additional features here.
Learn how to use the Zone Drawing - Free Indicator to improve your trading
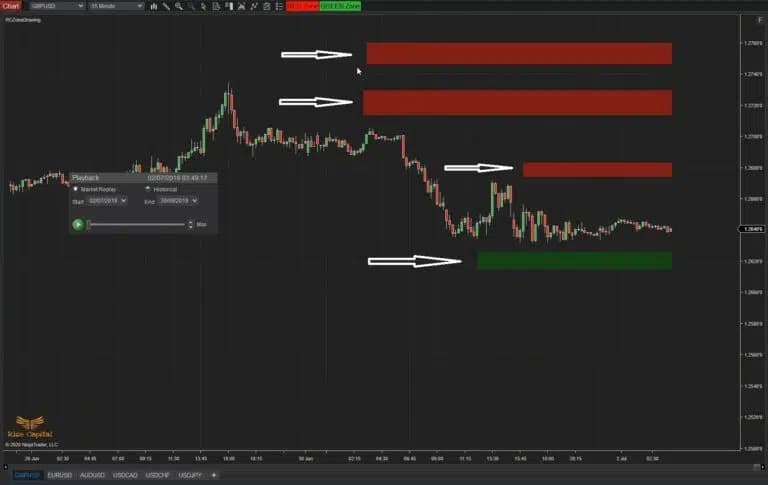
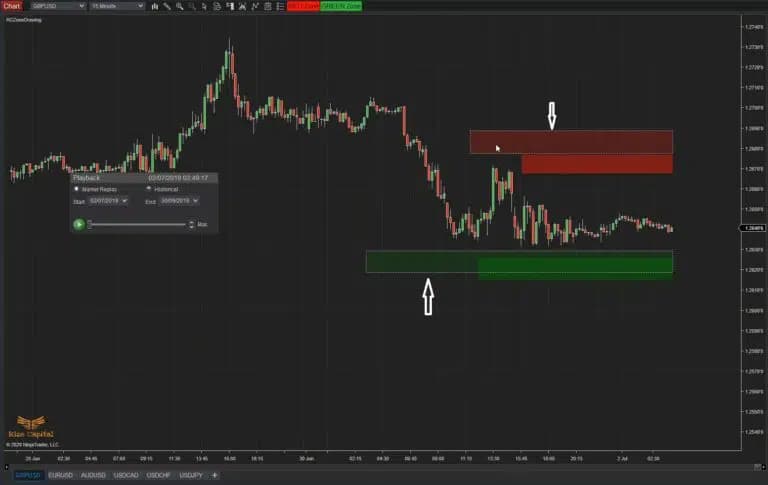
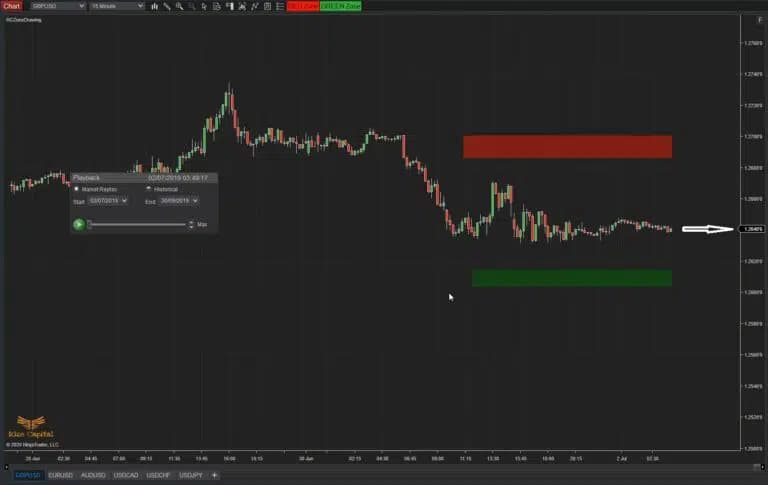
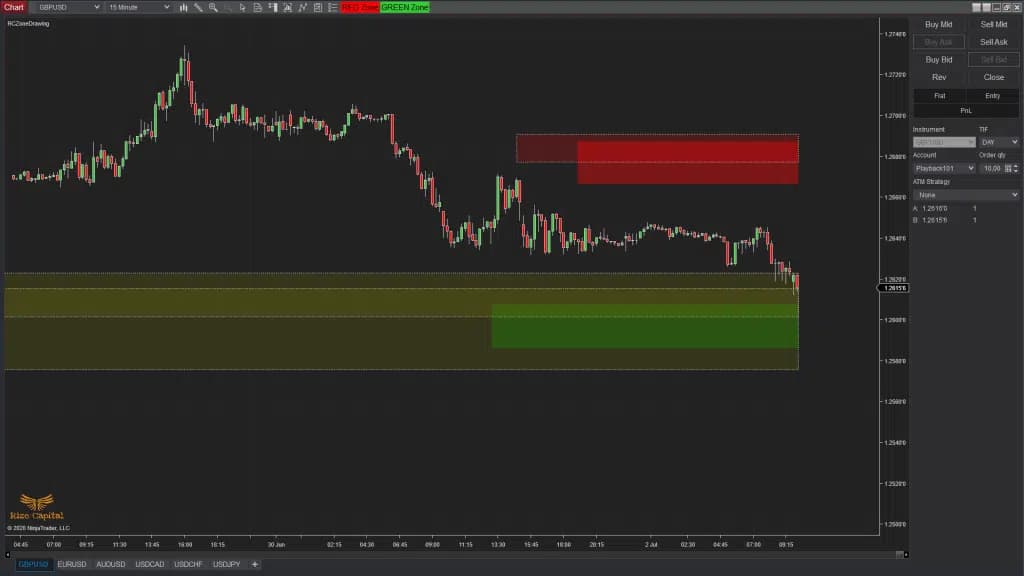
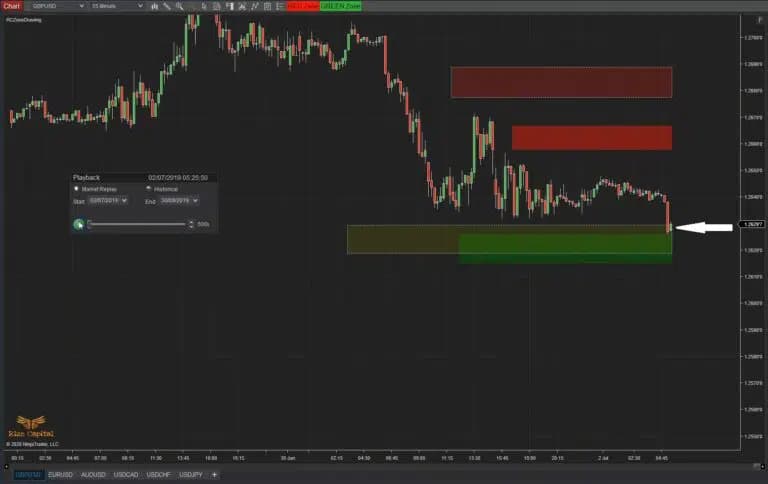
In Image 2, you can see that you can draw Green and Red zones. However, you need to remember to draw Green Zones below the current market price and Red Zones above the current market price. You can draw multiple zones on the same chart (Image 3). Zones drawn on higher TF charts can be seen with a dotted border line around them when you are on a lower TF chart (Marked with white arrows in Image 4). Your current TF zones will be solid colour by default without any border. Higher TF zones are visible on lower TF charts, but lower TF zones are not visible on higher TFs. When the current market price only touches a zone for the first time, regardless of whether it is Green or Red, it changes its colour (marked with a left white arrow in Image 5) to highlight that the zone has already been touched or used. However, it does not change colour again if it touches the same zone subsequently.
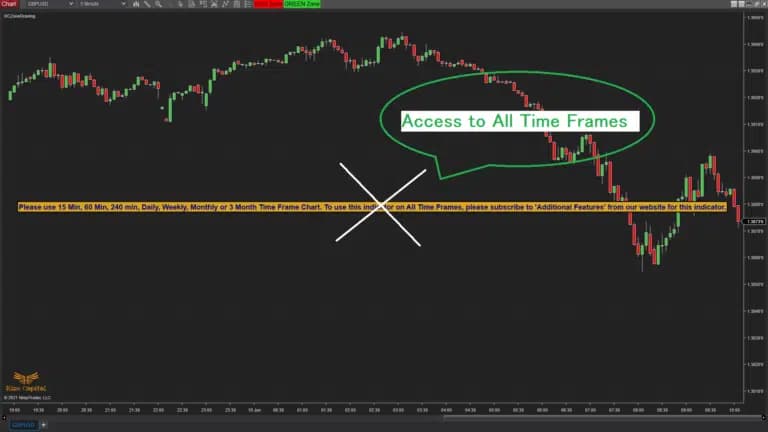
To remove the restriction on the use of this indicator to a limited number of timeframes, you simply need to subscribe to ‘Additional Features’ from the ‘Additional Feature Subscription’ section.
The Zone Drawing - Free Indicator is a professional-grade free NinjaTrader indicator designed to enhance your trading analysis and decision-making process. This powerful tool provides traders with advanced market insights and technical analysis capabilities, helping you identify potential trading opportunities with greater precision and confidence.
Installing and using the Zone Drawing - Free Indicator is straightforward. After downloading, simply import the indicator into your NinjaTrader 8 platform and apply it to your charts. The indicator works across all timeframes and market instruments, making it versatile for various trading strategies including day trading, swing trading, and scalping.
Rize Capital has been developing professional trading tools for NinjaTrader since 2018. Our indicators are used by thousands of traders worldwide and are known for their accuracy, reliability, and ease of use. All our free indicators come with comprehensive documentation and support.
Yes, the Zone Drawing - Free Indicator is completely free to download and use. You only need to create a free account with Rize Capital to access the download.
This indicator is specifically designed for NinjaTrader 8. For NinjaTrader 7 compatibility, please contact our support team.
Absolutely! This indicator is designed for both demo and live trading environments. However, we recommend testing thoroughly on a demo account first.
Yes, we provide basic support for all our free indicators through our community forum and documentation resources.
See how the Zone Drawing - Free Indicator has evolved over time

