Rize Capital Logo
Home
Free IndicatorFree Resources
IndicatorStrategyTutorial with Source Code
Ninjascript Programming TrainingCustom Programming
Rize Capital Logo
Rize Capital Logo
Home
Ninjascript Programming TrainingCustom Programming
Sign inCreate account

Registered address

Registered in England and Wales.
Registration # 12039916
53 Rodney Crescent, Filton,
Bristol BS34 7AF
United Kingdom

PayPal Secured

Information

  • Home
  • About Us
  • Support
  • Membership
  • Partner Program
  • Blog
  • Feedback Submission
  • Contact us
  • Terms & Conditions
  • Privacy Policy
  • Return & Refund Policy
  • Disclaimer
  • Cookies
  • Sitemap

Follow us

X
Facebook
Youtube
Instagram
LinkedIn

Resources

ninjatrader affiliateRize Capital Datafeed

Risk Disclosure: An investor could potentially lose all or more than the initial investment. Risk capital is money that can be lost without jeopardizing ones' financial security or life style. Only risk capital should be used for trading and only those with sufficient risk capital should consider trading. Past performance is not necessarily indicative of future results.

Hypothetical Performance Disclosure: Hypothetical performance results have many inherent limitations, some of which are described below. No representation is being made that any account will or is likely to achieve profits or losses similar to those shown; in fact, there are frequently sharp differences between hypothetical performance results and the actual results subsequently achieved by any particular trading program. One of the limitations of hypothetical performance results is that they are generally prepared with the benefit of hindsight. In addition, hypothetical trading does not involve financial risk, and no hypothetical trading record can completely account for the impact of financial risk of actual trading. for example, the ability to withstand losses or to adhere to a particular trading program in spite of trading losses are material points which can also adversely affect actual trading results. There are numerous other factors related to the markets in general or to the implementation of any specific trading program which cannot be fully accounted for in the preparation of hypothetical performance results and all which can adversely affect trading results.

Testimonials: Testimonials appearing on this website may not be representative of other clients or customers and is not a guarantee of future performance or success.

Live Trade Room: This presentation is for educational purposes only and the opinions expressed are those of the presenter only. All trades presented should be considered hypothetical and should not be expected to be replicated in a live trading account.

Additional Disclosure: Rize Capital Ltd, also known as rizecap.com assumes no responsibility for your investment and trading results. Past performance does not guarantee future performance and Rize capital Ltd does not make any performance representations or guarantees. Any chart or trading demonstration produced by Rize capital Ltd representing trades and using any methods of indicators or strategies on rizecap.com website or in any advertisement, seminar, brochure, magazine or online demonstrations are to be considered hypothetical trades and investments for educational purposes only. No trading system can guarantee profits or loss. Hypothetical trading results can be unreliable.

© Copyright 2019 - 2025 Rize Capital Ltd

Daily Extremes - Premium Indicator

Click to play video

Daily Extremes - Premium Indicator  Video Thumbnail

Daily Extremes - Premium Indicator

INDICATOR

1st Month Free Trial
£9Excl. VAT/month

Please Register for FREE account or Login to subscribe to this indicator.

Key Features

  • 1st month FREE TRIAL
  • Access to all future updates
  • 24/7 update and technical support
  • Cancel subscription anytime

By subscribing, you agree with our Terms & Conditions

This is one of the best NinjaTrader indicators for day traders, but can also be applied to swing trading strategies. It plots two key lines on your chart, helping you identify where the market top and bottom are most likely to form for the day. When the market reaches the Market Top Line, it is highly likely that it's going to reverse, and the same is true for the Market Floor Line. This indicator continuously calculates and updates these levels in real time, giving you a clear view of the high-probability market top and floor for the day. Who wouldn’t want to know the market top and bottom early in the day? Try it FREE for the first month and see if it meets your expectations!

Gallery

See how the Daily Extremes - Premium Indicator looks in action with these screenshots

01.png
1 / 5
Click to zoom

Indicator Details

Learn how to use the Daily Extremes - Premium Indicator to improve your trading

584words
3min read
2sections
01.png
Click to ZOOM
Image - 01
02.png
Click to ZOOM
Image - 02

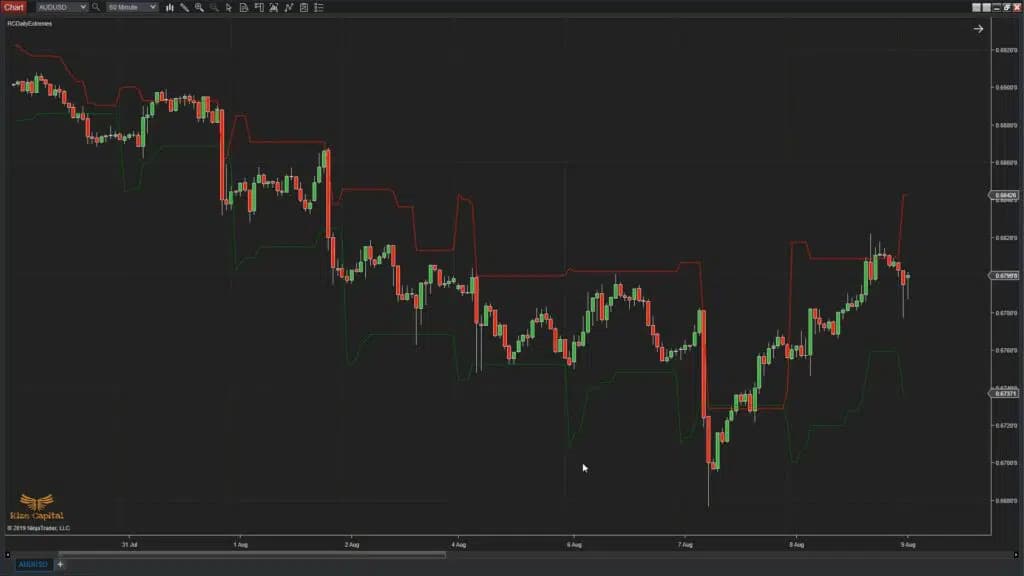
The Daily Extremes is a custom-programmed indicator developed by Rize Capital to be used on the NinjaTrader 8 trading platform. This indicator plots the potential daily top and bottom of the market using live data. When you add this indicator to your chart, it will look similar to Image 1. Now, if you look at Image 2, you will see the potential ‘Market Top’ and ‘Market Floor’ text plotted on the chart, which are marked by red down arrows. It also plots dynamic red and green lines, indicated by white down arrows in Image 2, to show you the historical top and floor of the market. From Image 1 or on your chart, you will notice that sometimes the price goes through the market top and floor lines, which are indications that the market price is likely to reverse. You can use this indicator to manage your risk/reward, or you can use it for entries and exits—which will depend on your trading style or strategy.

This indicator works on any market and any instrument. Please note that this indicator works on an intra-day time frame only, as its purpose is to plot the daily market top and floor.

03.png
Click to ZOOM
Image - 03
04.png
Click to ZOOM
Image - 04
05.png
Click to ZOOM
Image - 05

Now, you can change the period value or the colours of the plotted text from the indicator’s settings, which are marked by a lime green rectangle in Image 3. It is recommended not to change any of the default settings, which are within the red rectangle in Image 4, for the proper functioning of this indicator. Depending on your chart background or for any other purpose, if you decide to change the colours of the market top and floor lines, you can do so from the parameters marked with a white rectangle in Image – 5.

However, if you still have any further queries, please watch the video tutorial above to understand how this indicator and its settings work.

Version History

See how the Daily Extremes - Premium Indicator has evolved over time

  • Version 5.2.0.1

    • This can be used on any instrument.
    • Script optimised.
    • Indicator folder location updated.
    • Auto update and announcement added.