Rize Capital Logo
Home
Free IndicatorFree Resources
IndicatorStrategyTutorial with Source Code
Ninjascript Programming TrainingCustom Programming
Rize Capital Logo
Rize Capital Logo
Home
Ninjascript Programming TrainingCustom Programming
Sign inCreate account

Registered address

Registered in England and Wales.
Registration # 12039916
53 Rodney Crescent, Filton,
Bristol BS34 7AF
United Kingdom

PayPal Secured

Information

  • Home
  • About Us
  • Support
  • Membership
  • Partner Program
  • Blog
  • Feedback Submission
  • Contact us
  • Terms & Conditions
  • Privacy Policy
  • Return & Refund Policy
  • Disclaimer
  • Cookies
  • Sitemap

Follow us

X
Facebook
Youtube
Instagram
LinkedIn

Resources

ninjatrader affiliateRize Capital Datafeed

Risk Disclosure: An investor could potentially lose all or more than the initial investment. Risk capital is money that can be lost without jeopardizing ones' financial security or life style. Only risk capital should be used for trading and only those with sufficient risk capital should consider trading. Past performance is not necessarily indicative of future results.

Hypothetical Performance Disclosure: Hypothetical performance results have many inherent limitations, some of which are described below. No representation is being made that any account will or is likely to achieve profits or losses similar to those shown; in fact, there are frequently sharp differences between hypothetical performance results and the actual results subsequently achieved by any particular trading program. One of the limitations of hypothetical performance results is that they are generally prepared with the benefit of hindsight. In addition, hypothetical trading does not involve financial risk, and no hypothetical trading record can completely account for the impact of financial risk of actual trading. for example, the ability to withstand losses or to adhere to a particular trading program in spite of trading losses are material points which can also adversely affect actual trading results. There are numerous other factors related to the markets in general or to the implementation of any specific trading program which cannot be fully accounted for in the preparation of hypothetical performance results and all which can adversely affect trading results.

Testimonials: Testimonials appearing on this website may not be representative of other clients or customers and is not a guarantee of future performance or success.

Live Trade Room: This presentation is for educational purposes only and the opinions expressed are those of the presenter only. All trades presented should be considered hypothetical and should not be expected to be replicated in a live trading account.

Additional Disclosure: Rize Capital Ltd, also known as rizecap.com assumes no responsibility for your investment and trading results. Past performance does not guarantee future performance and Rize capital Ltd does not make any performance representations or guarantees. Any chart or trading demonstration produced by Rize capital Ltd representing trades and using any methods of indicators or strategies on rizecap.com website or in any advertisement, seminar, brochure, magazine or online demonstrations are to be considered hypothetical trades and investments for educational purposes only. No trading system can guarantee profits or loss. Hypothetical trading results can be unreliable.

© Copyright 2019 - 2025 Rize Capital Ltd

Institutional Entry Exit - Premium Indicator

Click to play video

Institutional Entry Exit - Premium Indicator Video Thumbnail

Institutional Entry Exit - Premium Indicator

INDICATOR

1st Month Free Trial
£9Excl. VAT/month

Please Register for FREE account or Login to subscribe to this indicator.

Key Features

  • 1st month FREE TRIAL
  • Access to all future updates
  • 24/7 update and technical support
  • Cancel subscription anytime

By subscribing, you agree with our Terms & Conditions

This pro-level premium indicator is highly useful as it shows you on the chart when a probable institutional-level trade has taken place. It plots a marker on the chart to show you the move so that you can follow the big institutional-level traders in the market and make decisions accordingly for your entry and exit of the market position. As you know, only institutional-level trades have the power to move the market. If your strategy is to follow their moves, this indicator can be an invaluable tool for you. Still unsure? Watch the video tutorial and try it FREE for the first month to see its effectiveness in action on your charts!

Gallery

See how the Institutional Entry Exit - Premium Indicator looks in action with these screenshots

gj6zqjp9ir6ui7d8e0oou2tb-01.png
1 / 4
Click to zoom

Indicator Details

Learn how to use the Institutional Entry Exit - Premium Indicator to improve your trading

524words
3min read
2sections

Institutional Trading Indicator Details

gj6zqjp9ir6ui7d8e0oou2tb-01.png
Click to ZOOM
Image - 1

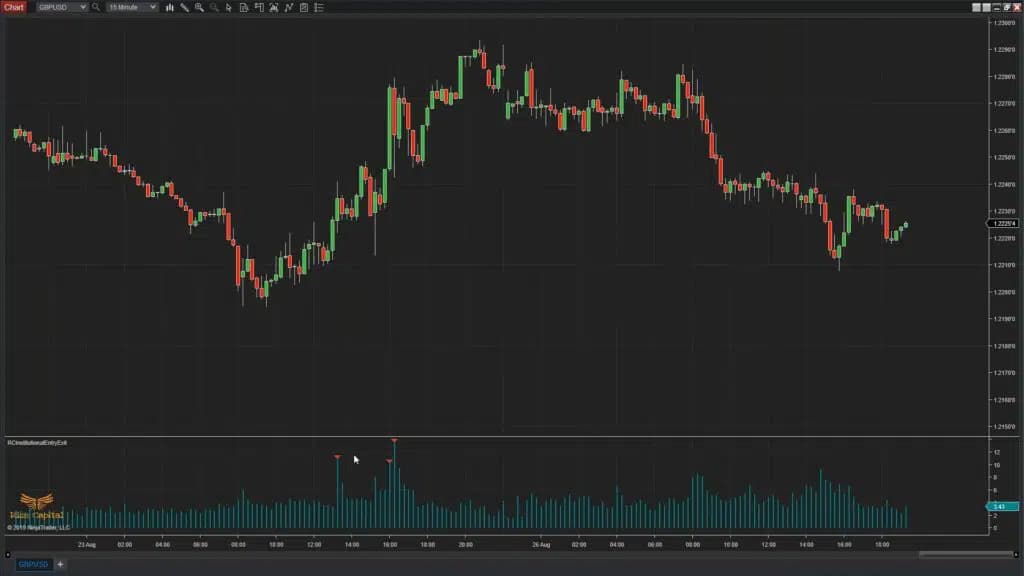
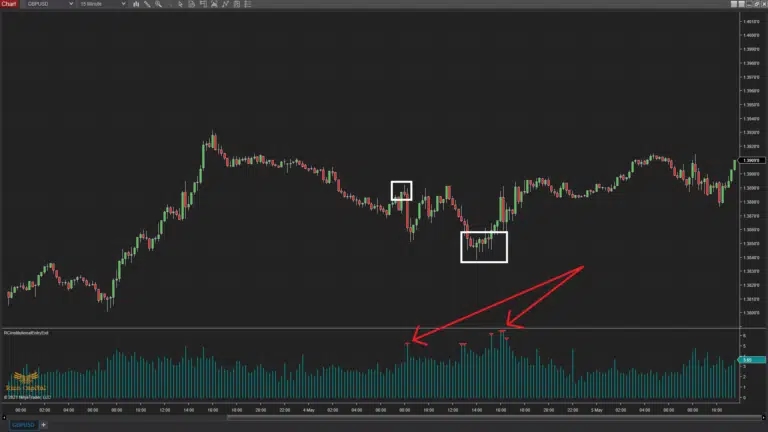
The Institutional Entry Exit Indicator is custom developed by Rize Capital to be used on the NinjaTrader 8 platform. The sole purpose of this indicator is to generate signals with plots to let the user know where institutions might have entered, exited, or added significantly to existing trading positions. This indicator requires Order Flow+ tools, i.e., you will need a NinjaTrader 8 Lifetime licence. If you don’t have it, you will need to contact NinjaTrader directly for more information on NinjaTrader 8 platform licensing. After adding this indicator to your chart, if you see triangles plotted on top of bars, as shown with red arrows in Image 1, it means it is highly likely that big players have entered, exited, or added a large volume to an existing position. To confirm this, if you look at the price actions above on the chart, where white rectangles are drawn, you will see that the market price movement changed direction as soon as the triangles were plotted on the bars in the indicator panel. You can take advantage of these opportunities to gain a competitive edge over others. This indicator can be used on any market and any instrument. You also need to ensure that you have historical tick data for your instrument on the chart from your broker or data provider; otherwise, your historical plots may show gaps.

asojdaac5a6hz2a7mwxd2vrd-02.png
Click to ZOOM
Image - 2
waih5l9jibxk4cjikgp5r4u6-03.png
Click to ZOOM
Image - 3
smal5gzuhbf8ayje2fm9wdo7-04.png
Click to ZOOM
Image - 4

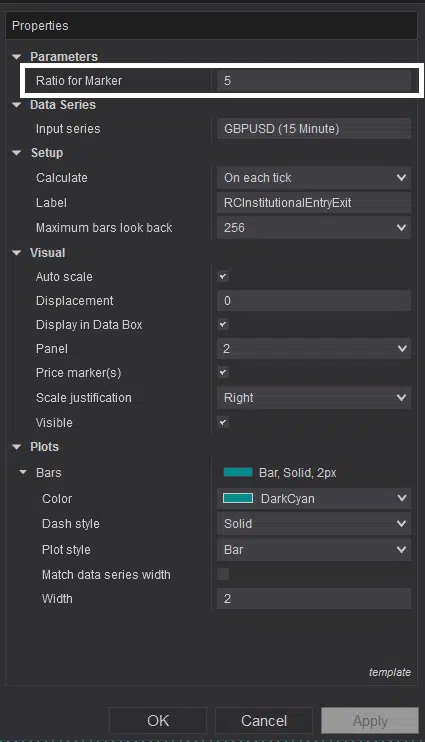
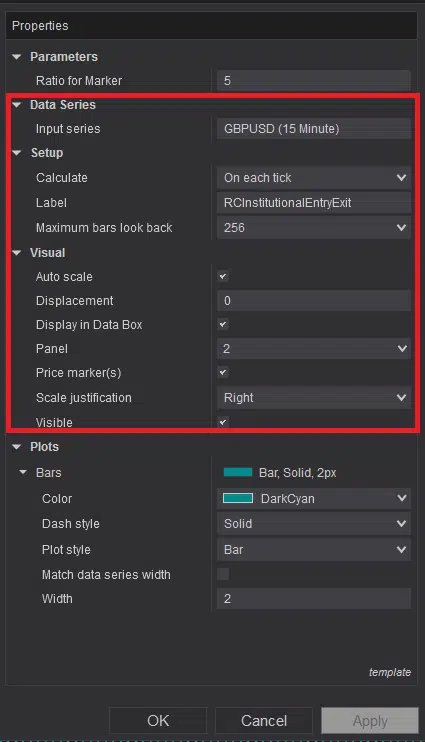
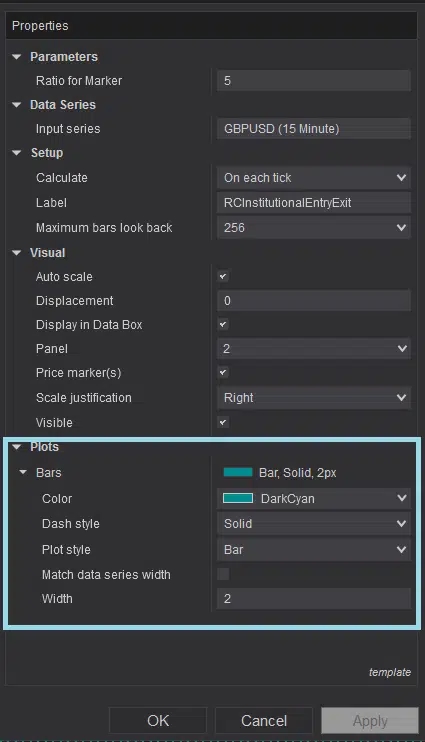
Now, different timeframes may require different ratio parameter values for the triangles to be plotted effectively, and the same applies to different instruments. You can use different ratio values from the parameter marked with a white rectangle in Image 2 and find the best value for you, as different instruments and different timeframes of the same instrument behave differently. It is highly recommended not to change any of the default settings within the red rectangle shown in Image 3 for the accurate functioning of this indicator. If you would like to change the volume bar plots’ colour or style, you can do so from the options marked with a light blue rectangle shown in Image 4. However, if you still have any further queries regarding this indicator or its settings, please watch the video tutorial above to get more information.

Version History

See how the Institutional Entry Exit - Premium Indicator has evolved over time

  • Version 5.2.0.1

    • This can be used on any instrument.
    • Indicator folder location updated.
    • Script optimised.
    • Auto update and announcement added.