Click to play video
INDICATOR
Please Register for FREE account or Login to subscribe to this indicator.
By subscribing, you agree with our Terms & Conditions
This is the best indicator for entry and exit, which can only be used on Point and Figure charts. It will plot the best possible Buy and Sell signals, but you need to choose which one to take yourself. It shows the trend line at the same time. If you're a PnF chart user, this is an essential auto trend line indicator for your trading strategy. If you have been in the financial market for a good number of years, you definitely know how effective this indicator will be. Why not watch our video tutorial for this indicator and see for yourself?
See how the Point & Figure Entry Exit - Premium Indicator looks in action with these screenshots
Learn how to use the Point & Figure Entry Exit - Premium Indicator to improve your trading
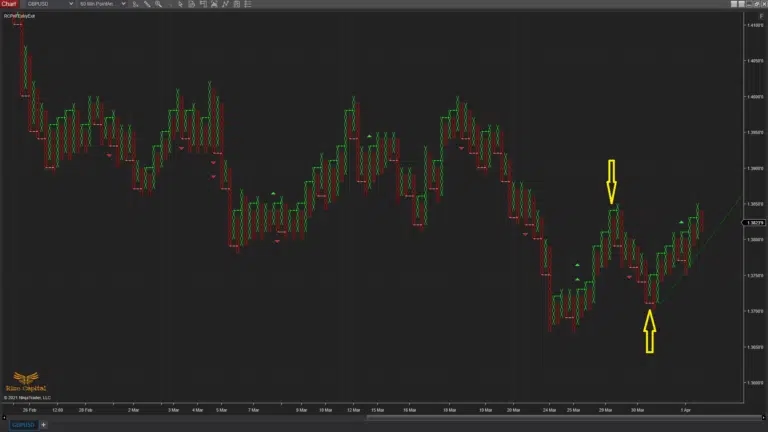
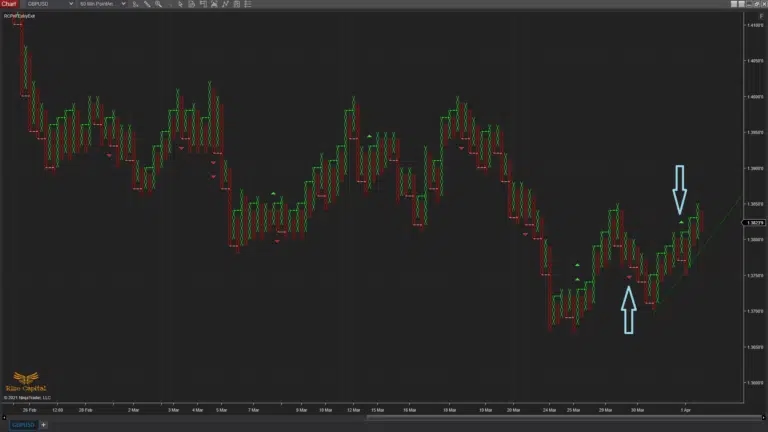
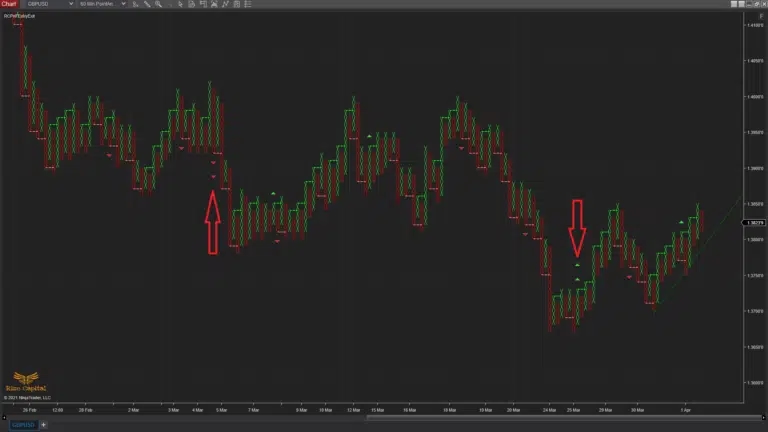
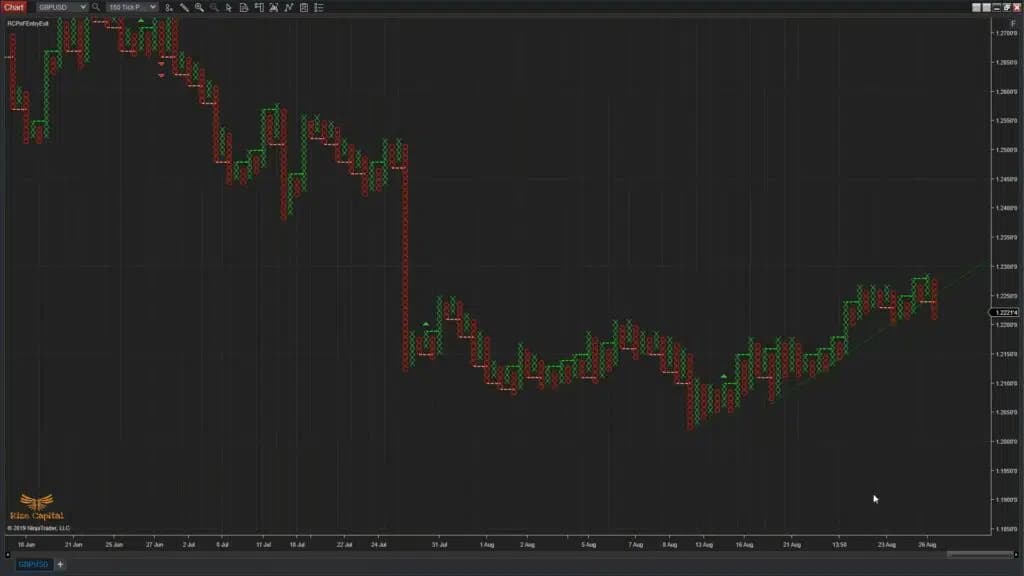
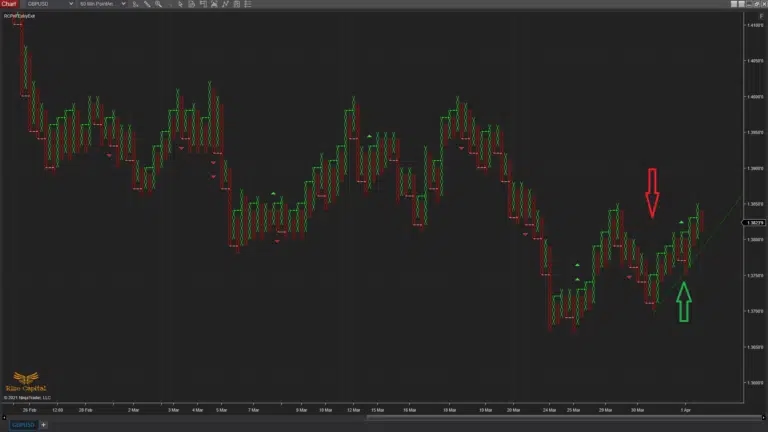
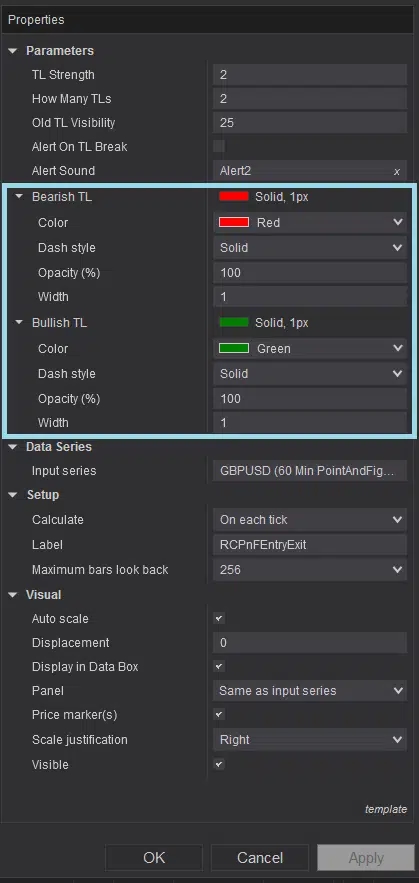
The Point & Figure Entry Exit custom indicator for the NinjaTrader 8 platform, developed by Rize Capital, is designed for professional traders who rely on Point & Figure (P&F) charts for their trading strategies. P&F charts are primarily used by experienced traders with a strong understanding of this specialised charting method. By applying this indicator to your P&F chart, trading decisions become significantly simpler due to trading signals. The indicator plots Up and Downtrend lines (highlighted by green and red arrows in Image 1) to clarify the market’s current direction. Additionally, it generates entry signals (marked by yellow arrows in Image 2), with green lines indicating buys and red lines indicating sells. For traders focusing exclusively on double top buy and sell signals, the indicator automatically plots them on the chart (shown as light blue arrows in Image 3). Double top buy and sell signals are plotted by a single triangle—green for buys and red for sells. Those seeking higher-probability triple top buy and sell signals can utilise the double-triangle markers (highlighted by red arrows in Image 4), where double green triangles signal buy and double red triangles signal sell. This indicator is compatible with all markets and instruments but requires a P&F chart type to function. If applied to other chart types,a reminder message will prompt you to adjust the settings. To customise the display, users can modify trend line colours and styles via the indicator settings (highlighted by the light blue rectangle in Image 7). For instance, trend lines can be hidden by selecting a transparent colour, or their appearance can be tailored to suit individual preferences.
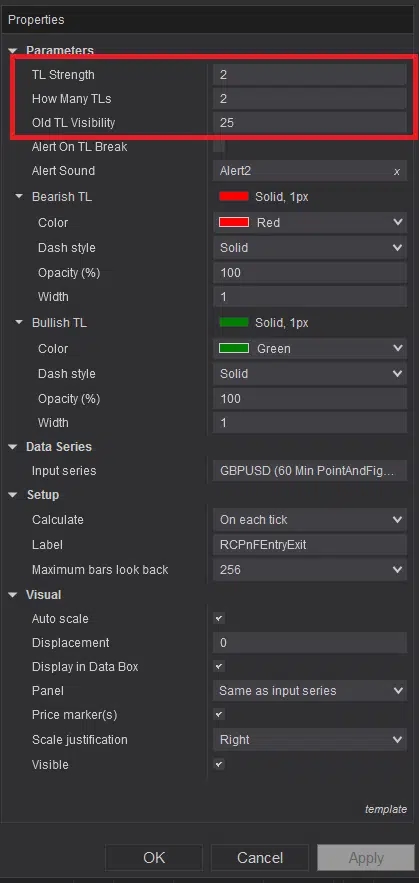
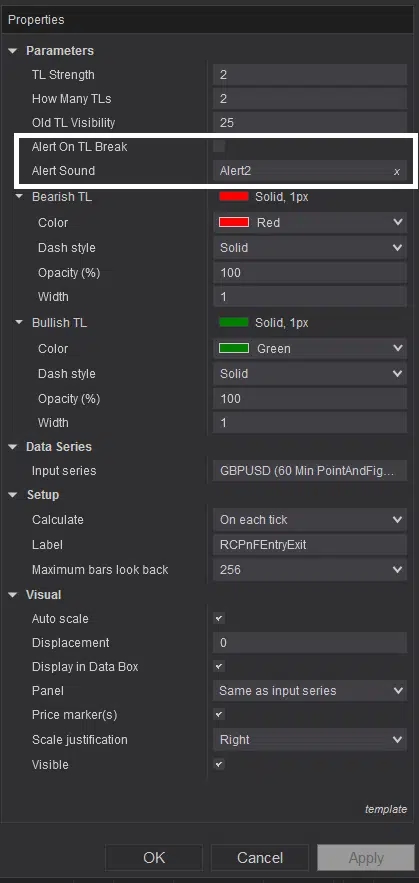
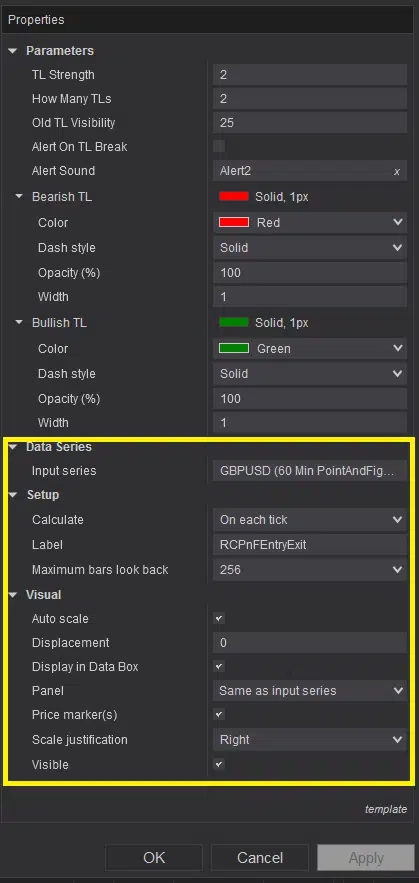
As shown in Image 5, you can set up your own trend line strength and select the number of trend lines to plot using the settings options marked by the red rectangle. The indicator also allows you to control the visibility of previous trend lines by adjusting a numerical value. Additionally, to activate alerts when a trend line is broken and assign a notification sound, configure the options marked by the white rectangle in Image 6. If you wish to enable alerts, simply check the box; leave it unchecked otherwise. The settings option marked by the yellow rectangle in Image 8 represents the default configuration. It is recommended not to alter these settings toensure the indicator functions accurately. For further queries or clarifications, please watch the video tutorial above.
See how the Point & Figure Entry Exit - Premium Indicator has evolved over time

