Click to play video
INDICATOR
Please Register for FREE account or Login to subscribe to this indicator.
By subscribing, you agree with our Terms & Conditions
If you are looking for premium NinjaTrader 8 swing trading, position trading, or day trading indicators, then this indicator can give you an edge on the market. The Price Level Volume Insights indicator was developed for use with NinjaTrader 8, and the best part is that you can now access these insights with any type of NinjaTrader 8 license. This is one of the best NinjaTrader indicators, and they are also rare because they give you an edge over many other traders and investors in the market. While some providers offer something close to it, they charge users lots of money, which even makes it difficult for some professional traders and nearly impossible for retail traders to use this kind of information for trading. However, we have developed it from scratch and can provide you with a subscription for such a low fee. Watch the video tutorial, and you’ll see just how beneficial this tool can be for your trading. Watch the video to see how it works.
See how the Price Level Volume Insights - Premium Indicator looks in action with these screenshots
.png&w=2048&q=100)
Learn how to use the Price Level Volume Insights - Premium Indicator to improve your trading
.png&w=2048&q=100)
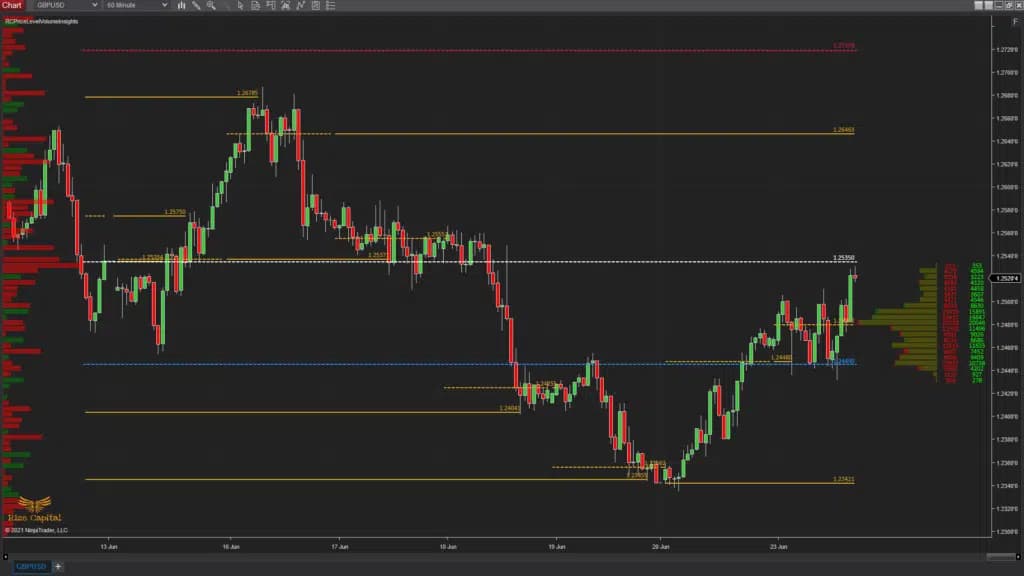
This indicator plots lots of volume-related information and insights at the price level for each tick. It does plot on historical data and market replay for you to backtest. Also this indicator can be used for any financial instruments. Now, it has 3 main parts, which are the left side Volume profile, daily session Point of Control (POCs), and right side Volume profile. All these work independently, i.e., the settings of one do not affect the other. With the right margin volume profile, you can plot the buy and sell volume at the tick level for any number of days at any user-defined tick level. Traditional volume profiles do not plot buy and sell volumes separately on top of each other; thus, you have no clue which side is stronger than the other. But this indicator plots the buy and sell volumes separately and on top of each other so that you know which side is stronger at that price level.
It plots daily session extended POCs so that you know which prices this instrument accepted as fair in the past, and in most cases, these areas are considered good for rebounds. On the left side, which is shown with red arrows in both Images 1 and 2, is the left margin volume profile. The main difference from the right margin volume profile is that it offers options to plot either Delta or Buy/Sell Volume. And you can also select the number of days for the volume profile, and the tick size for each bar for this volume profile, and all these are independent of the right margin volume profile.
If you want to keep an eye on a longer-term volume profile on the left margin while plotting the historical and live daily session extended POCs on the chart and a volume profile to execute on the market on the right margin, this is the perfect indicator for you.
.png&w=2048&q=100)
.png&w=2048&q=100)
Now, the right margin volume profile shows both buy and sell volume separately on top of each other. If you look closely at Image 3, where a red down arrow shows how it is plotted. Unlike traditional volume profiles, this plot shows you who is actually controlling the market at that level, whether there are more buyers or sellers at that price level, and that is a huge edge for anyone. Now, if you look at Image 4, where a red down arrow is plotted, you will be able to see the buy and sell value in real time alongside the volume profile at price levels. That will give you more information if you need the actual data values of the bars. The right column shows Buy or Uptick volumes, and the left column shows Sell or Downtick volumes, depending on the type of instrument you are using.
.png&w=2048&q=100)
.png&w=2048&q=100)
.png&w=2048&q=100)
In Image -5, you can see that the Left margin volume profile plots the Value Area High (VAH), Value Area Low (VAL), and POC for it. It is very useful to keep an eye on the long-term market value area and POC. Now, in Image – 6, you can see the daily sessions’ extended POCs are plotted; however, the most important aspect of using them is that when the price touches these, the indicator stops plotting. The reason behind this is that if the previous POC is traded, it is unlikely that the price will stop there; rather, it may go up or down to the next extended POC lines. The use of historical extended POCs is very useful for seeing potential price rebounds from those levels. All these POCs, VAH, and VALs also plot price labels so that you don’t have to spend time figuring them out, as shown with arrows in Image -7.
.png&w=2048&q=100)
.png&w=2048&q=100)
.png&w=2048&q=100)
Now, if you look at the indicator settings, you will see at the top “Calculation Type”, and you will have options to select “BidAsk” and “UpDownTick” (Image – 8, marked with a red arrow and a red rectangle). This will depend on the instrument you are trading. Use BidAsk if your instrument has real volumes, but if you are trading instruments like forex, which do not have real volume fed through, you need to use UpDownTick.
Now, you can customise the settings and plots for the Right Margin Volume profile from the section highlighted by the red rectangle in Image -9. The level increment is for the height of the volume profile bars. If you want your bars to plot for each tick level, then input 1; otherwise, if you want your VP bars to have a height corresponding to any other tick size, you can input that. You need to input the number of days’ VP you want to plot on your right margin VP in the field where it says “Number of Days”. But it's important to remember that all these are for only the right margin VP; it does not affect any other plots of this indicator. The histogram width, by default, is kept at 150, which is the margin after the current live bar so that the chart bars do not overlap the VP, but if you want, you can change it as per your requirement. The value column width is the space left at the right margin to plot buy and sell volume values, which are shown in Image -4. If you want to change the width, you can customise it. Now, the rest of the settings in that section are for customising the colours and font. You can change them as per your requirements.
Image 10 shows the section for customising daily sessions’ plots. You can change the colour of the POCs and fonts in this section depending on your choice. Also, if you don’t like to plot the POCs or the price labels on them, you can switch them off by unchecking those options. By default, it plots them.
.png&w=2048&q=100)
.png&w=2048&q=100)
.png&w=2048&q=100)
In Image – 11, you can see the option to select between BuySellVolume and Delta for the left margin Volume Profile. This was explained above with reference to Images -1 and 2. You can select the settings of your choice for the left margin Volume Profile from the section highlighted with a red rectangle in Image – 12. You can choose the level increment from each tick to any tick size you prefer for the height of each bar in your left margin Volume Profile. You can also select the Number of Days from 1 to any desired value to plot. It also has a Histogram Width setting to ensure that it does not cover the entire chart; you can change it if you want to adjust the area it covers on the left margin of the chart. Then, you can customise the colours of the POC, Value Area High, and Value Area Low lines. Now, in the option where it says “Value Are”, that is actually the percentage used to calculate the value area for your left margin Volume Profile. If you don’t want to plot any specific line(s) from the left margin, such as the POC, VAH, or VAL, you can uncheck those options based on your requirements.
Now, in the section highlighted with a red rectangle in Image – 13, it is recommended not to make any changes, as it may cause this indicator to not function correctly.
See how the Price Level Volume Insights - Premium Indicator has evolved over time

