Click to play video
INDICATOR
Please Register for FREE account or Login to subscribe to this indicator.
By subscribing, you agree with our Terms & Conditions
This is one the best day trading indicators using NinjaTrader that plots daily forecasting levels on charts. By using this indicator early in the session, you’ll see forecasted levels that can help you predict market movements for the rest of the day, allowing you to make smarter trading decisions. Additionally, this indicator provides insights into weekly market trends and helps you plan for highly probable stop-hunt levels, market reversal points, and profit targets for the day. Watch the video tutorial before making your decision.
See how the Trading Zones With Extension - Premium Indicator looks in action with these screenshots
Learn how to use the Trading Zones With Extension - Premium Indicator to improve your trading
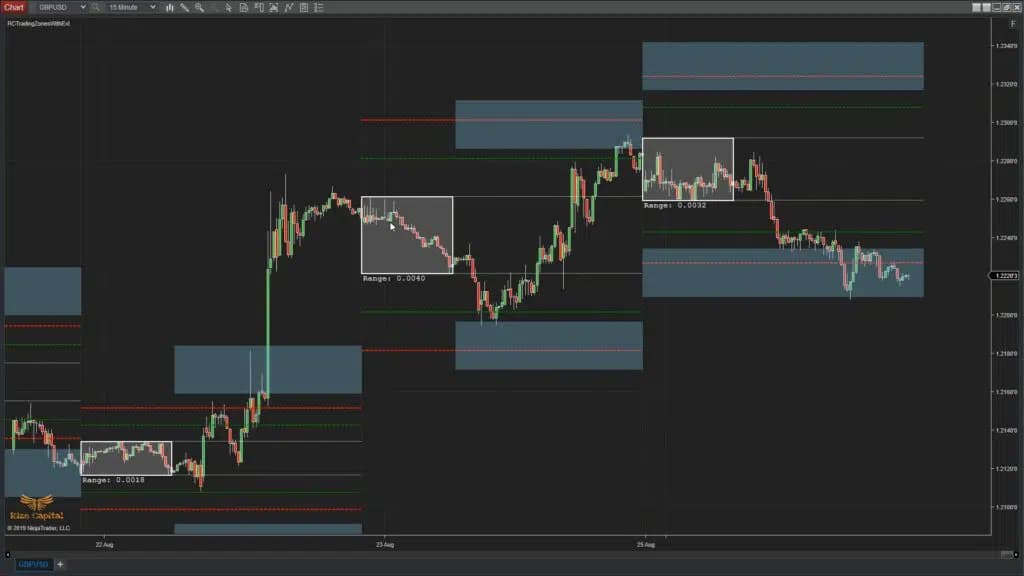
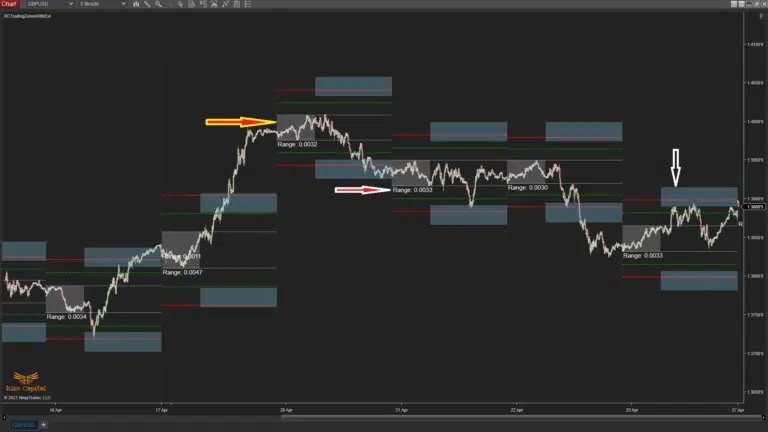
Trading Zones with Extension is a custom programmed indicator to be used on the NinjaTrader 8 platform. This is a leading indicator. It plots the initial balance for the day on the live market (shown with a yellow right arrow with red fill, Image 1). You can choose the start and end time of the initial balance from the settings, as shown in Image 4, marked with a lime green rectangle. At the same time, the extension lines on both sides of the initial balance, which are marked by green and red lines, keep developing. As soon as the initial balance time is up and it stops plotting, it will plot the trading zones on both sides of the initial balance zone, as shown in Image 1, marked with a white down arrow. After the initial balance plots have finished, all these extension lines and trading zone plots remain unchanged. It also plots the initial balance range live (pointed to by a white right arrow with red fill, Image 1).
If you add this indicator to your chart, you will see that the price reacts on the green and red lines (called extension lines), and if the price goes on to the trading zones, it will give you high-probability trading opportunities.
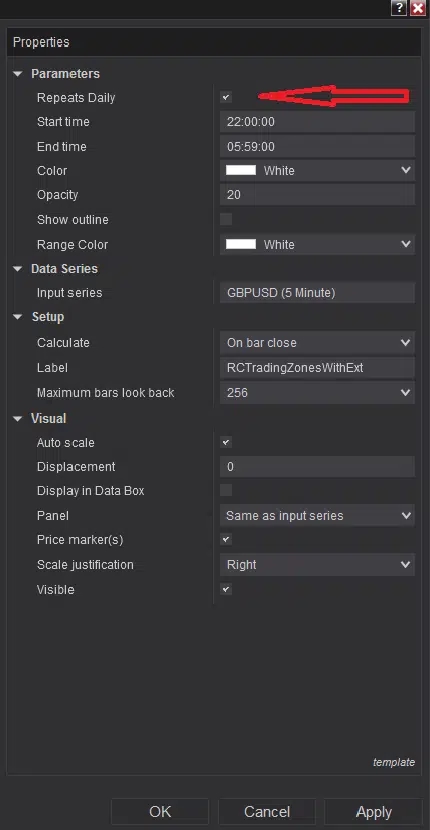
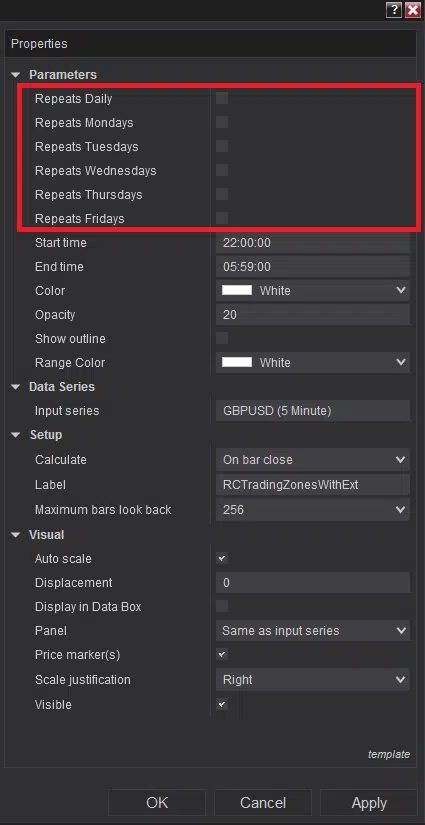
Now, you can choose to plot these zones and lines for every day's data on your chart by checking the ‘Repeats Daily’ checkbox as shown in Image 2, or you can select specific days by checking the checkboxes beside the specific day's name, as shown by the red rectangle in Image 3.
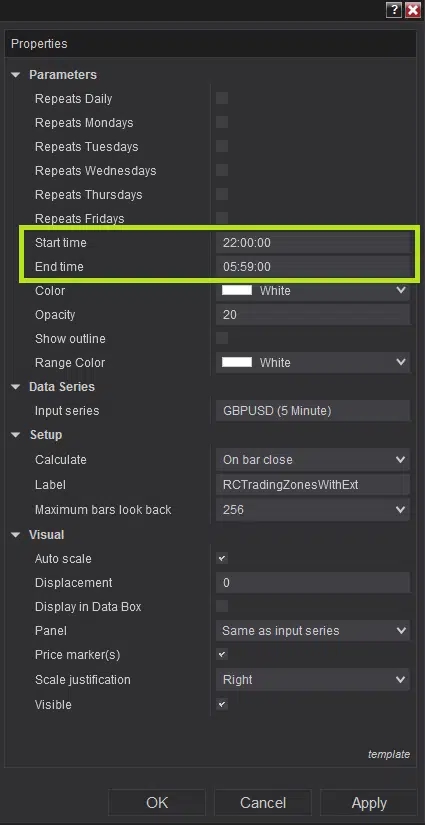
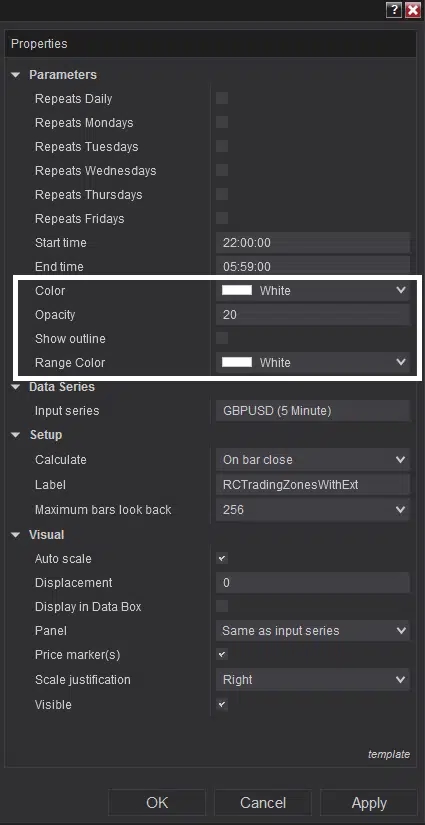
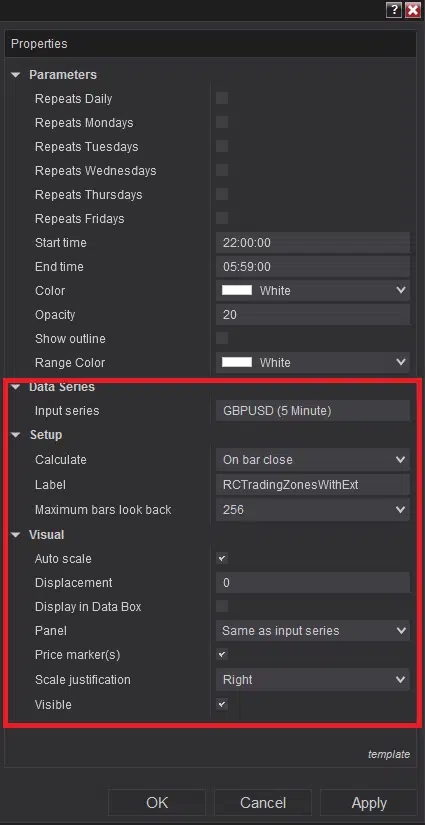
If you want to customise the plots’ colours, opacity, etc., you can do that from the parameters marked with the white rectangle in Image 5. It is highly recommended not to change the settings marked with the red rectangle in Image 6.
See how the Trading Zones With Extension - Premium Indicator has evolved over time

