🎄 Christmas Sale — 25% OFF EverythingUse Code: RCXMAS25ALLEnds Dec 25, 2025
Rize Capital Logo
Home
Free IndicatorFree Resources
IndicatorStrategyTutorial with Source Code
Ninjascript Programming TrainingCustom Programming
Rize Capital Logo
Rize Capital Logo
Home
Ninjascript Programming TrainingCustom Programming
Sign inCreate account

Registered address

Registered in England and Wales.
Registration # 12039916
53 Rodney Crescent, Filton,
Bristol BS34 7AF
United Kingdom

PayPal Secured

Information

  • Home
  • About Us
  • Support
  • Membership
  • Partner Program
  • Blog
  • Feedback Submission
  • Contact us
  • Terms & Conditions
  • Privacy Policy
  • Return & Refund Policy
  • Disclaimer
  • Cookies
  • Sitemap

Follow us

X
Facebook
Youtube
Instagram
LinkedIn

Resources

ninjatrader affiliateRize Capital Datafeed

Risk Disclosure: An investor could potentially lose all or more than the initial investment. Risk capital is money that can be lost without jeopardizing ones' financial security or life style. Only risk capital should be used for trading and only those with sufficient risk capital should consider trading. Past performance is not necessarily indicative of future results.

Hypothetical Performance Disclosure: Hypothetical performance results have many inherent limitations, some of which are described below. No representation is being made that any account will or is likely to achieve profits or losses similar to those shown; in fact, there are frequently sharp differences between hypothetical performance results and the actual results subsequently achieved by any particular trading program. One of the limitations of hypothetical performance results is that they are generally prepared with the benefit of hindsight. In addition, hypothetical trading does not involve financial risk, and no hypothetical trading record can completely account for the impact of financial risk of actual trading. for example, the ability to withstand losses or to adhere to a particular trading program in spite of trading losses are material points which can also adversely affect actual trading results. There are numerous other factors related to the markets in general or to the implementation of any specific trading program which cannot be fully accounted for in the preparation of hypothetical performance results and all which can adversely affect trading results.

Testimonials: Testimonials appearing on this website may not be representative of other clients or customers and is not a guarantee of future performance or success.

Live Trade Room: This presentation is for educational purposes only and the opinions expressed are those of the presenter only. All trades presented should be considered hypothetical and should not be expected to be replicated in a live trading account.

Additional Disclosure: Rize Capital Ltd, also known as rizecap.com assumes no responsibility for your investment and trading results. Past performance does not guarantee future performance and Rize capital Ltd does not make any performance representations or guarantees. Any chart or trading demonstration produced by Rize capital Ltd representing trades and using any methods of indicators or strategies on rizecap.com website or in any advertisement, seminar, brochure, magazine or online demonstrations are to be considered hypothetical trades and investments for educational purposes only. No trading system can guarantee profits or loss. Hypothetical trading results can be unreliable.

© Copyright 2019 - 2025 Rize Capital Ltd

Trend Change Indicator - Premium Indicator

Click to play video

Trend Change Indicator - Premium Indicator Video Thumbnail

Trend Change Indicator - Premium Indicator

INDICATOR

1st Month Free Trial
£9Excl. VAT/month

Please Register for FREE account or Login to subscribe to this indicator.

Key Features

  • 1st month FREE TRIAL
  • Access to all future updates
  • 24/7 update and technical support
  • Cancel subscription anytime

By subscribing, you agree with our Terms & Conditions

The name of this pro-level premium NinjaTrader trend indicator says it all. It can identify trend changes and plot them on your charts, allowing you to spot potential market shifts before they happen. If you know the market change is expected soon, you can build your trading plan and move accordingly with this indicator with more precision. Moreover, you will have enough time for effective risk management as well. This NinjaTrader custom indicator can be used to plot the big trend moves. Try it FREE for the first month, watch the video to see how it works, and make your decision!

Gallery

See how the Trend Change Indicator - Premium Indicator looks in action with these screenshots

RCTrendChageIndicator-Overview-market-top-bottom-plots-Image-1-768x432.png
1 / 6
Click to zoom

Indicator Details

Learn how to use the Trend Change Indicator - Premium Indicator to improve your trading

483words
3min read
2sections
RCTrendChageIndicator-Overview-market-top-bottom-plots-Image-1-768x432.png
Click to ZOOM
Image - 1
RCTrendChageIndicator-min-30-days-data-needed-on-chart-image-2-768x432.png
Click to ZOOM
Image - 2
RCTrendChageIndicator-only-daily-and-intra-day-bar-periods-image-3-768x432.png
Click to ZOOM
Image - 3

The Trend Change Indicator, developed by Rize Capital, is designed for use on the NinjaTrader 8 trading platform. This indicator plots significant trend changes before they actually take place. It has been developed with the intention of producing high-quality trend change signals with greater accuracy. As a result, you will see fewer signals on the chart, providing you with the option to take long term trades with a high risk-reward ratio. For those with a small account, this indicator could be the answer to your question of how to grow an account with limited capital.

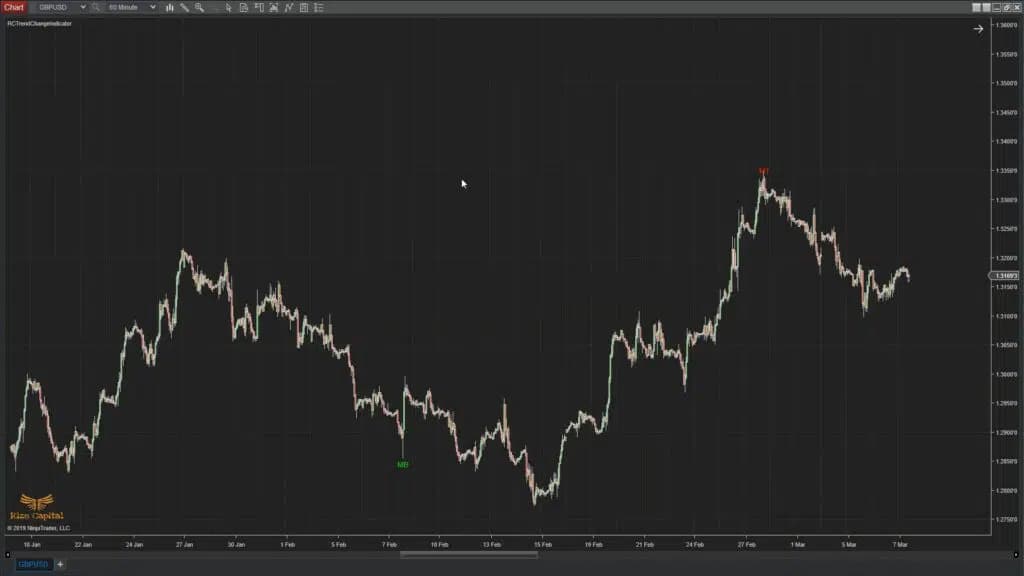
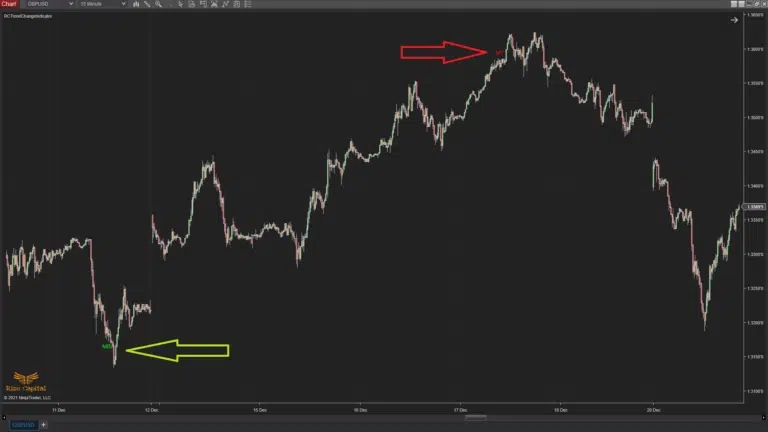
As shown with green and red arrows in Image 1, it will plot ‘MB’ to indicate a potential market direction change to an uptrend and ‘MT’ to indicate a potential change in the current market trend to a downtrend. You can manage your entries and exits using these plots or follow your own risk management strategy for exits.

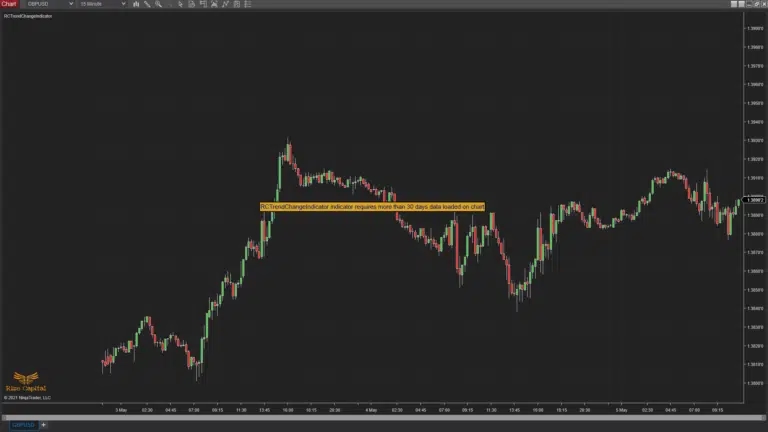
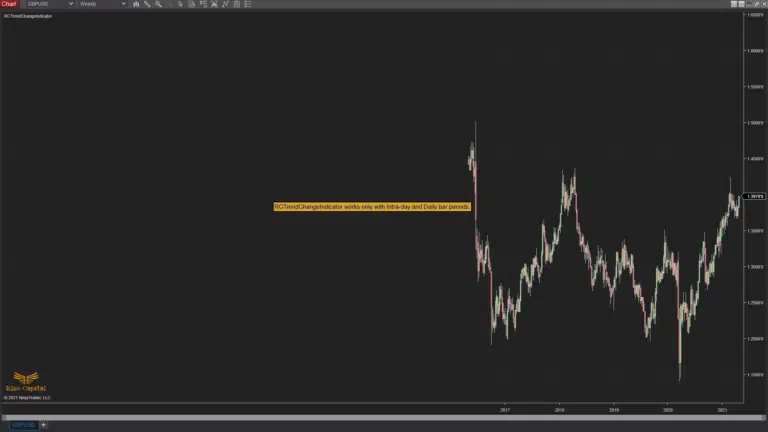
This indicator requires a minimum of 30 days of data on the chart; otherwise, you will receive a reminder message, as shown in Image 2, prompting you to load more data. The indicator works on any market and instrument, but it only functions on intraday and daily time frame charts. If your chart does not match the correct time frame, it will display a reminder message, as shown in Image 3, so that you can adjust the chart time frames accordingly.

RCTrendChageIndicator-Settings-for-parameters-image-4.png
Click to ZOOM
Image - 4
wf6f4xp8vg580mv2h46eofm7-RCTrendChageIndicator-Settings-MB-MT-text-color-image-5.png
Click to ZOOM
Image - 5
z00bs6sqe6zyg34o8epq4ara-RCTrendChageIndicator-Settings-default-do-not-change-image-6.png
Click to ZOOM
Image - 6

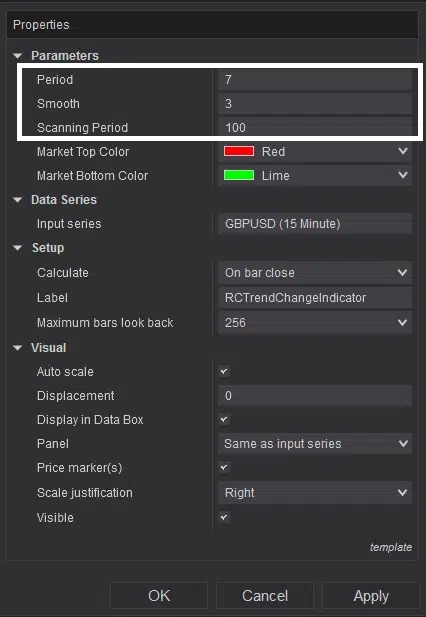
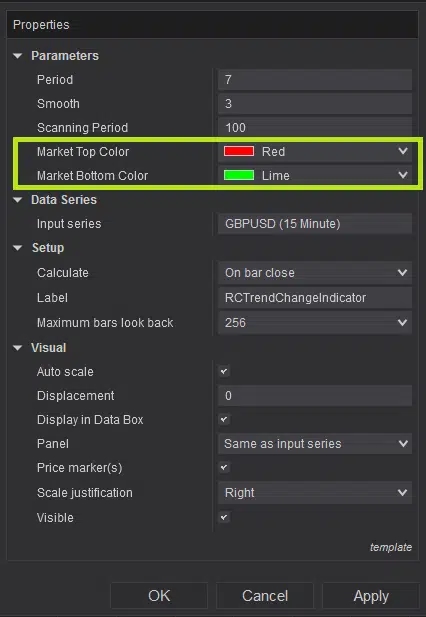
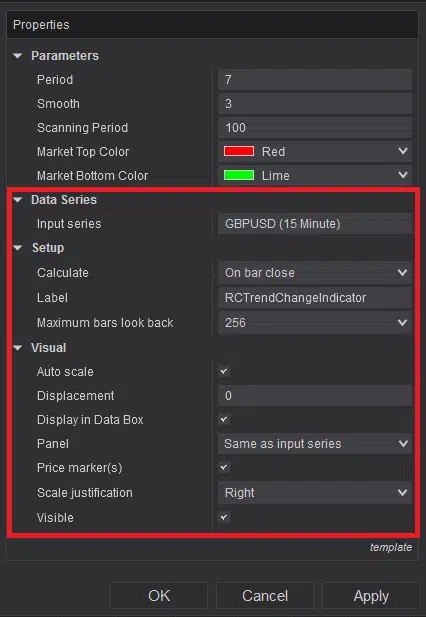
Now you can customise some parameter values marked by the white rectangle in Image 4. Here, you can customise the Period, Smooth, and Scanning period for your test to find your ideal settings. If you would like to change the text plots on the chart, you can do that from the settings options marked within the lime green rectangle in Image 5. However, it is recommended not to make any changes to the default settings, marked by the red rectangle in Image 6.

If you still have any further queries, please do watch the video tutorial above on how this indicator and its settings work.

Version History

See how the Trend Change Indicator - Premium Indicator has evolved over time

  • Version 5.2.0.1

    • This can be used on any instrument
    • Minimum data loaded on chart checks added
    • Indicator folder location updated
    • Script optimized
    • Auto update and announcement added