Click to play video

Tutorial with Source Code
Please Register for FREE account or Login to purchase this source code.
By downloading, you agree with our Terms & Conditions
The DayType Radar is one of the sophisticated market classification NinjaTrader 8 trend indicators we have. It specialises in identifying the likely market regime early in the session by measuring price structure and directional consistency during a configurable time window, automatically classifying each day into three distinct categories—Trend Day Ready, Balanced Rotational, or Choppy Two-Sided—whilst using ATR normalisation to adapt across different instruments and timeframes. When you purchase the DayType Radar from Rize Capital, one of the best NinjaTrader indicators in our platform, you receive the complete NinjaScript source code, providing total freedom to modify and customise the indicator. For a detailed overview, check out our video tutorial above.
See how the DayType Radar - NinjaTrader 8 Indicator looks in action with these screenshots
Learn how to use the DayType Radar - NinjaTrader 8 Indicator
The DayType Radar Indicator for NinjaTrader 8 specialises in early session market regime classification. It does that by measuring opening window range and directional consistency during a user-defined time period. As a result, it can automatically determine whether the current trading day exhibits trending characteristics, balanced rotational behaviour, or choppy two-sided action. The core functionality revolves around a dynamic throttle score calculation combined with ATR normalisation that provides consistent classification across multiple instruments and timeframes.
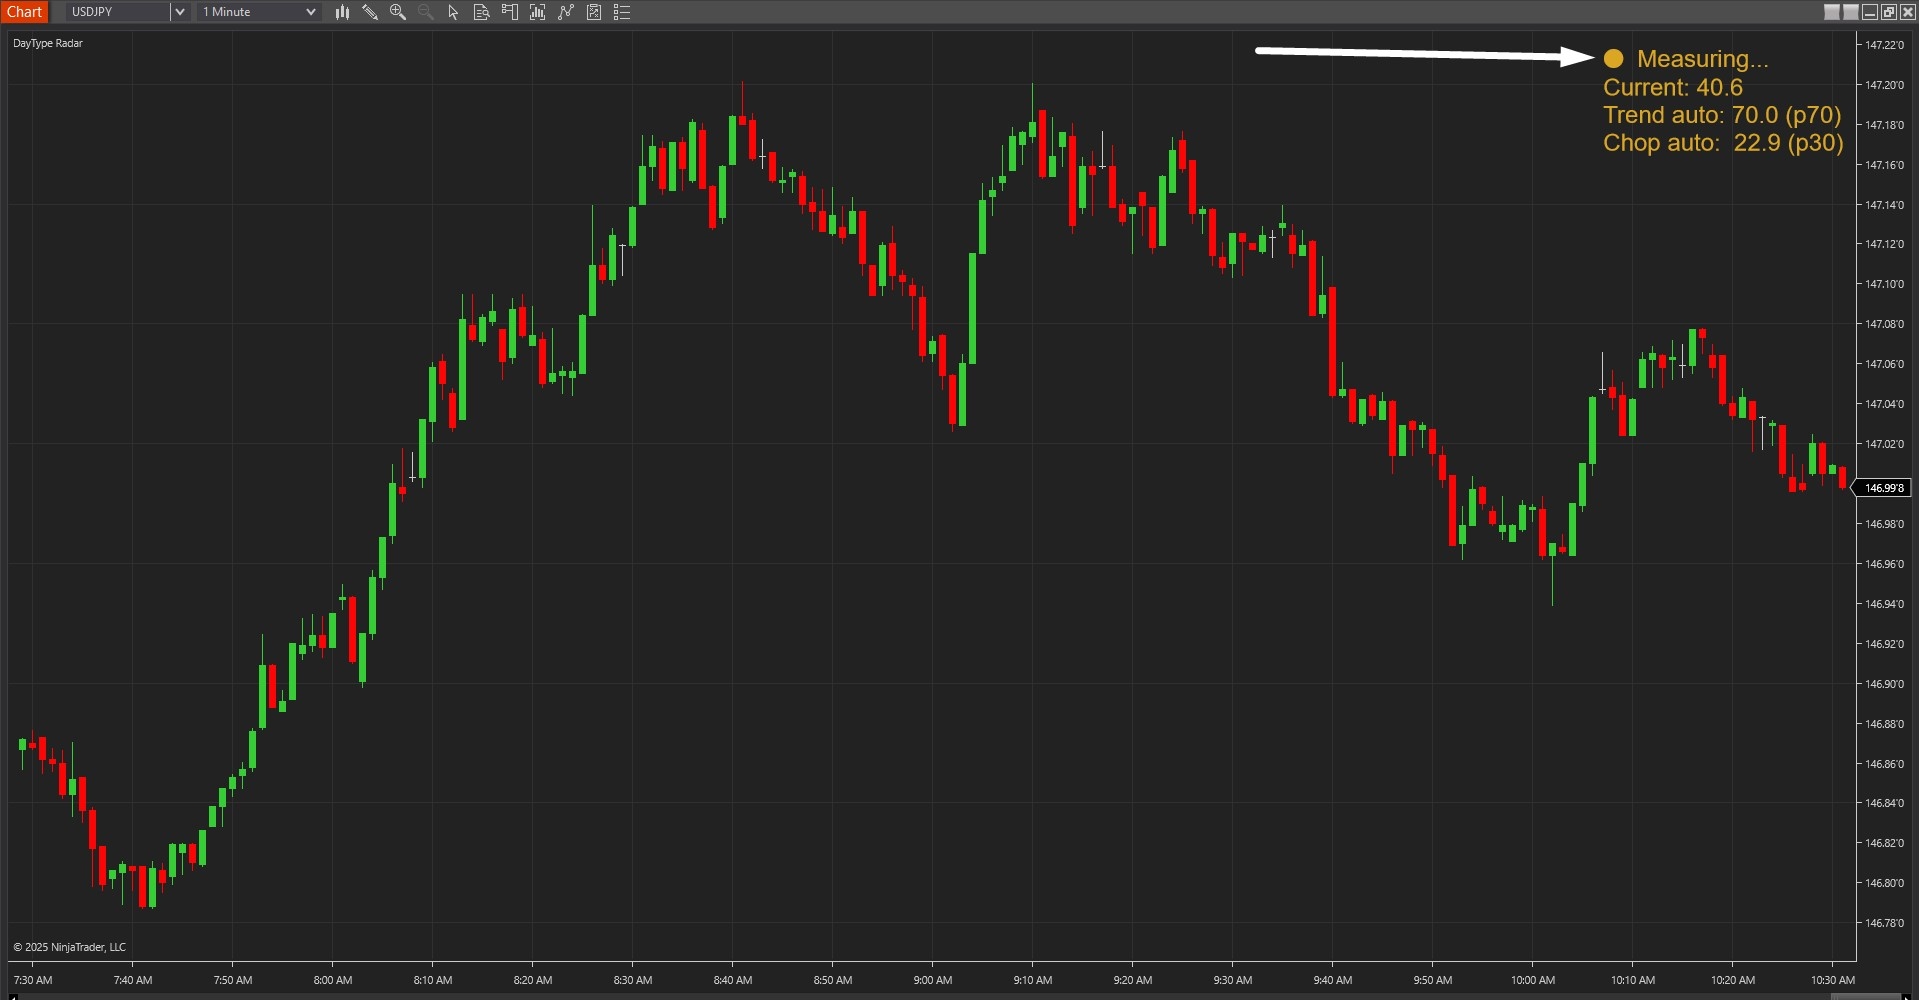
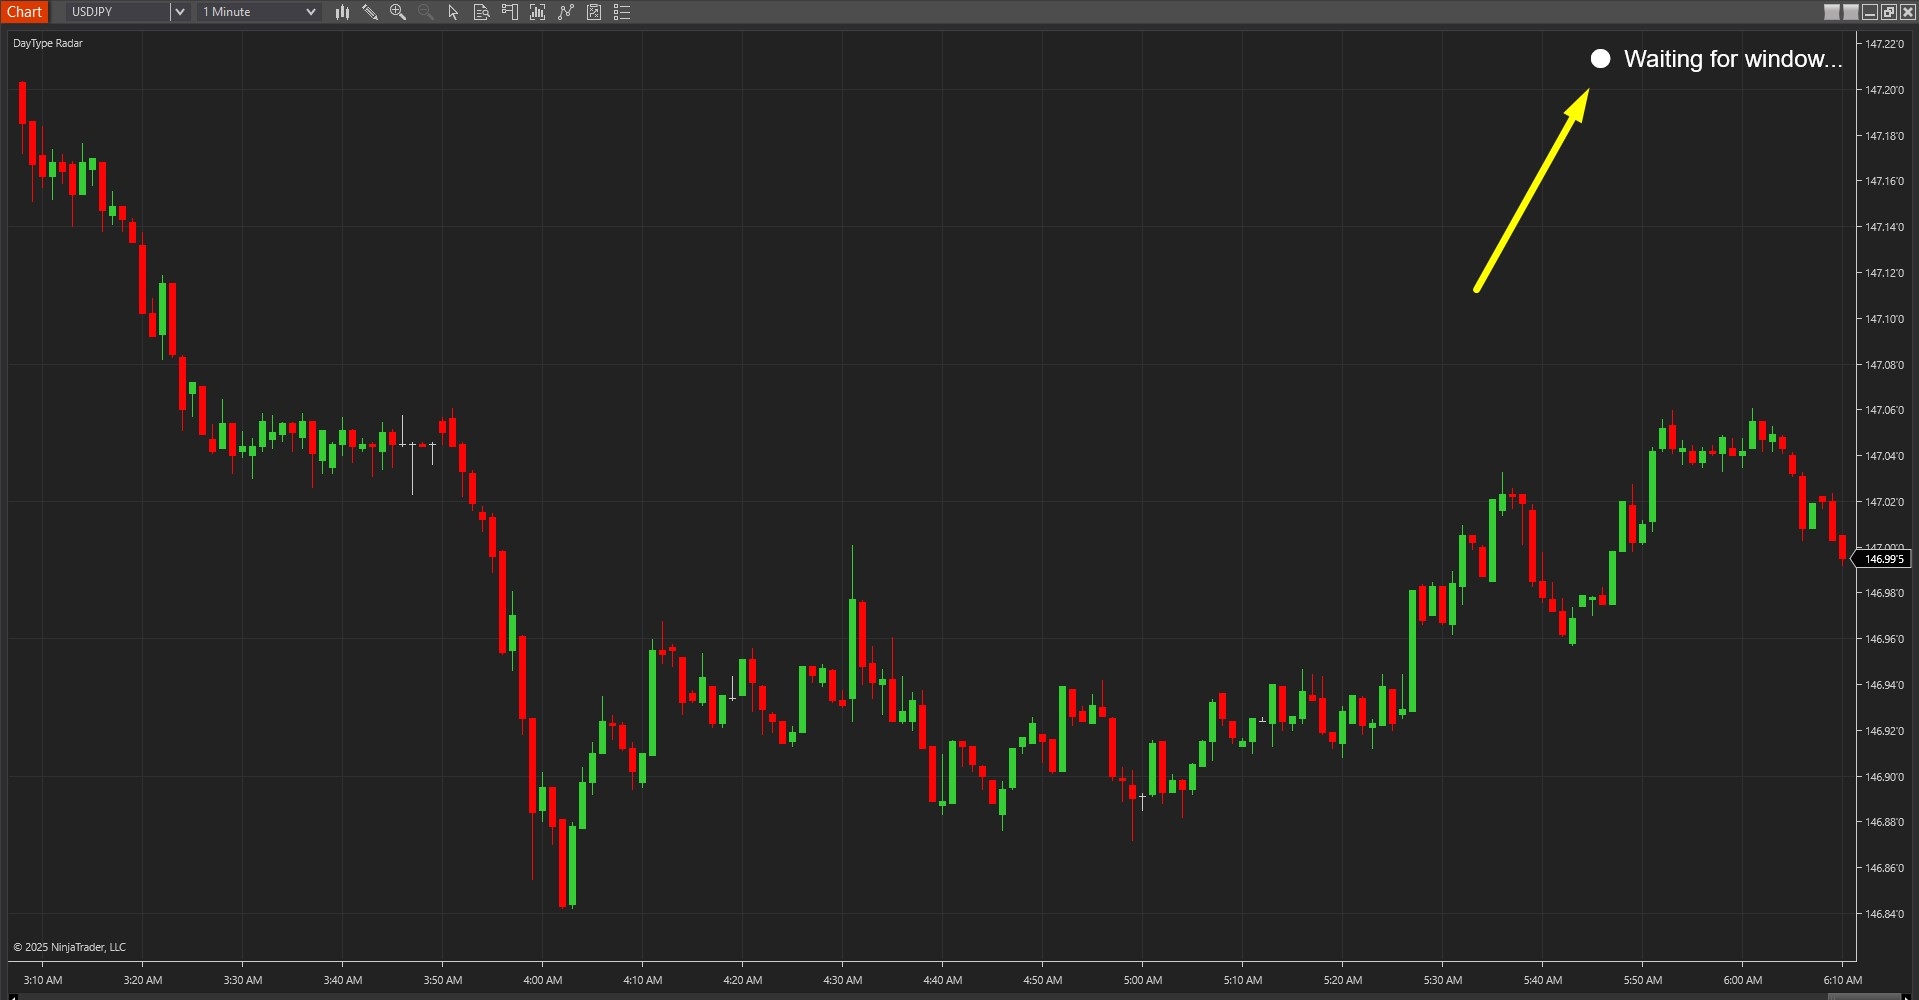
As shown in Image 1 (pointed by a yellow arrow), the indicator displays a prominent label in the top-right corner of the chart showing the current state. During the pre-measurement phase, the label displays "Waiting for window" in a neutral colour, indicating the tool is holding for the configured measurement window to begin. Once the window start time arrives, the label transitions to "Measuring" (pointed by a white arrow in image 2), signalling that the indicator is actively tracking opening range and price flip-flop behaviour in real-time.
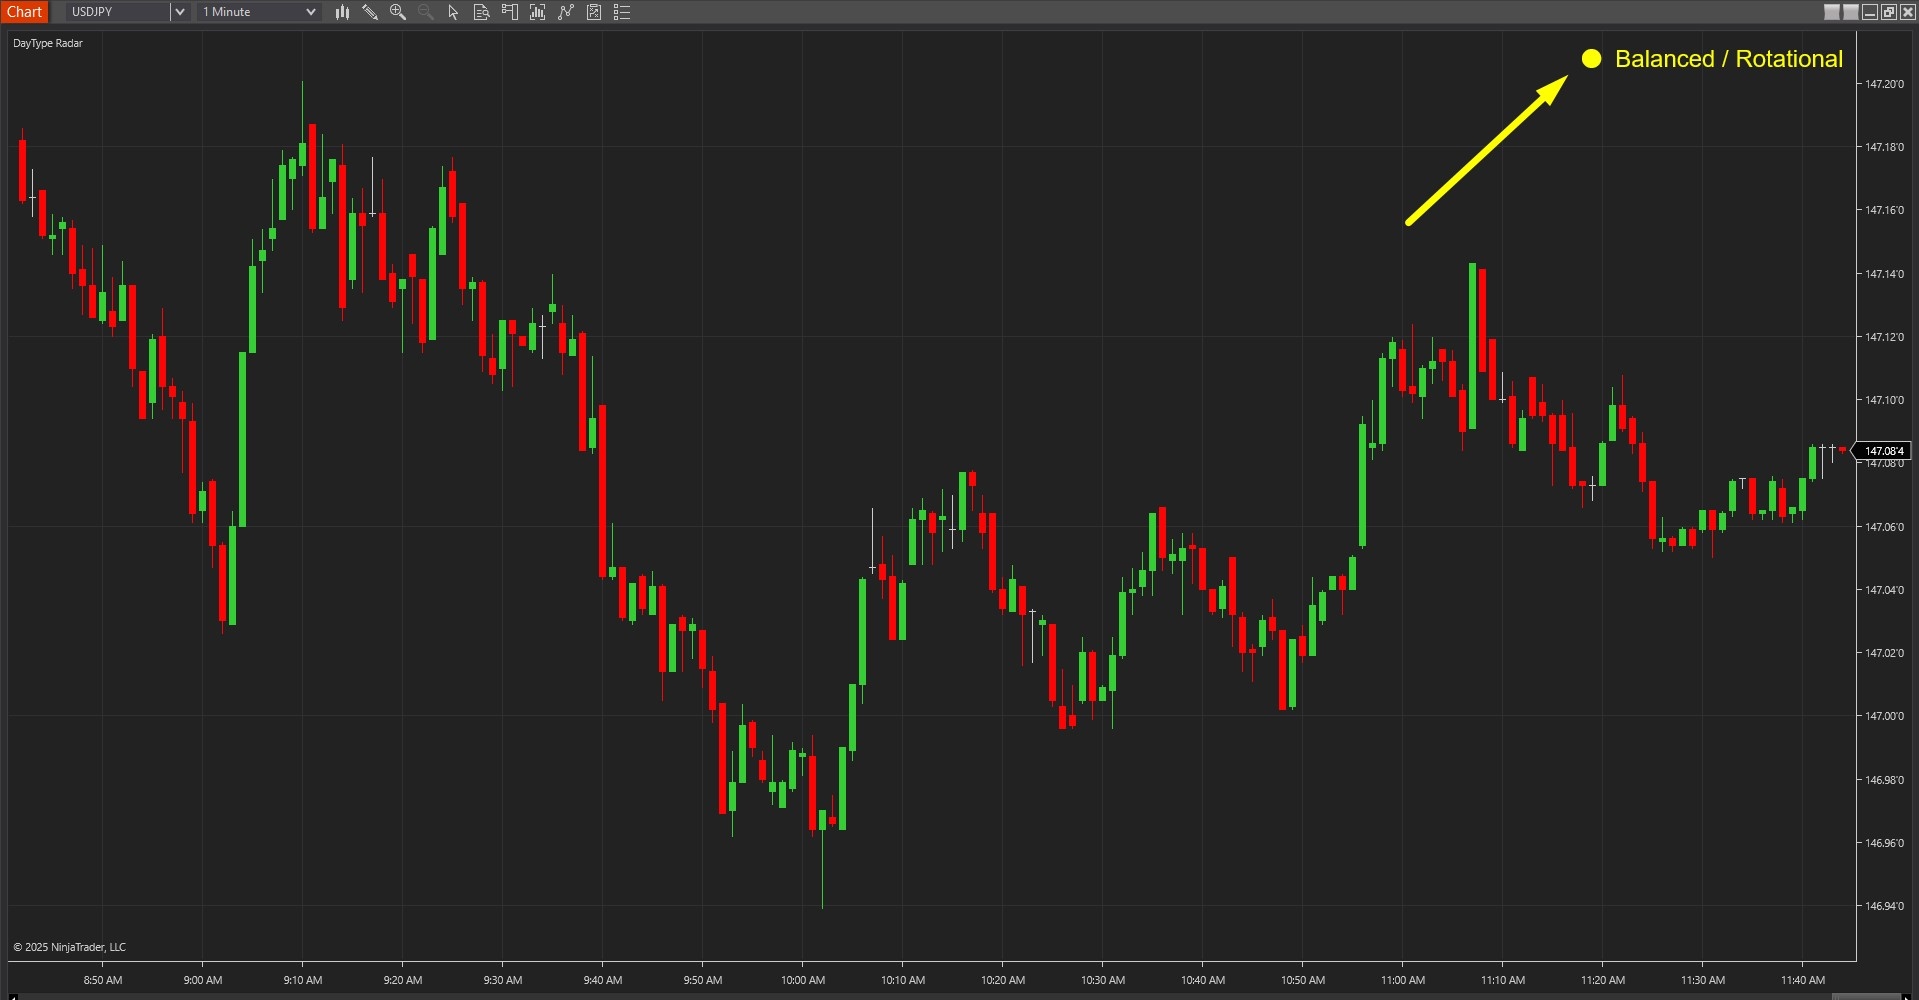
The indicator goes beyond simple range measurement by combining two critical metrics into a unified classification system. In Image 3 (pointed by a yellow arrow), the label displays the final classification—"Balanced Rotational" indicates moderate opening range with mixed directional behaviour, suggesting two-way rotation between key levels. "Trend Day Ready" appears when early structure demonstrates strong directional movement with minimal back-and-forth action, suggesting the session may offer extended trend-following opportunities. "Choppy Two-Sided" appears when the opening range is narrow relative to ATR and price exhibits excessive flip-flopping, warning traders of potential whipsaw conditions.
The classification framework automatically freezes once the measurement window closes, preserving the day type determination for the entire remaining session. This eliminates ambiguity and provides traders with a consistent regime reference throughout the trading day. The ATR normalisation ensures that what constitutes a "large" or "small" opening range adapts intelligently to each instrument's typical volatility characteristics, making classifications meaningful whether trading micros, standard contracts, or high-volatility instruments.
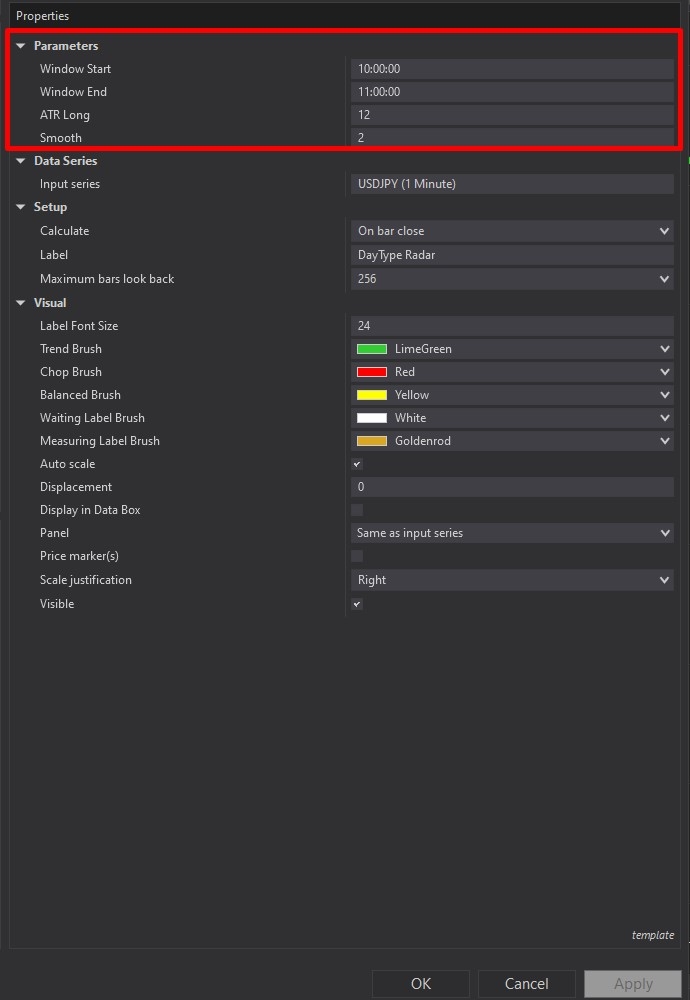
DayType Radar offers comprehensive customisation through its settings panel. The Parameters section, highlighted by a red rectangle in Image 4, controls the core measurement logic. The Window Start parameter defines when the measurement window begins—typically set to capture early session price action after the opening auction settles. The Window End parameter establishes when measurement concludes and the classification freezes. This configurable window allows traders to adapt the indicator to different session types, whether trading the overnight session, European open, US open, or any custom timeframe that best represents their market's personality.
The ATR Long parameter (default value varies by use case) determines the ATR period used to normalise the opening window range. This normalisation process compares the measured range against typical instrument volatility, ensuring classifications remain consistent across different market conditions. Higher ATR periods produce more stable, slower-changing baselines suitable for less volatile instruments or longer timeframes, whilst lower periods increase reactivity for volatile markets or shorter timeframes.
The Smooth parameter controls throttle score smoothing during the measurement window. Higher smoothing values create calmer, more stable readings that avoid jumpy classifications from brief price spikes, whilst lower smoothing increases responsiveness to rapid changes in directional consistency. This setting helps traders balance between stability and sensitivity based on their instrument's typical behaviour patterns.
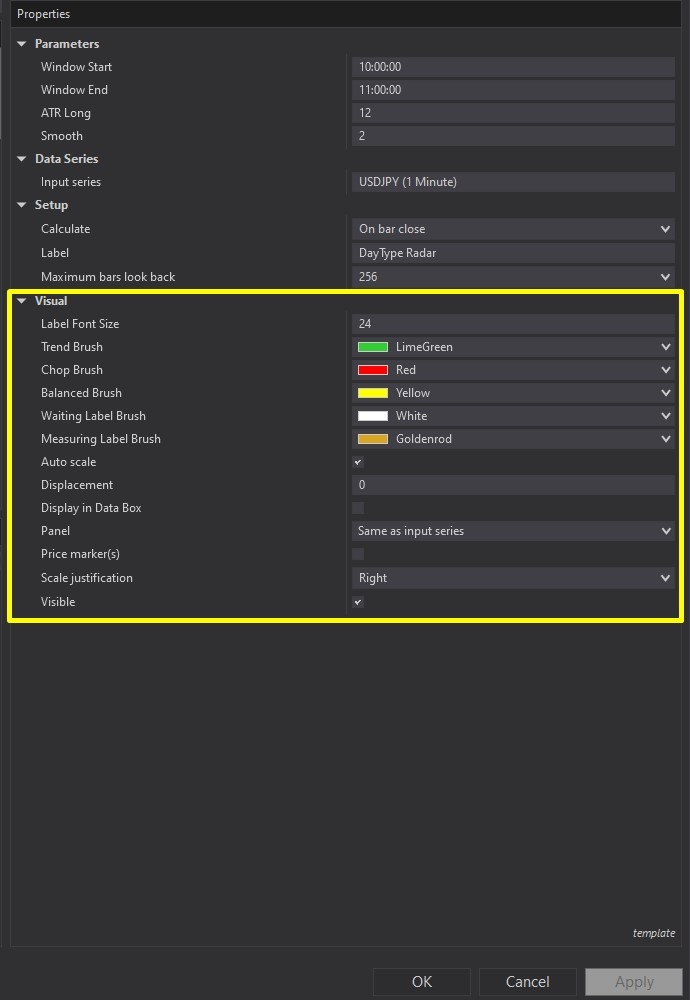
Image 5 displays the Visual configuration options, highlighted by a yellow rectangle. The Label Font Size parameter controls the on-chart label's text size, allowing adjustment for different monitor sizes, trading distances, or personal preference—larger fonts improve readability on expansive multi-monitor setups, whilst smaller fonts preserve chart real estate.
The colour customisation subsection provides complete control over visual appearance across all indicator states. Trend Brush (default colour varies) sets the label colour when "Trend Day Ready" is classified, making trending conditions immediately recognisable at a glance. Chop Brush controls the label colour for "Choppy Two-Sided" classifications, typically using attention-grabbing colours to warn traders of unfavourable conditions. Balanced Brush determines the label colour for "Balanced Rotational" sessions, usually employing neutral tones to indicate moderate, two-way market character.
Waiting Label Brush customises the label appearance during the pre-measurement "Waiting" phase, whilst Measuring Label Brush controls colours during the active "Measuring" window. These distinct visual states help traders immediately understand where the indicator sits in its measurement cycle without reading text—critical for quick decision-making during fast-moving markets.
One of DayType Radar's most powerful features operates transparently in the background: adaptive threshold calibration. The indicator continuously analyses historical session data available on the chart, automatically adjusting internal classification thresholds based on observed market behaviour patterns. More data produces more accurate calibration—the tool learns what constitutes "normal" opening ranges and directional consistency for the specific instrument and timeframe being traded.
This adaptive learning eliminates manual threshold tuning across different markets. The same indicator configuration that works on crude oil futures automatically recalibrates when applied to currency futures or equity indices, adjusting its classification boundaries to match each instrument's unique personality. Traders benefit from intelligent, context-aware regime detection without complex parameter optimisation.
With full NinjaScript source code included, advanced users can modify the indicator. If you have questions about the indicator, refer to the comprehensive video tutorial above for detailed guidance.
Secure payment via PayPal
By downloading, you agree with our Terms & Conditions

