Click to play video
Tutorial with Source Code
Please Register for FREE account or Login to purchase this source code.
By downloading, you agree with our Terms & Conditions
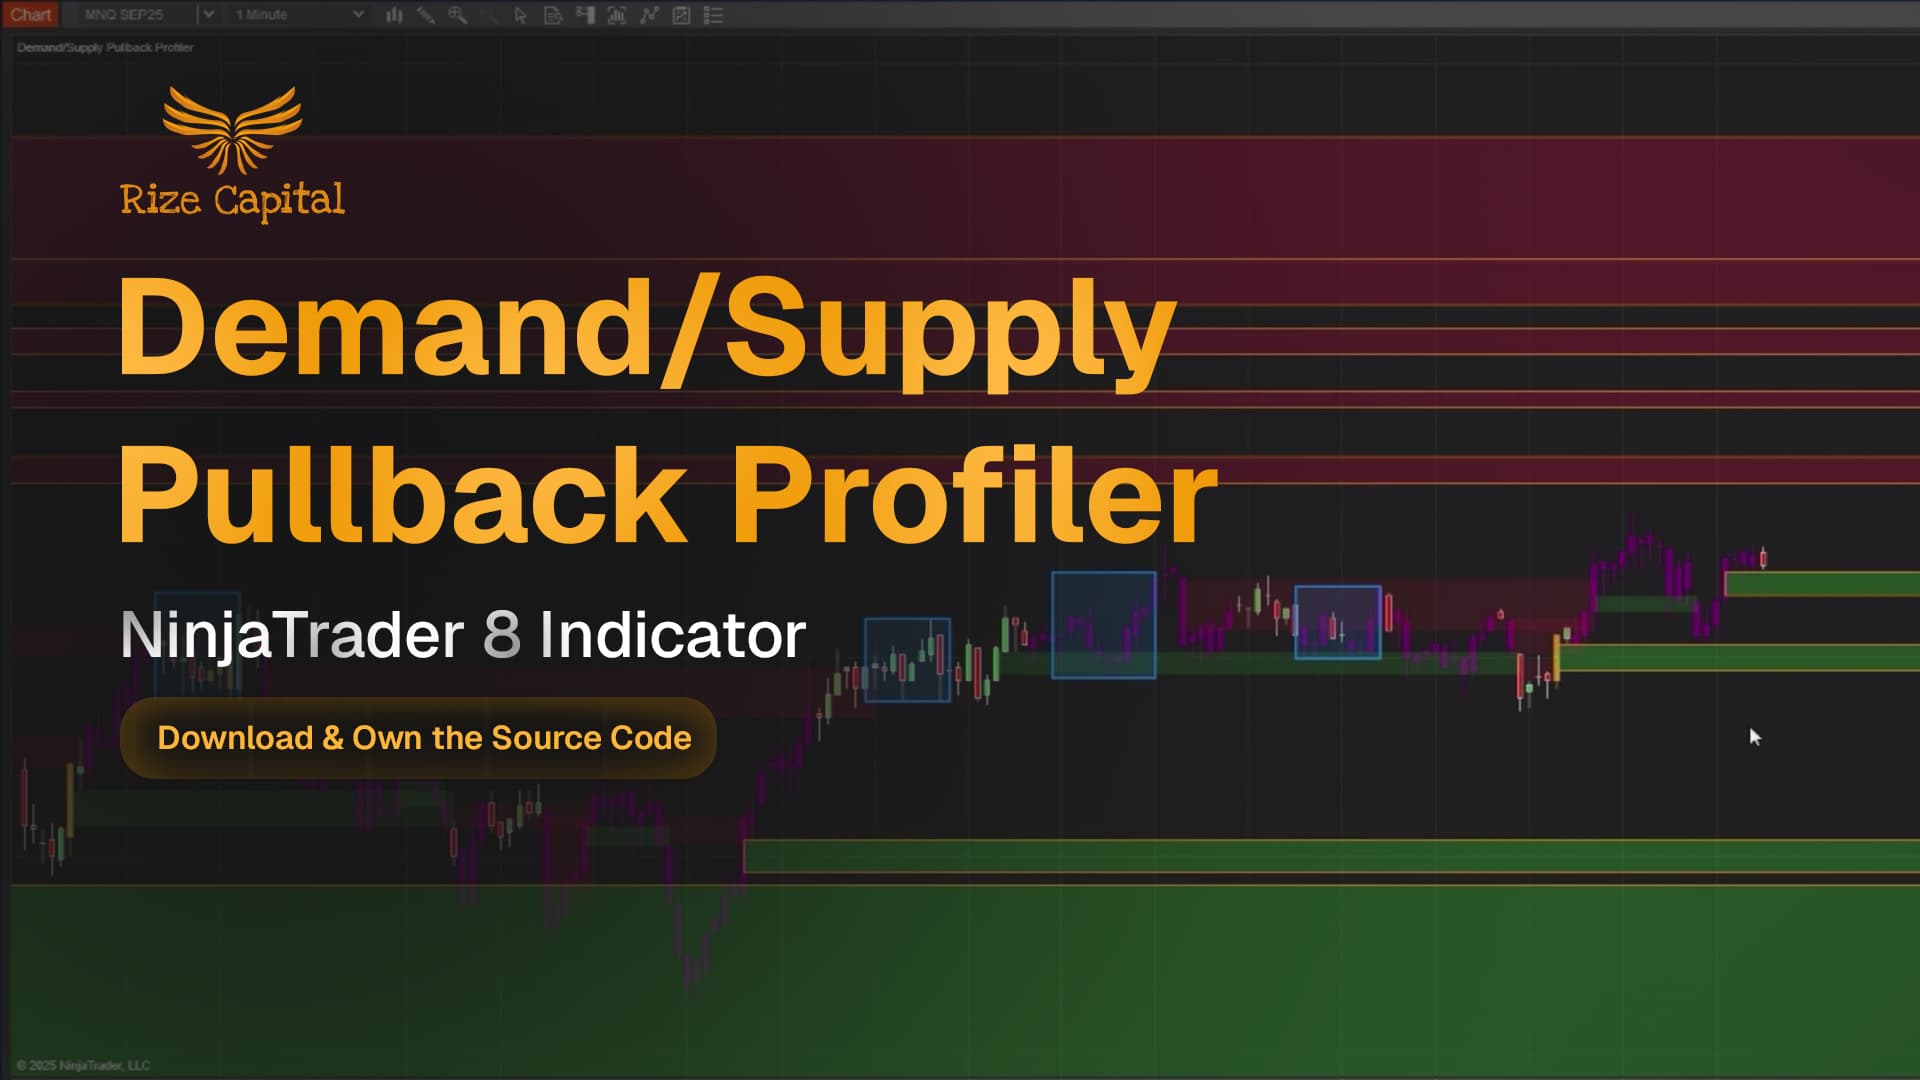
The Demand/Supply Pullback Profiler is a sophisticated market analysis indicator developed for NinjaTrader 8 and 8.1. It specialises in identifying institutional demand and supply zones combined with real-time pullback opportunities, automatically detecting areas where price previously moved with strong imbalances and painting visual signals when these zones are tested. When you purchase this NinjaTrader 8 Supply and Demand indicator from Rize Capital, you receive the complete NinjaScript source code, providing total freedom to modify the detection logic, customise the zone parameters and opacity settings, or integrate the indicator into automated strategies with no restrictions whatsoever. For a detailed overview, check out our video tutorial above.
See how the Demand/Supply Pullback Profiler - NinjaTrader 8 Indicator looks in action with these screenshots
Learn how to use the Demand/Supply Pullback Profiler - NinjaTrader 8 Indicator
The Demand/Supply Pullback Profiler Indicator for NinjaTrader 8 specialises in detecting institutional demand and supply zones where price previously moved with strong directional imbalances, automatically identifying areas where buyers or sellers demonstrated significant strength. The core functionality revolves around shaded zone detection combined with colour-coded bar painting that provides real-time visual confirmation of market regime.
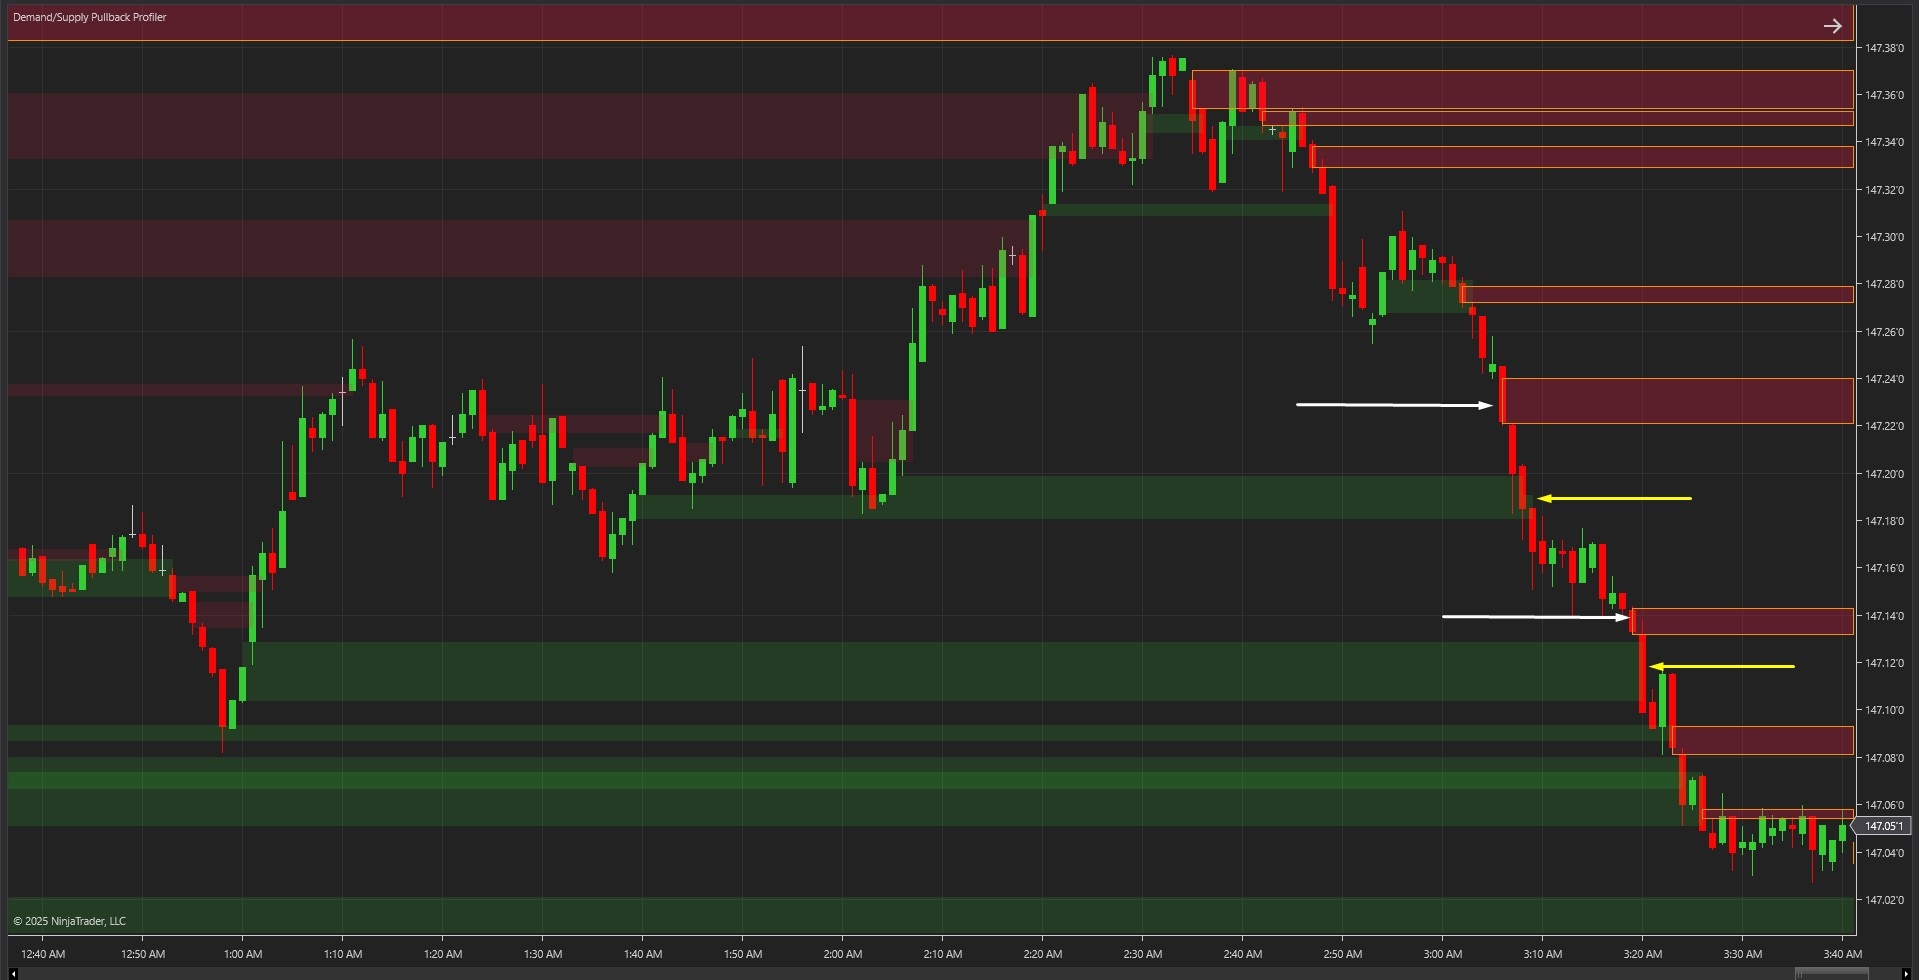
As shown in Image 1 (pointed by yellow arrows), green shaded areas represent demand zones—potential support levels where price previously exhibited strong buying pressure and may bounce upward upon retesting. Red or crimson shaded areas represent supply zones (pointed by white arrows)—potential resistance levels where sellers previously dominated and price may reverse downward when these zones are tested again.
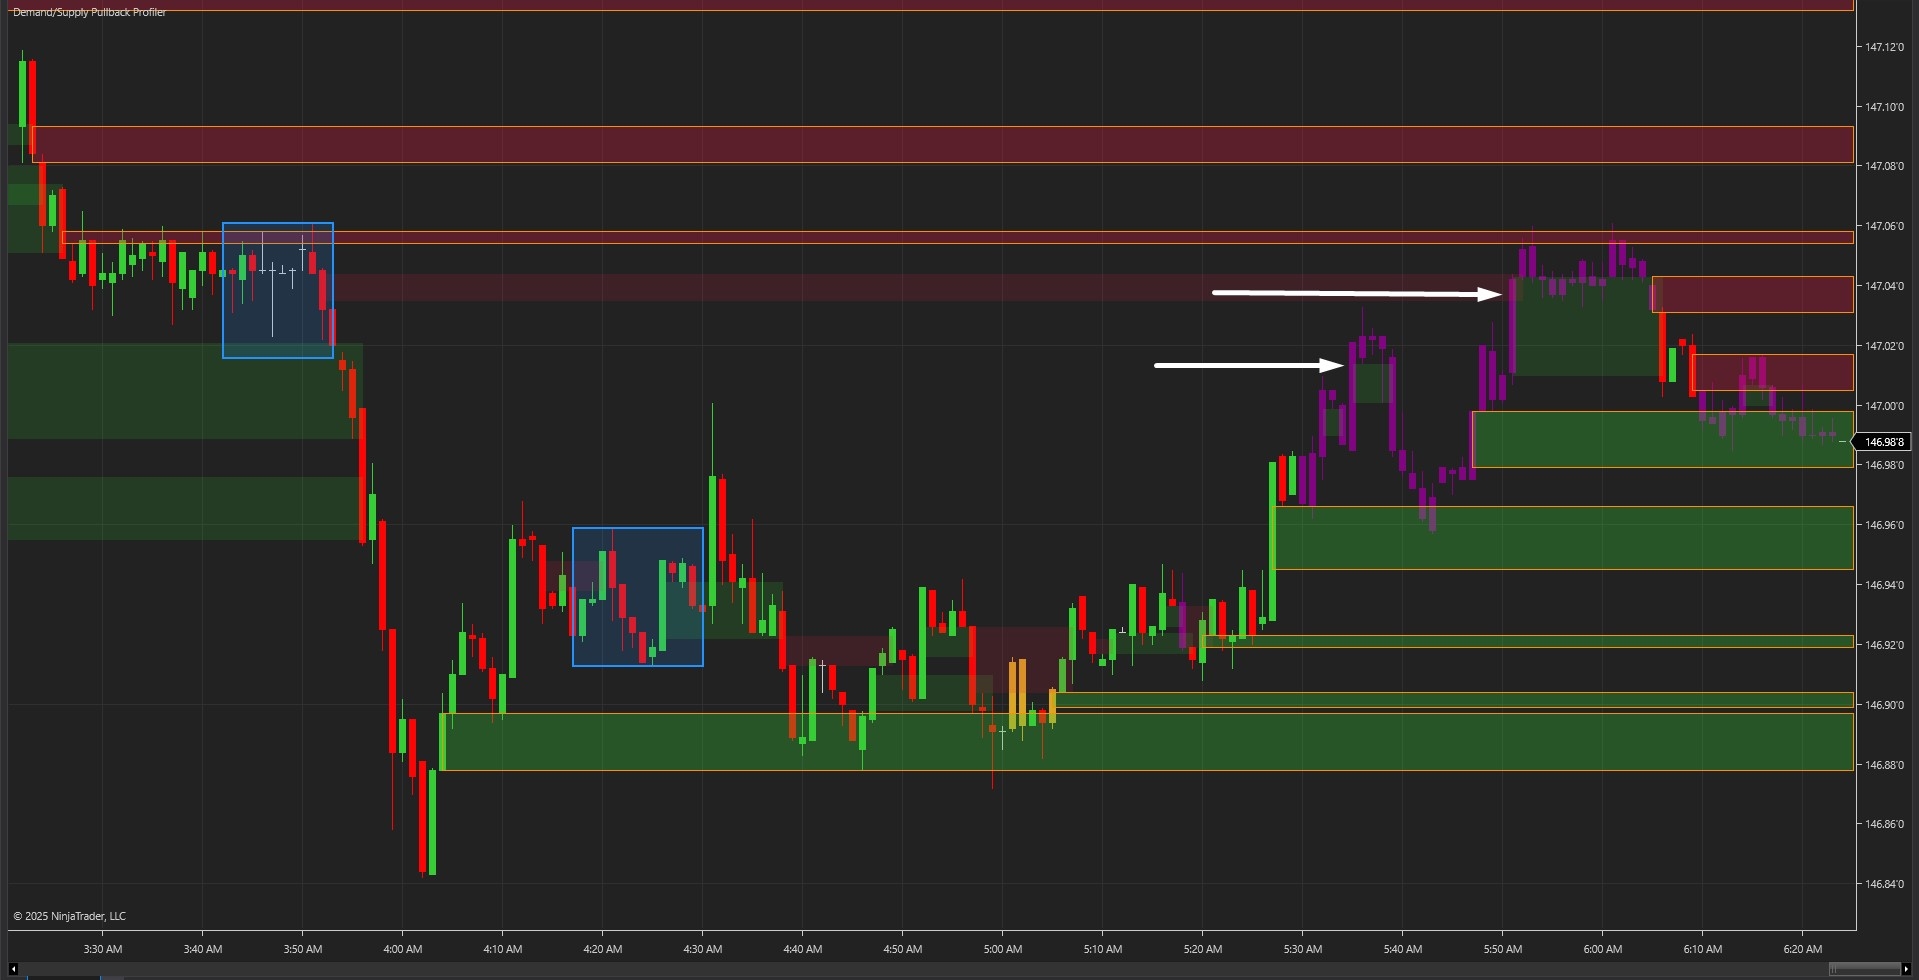
The indicator goes beyond simple zone detection by providing regime confirmation through painted price bars. In Image 2 (pointed by white arrows), purple bars appear when price interacts with a demand zone and bounces, signalling a long regime where traders should focus on bullish entries. Golden rod bars appear when price hits a supply zone and reacts lower, indicating a short regime where bearish setups become favourable. This visual painting system eliminates guesswork and keeps traders aligned with institutional momentum.
The visual framework automatically manages zone lifecycle—active zones display with full opacity and orange outlines, whilst previously filled zones remain visible at reduced transparency (default 15%) for historical reference and backtesting purposes. This helps traders study how price reacted at these levels in the past.
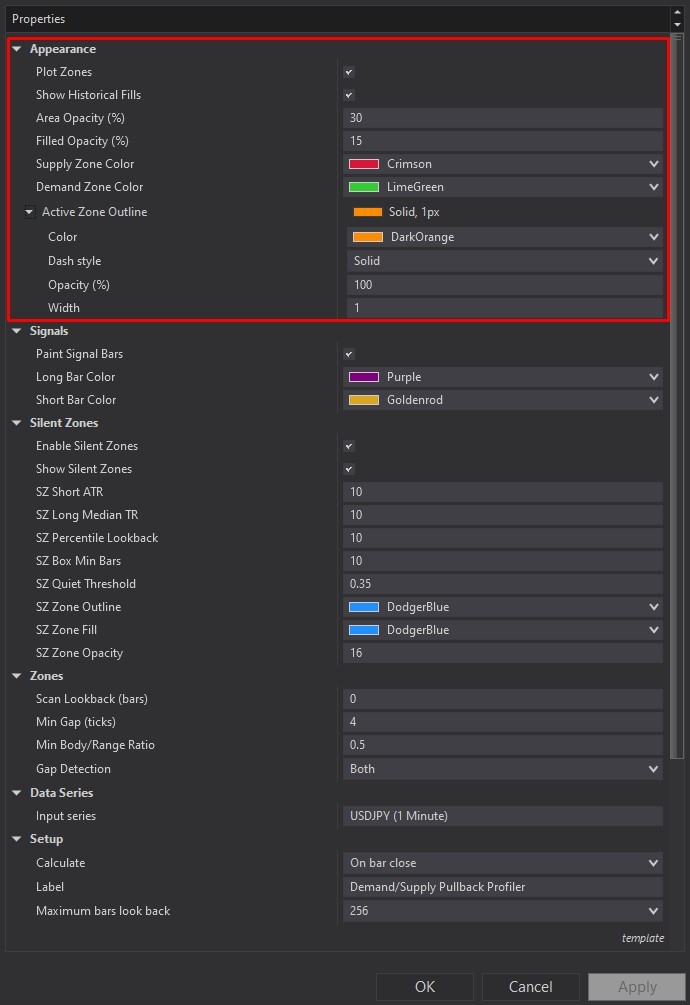
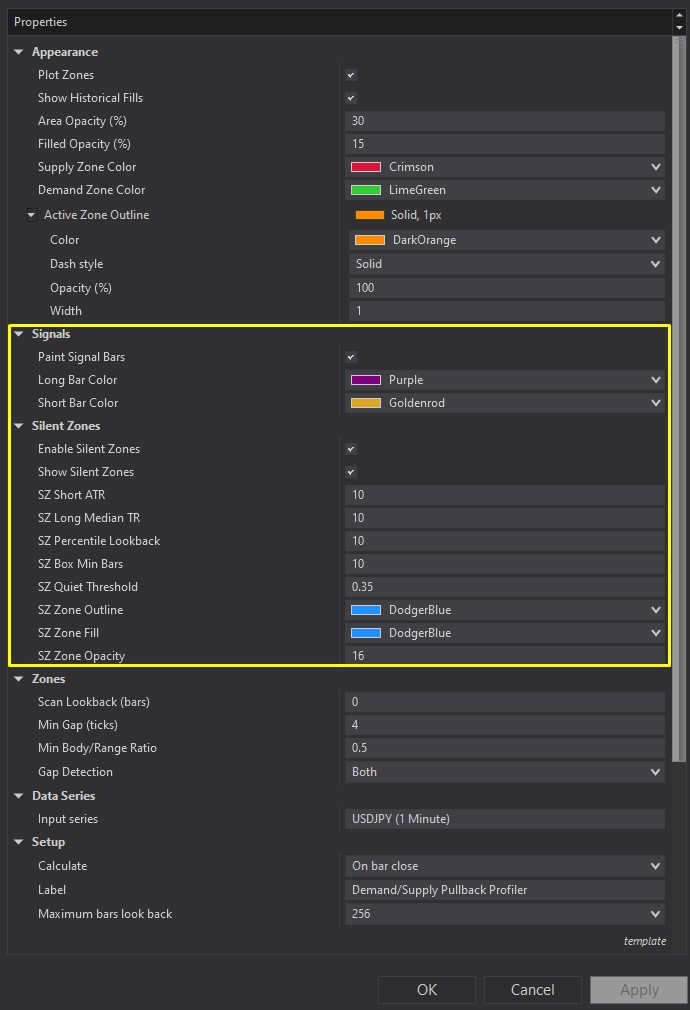
Demand/Supply Pullback Profiler offers comprehensive customisation through its settings panel. The Appearance section, highlighted by a red rectangle in Image 3, allows full control over zone visualisation, including supply zone colour (default crimson), demand zone colour (default lime green), area opacity for active zones (default 30%), and filled opacity for historical zones (default 15%). The active zone outline can be customised with adjustable colour and thickness, defaulting to a 1-pixel orange border that clearly distinguishes zones currently in play.
Image 4 displays the Signals and Silent Zones configuration options, highlighted by a yellow rectangle. The Signals subsection enables painted bar functionality with customisable long bar colour (default purple) and short bar colour (default golden rod). The Silent Zones feature represents one of the indicator's most powerful discipline tools—when enabled, it automatically detects low-volatility consolidation periods and displays blue shaded boxes on the chart. During these silent zones, new trading signals are completely suppressed, preventing traders from taking positions in choppy, directionless markets. Parameters include short ATR period, long median TR, percentile lookback, minimum bars required, and quiet threshold sensitivity.
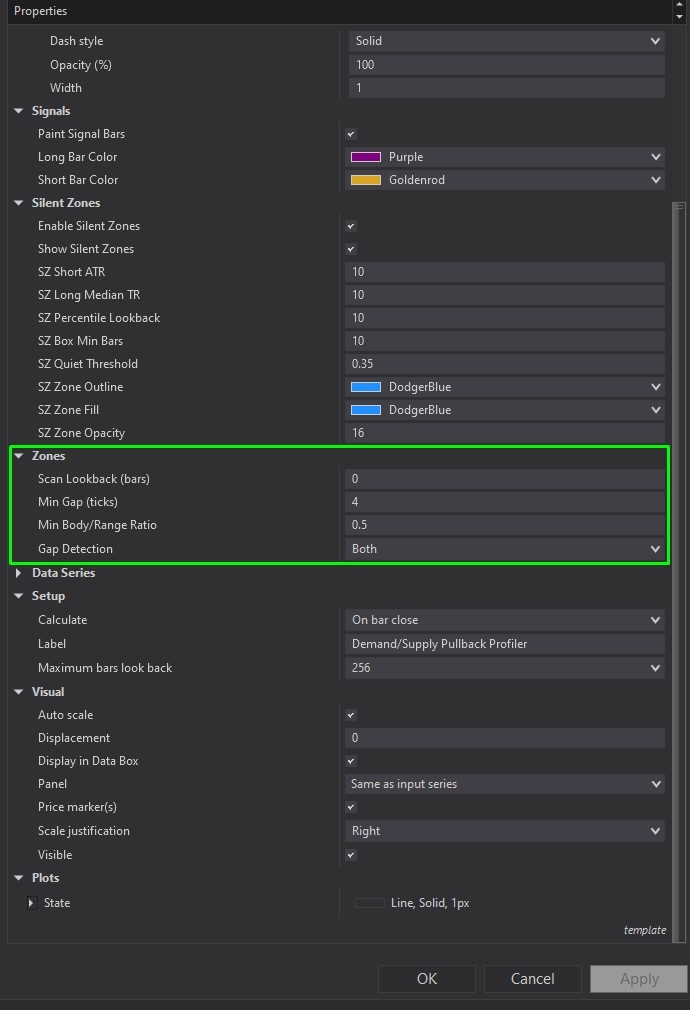
The Zones section, illustrated in Image 5 (highlighted by a green rectangle), controls the core detection logic. Traders can adjust the scan lookback bars to determine historical depth (zero scans the full chart), set minimum gap ticks to filter insignificant price moves (default 4 ticks), configure minimum body-to-range ratio for body-based detection (default 0.5), and select gap detection method from wick, body, or both options. These parameters allow precise tuning whether you're scalping on lower timeframes or swing trading on daily charts.
With full NinjaScript source code included, advanced users can modify the zone detection algorithms, adjust the silent zone calculation logic, integrate the signals into automated strategies, or build custom alert systems without restrictions. The source code package includes comprehensive documentation with overview, features, options, and logic details to facilitate understanding and customisation.
If you have questions about optimal parameter settings for different timeframes or trade management techniques using demand/supply zones, refer to the comprehensive video tutorial above for detailed guidance on maximising the Demand/Supply Pullback Profiler's effectiveness in your trading approach.
Secure payment via PayPal
By downloading, you agree with our Terms & Conditions

