Click to play video
.jpg&w=2048&q=75)
Tutorial with Source Code
Please Register for FREE account or Login to purchase this source code.
By downloading, you agree with our Terms & Conditions
This pro-level premium NinjaTrader drawing tool is engineered to provide traders with a significant competitive advantage in day trading, swing trading, and position trading. It delivers adaptive market structure analysis through volatility-based corridor projection. The Dynamic Corridor was specifically developed for NinjaTrader 8 users who demand precision in breakout and range trade analysis, and the exceptional value is that it works seamlessly with any type of NinjaTrader 8 license. Drawing tools of this sophistication are exceptionally rare because they automatically adapt to market volatility using advanced algorithms that combine ATR, percentile range analysis, and geometric symmetry principles, giving you a substantial edge over traders relying on static drawing tools or expensive institutional-grade software. While other providers offer basic corridor tools, they typically charge premium prices for limited functionality and don't provide the source code, making customisation impossible for most traders. However, we've developed this comprehensive solution from the ground up and include the complete NinjaScript source code along with detailed tutorial documentation, allowing you to modify, expand, and integrate the tool into your own custom strategies without restrictions. Watch the comprehensive video tutorial to discover how this adaptive corridor system can transform your market analysis approach, and experience firsthand why traders consider it an indispensable addition to their trading arsenal.
See how the Dynamic Corridor - NinjaTrader 8 Drawing Tool looks in action with these screenshots
Learn how to use the Dynamic Corridor - NinjaTrader 8 Drawing Tool
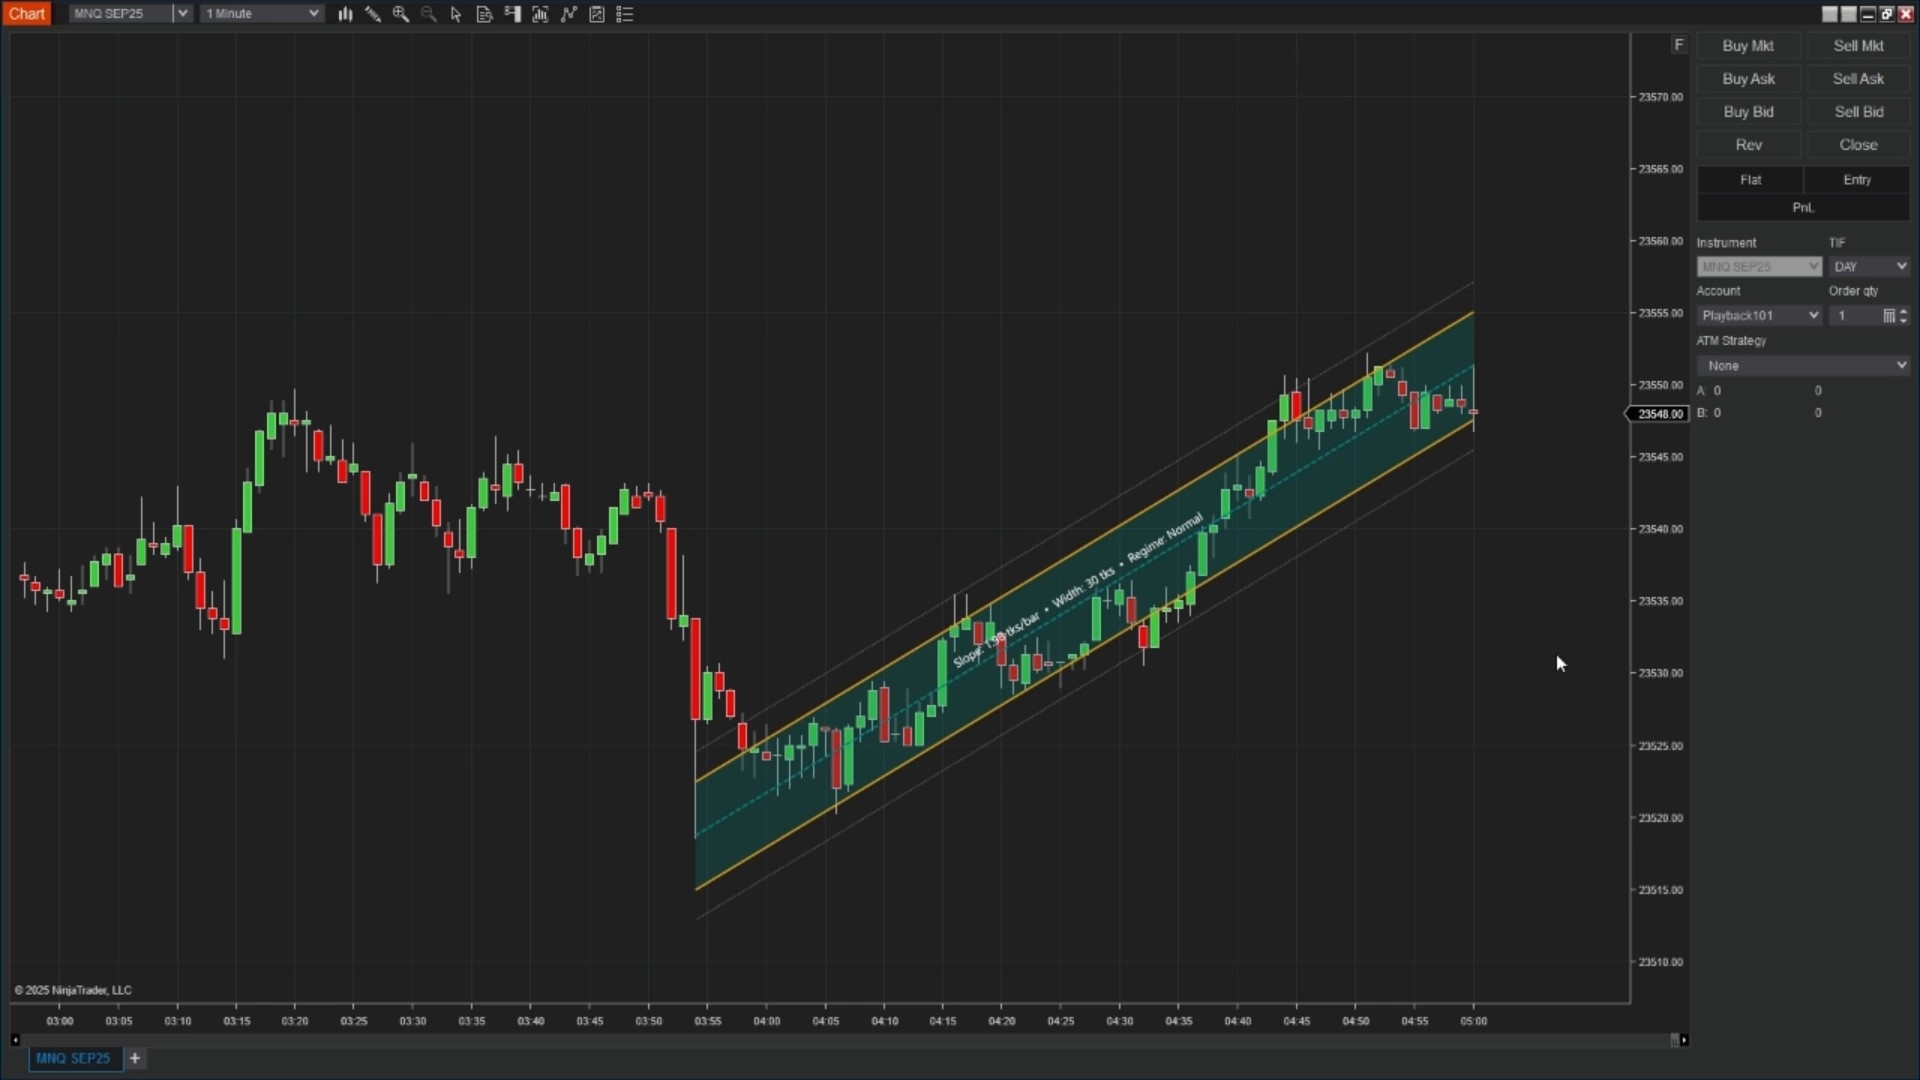
The Dynamic Corridor is a professional drawing tool for NinjaTrader 8 that creates adaptive market structure analysis with just two anchor clicks. Created and presented to you by Rize Capital, this sophisticated tool automatically projects volatility-based corridors between swing points, providing traders with precision breakout and range trade analysis capabilities.
As shown in Image 1, the tool draws a centre line between two user-defined anchor points and projects upper and lower rails that adapt to market volatility. The corridor automatically adjusts its width using a combination of volatility measurements, percentile range analysis, and geometric symmetry principles.
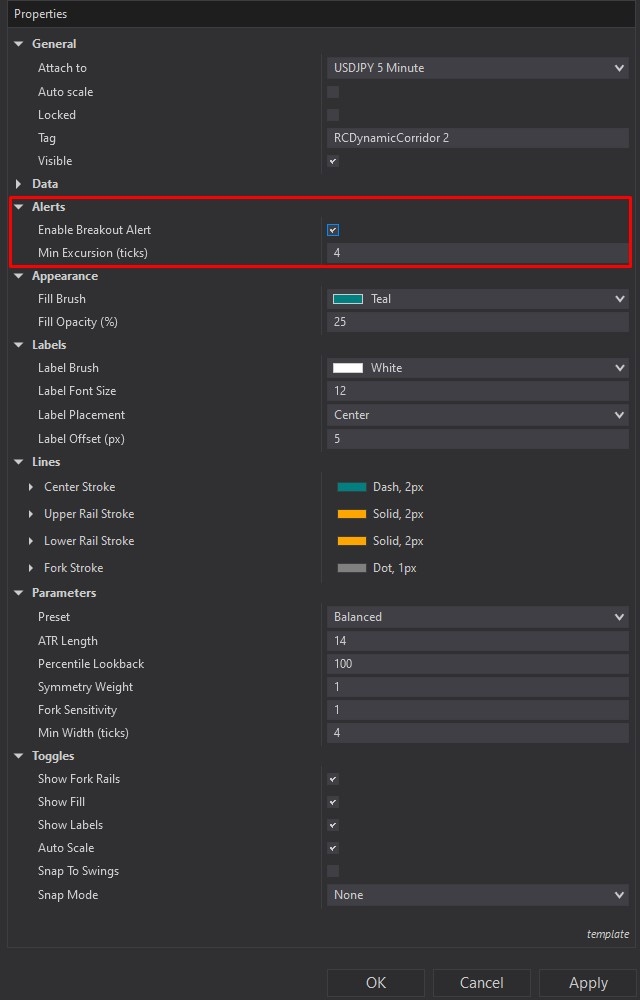
The Dynamic Corridor features comprehensive breakout alert functionality that monitors the corridor's rails and fires notifications when price moves beyond the projected boundaries. As shown in Image 2 with a red rectangle, traders can configure the minimum excursion in ticks to prevent false alarms from minor price touches or market noise. The tool includes smart labelling that displays crucial information at a glance: slope (showing trend direction in ticks per bar), width (measuring the full distance between rails in ticks), and volatility regime classification (calm, normal, or hot based on ATR analysis).
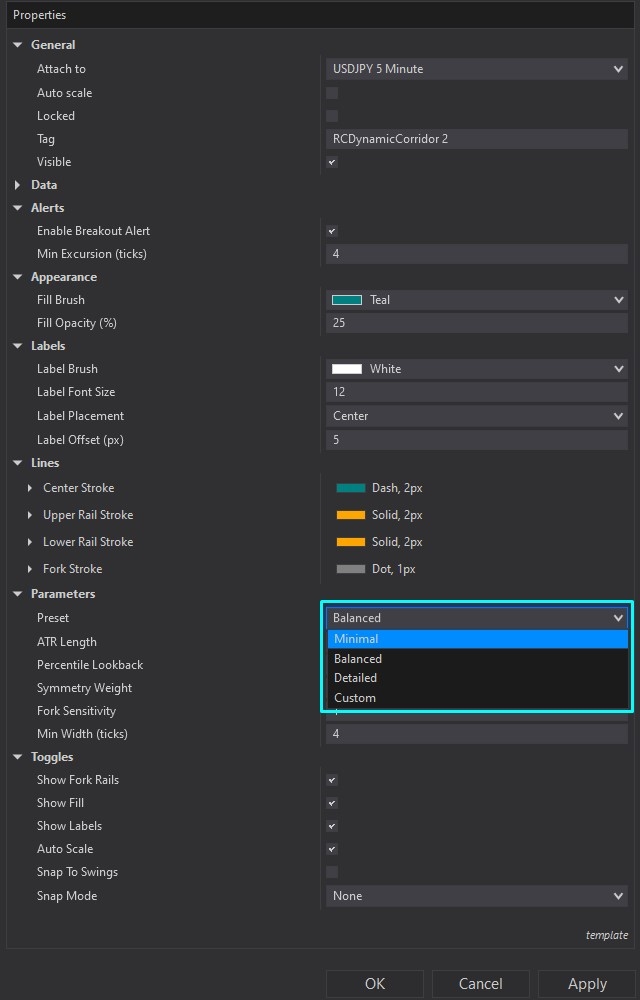
Image 3 showcases the extensive customisation options available through the settings panel inside the light blue rectangle. The tool offers four preset configurations - Minimal (simple ATR-only), Balanced (default blend of ATR, percentile true range, and symmetry), Detailed (enhanced sensitivity), and Custom (full manual control). Advanced parameters include ATR length, percentile lookback period, symmetry weight, fork sensitivity, and minimum width settings to ensure visibility even in calm markets.
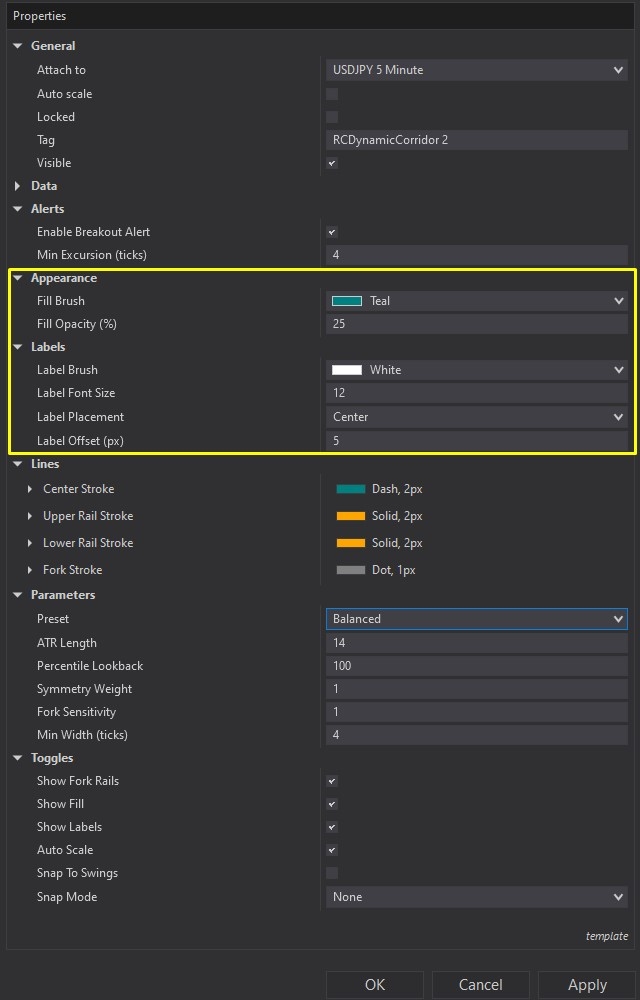
The appearance settings provide complete visual customisation control, as demonstrated in Image 4 with the yellow rectangle. Traders can adjust fill brush colours, opacity levels, label fonts and placement, and line stroke styles for all corridor components. The tool includes intelligent features like auto-scaling (automatically adjusts chart scale to keep the entire corridor visible) and snap-to-swings functionality (anchors automatically align to swing highs, lows, or closes).
The Dynamic Corridor works seamlessly across all timeframes and market instruments supported by NinjaTrader 8. It's particularly effective for swing trading, trend-following strategies, and volatility-based analysis. The tool comes with complete NinjaScript source code, allowing traders to modify, expand, or integrate it into their own custom strategies without restrictions.
If you have any questions about the Dynamic Corridor's functionality, installation process, or advanced settings configuration, please refer to the video tutorial above for a complete step-by-step guide on setup, customisation, and practical trading applications.
Secure payment via PayPal
By downloading, you agree with our Terms & Conditions

