Click to play video

Tutorial with Source Code
Please Register for FREE account or Login to purchase this source code.
By downloading, you agree with our Terms & Conditions
The Fade Gauge is a sophisticated NinjaTrader reversal indicator. It specialises in identifying high-probability mean reversion trading setups by measuring real-time price deviation from moving averages and combining this with session-specific probability analysis, automatically painting visual signals when price becomes overextended and statistically likely to snap back. When you purchase the Fade Gauge from Rize Capital, you receive the complete NinjaScript source code, providing total freedom to modify the deviation thresholds, customise the time bin parameters and bar colours, or integrate the indicator into automated strategies with no restrictions whatsoever. For a detailed overview, check out our video tutorial above.
See how the Fade Gauge - NinjaTrader 8 Indicator looks in action with these screenshots
Learn how to use the Fade Gauge - NinjaTrader 8 Indicator
The Fade Gauge Indicator for NinjaTrader 8 specialises in detecting high-probability mean reversion opportunities by measuring real-time price deviation from exponential moving averages and combining this with session-specific probability analysis that adapts to time-of-day market behaviour. The core functionality revolves around a dynamic gauge value combined with colour-coded bar painting that provides instant visual confirmation of overextended price conditions.
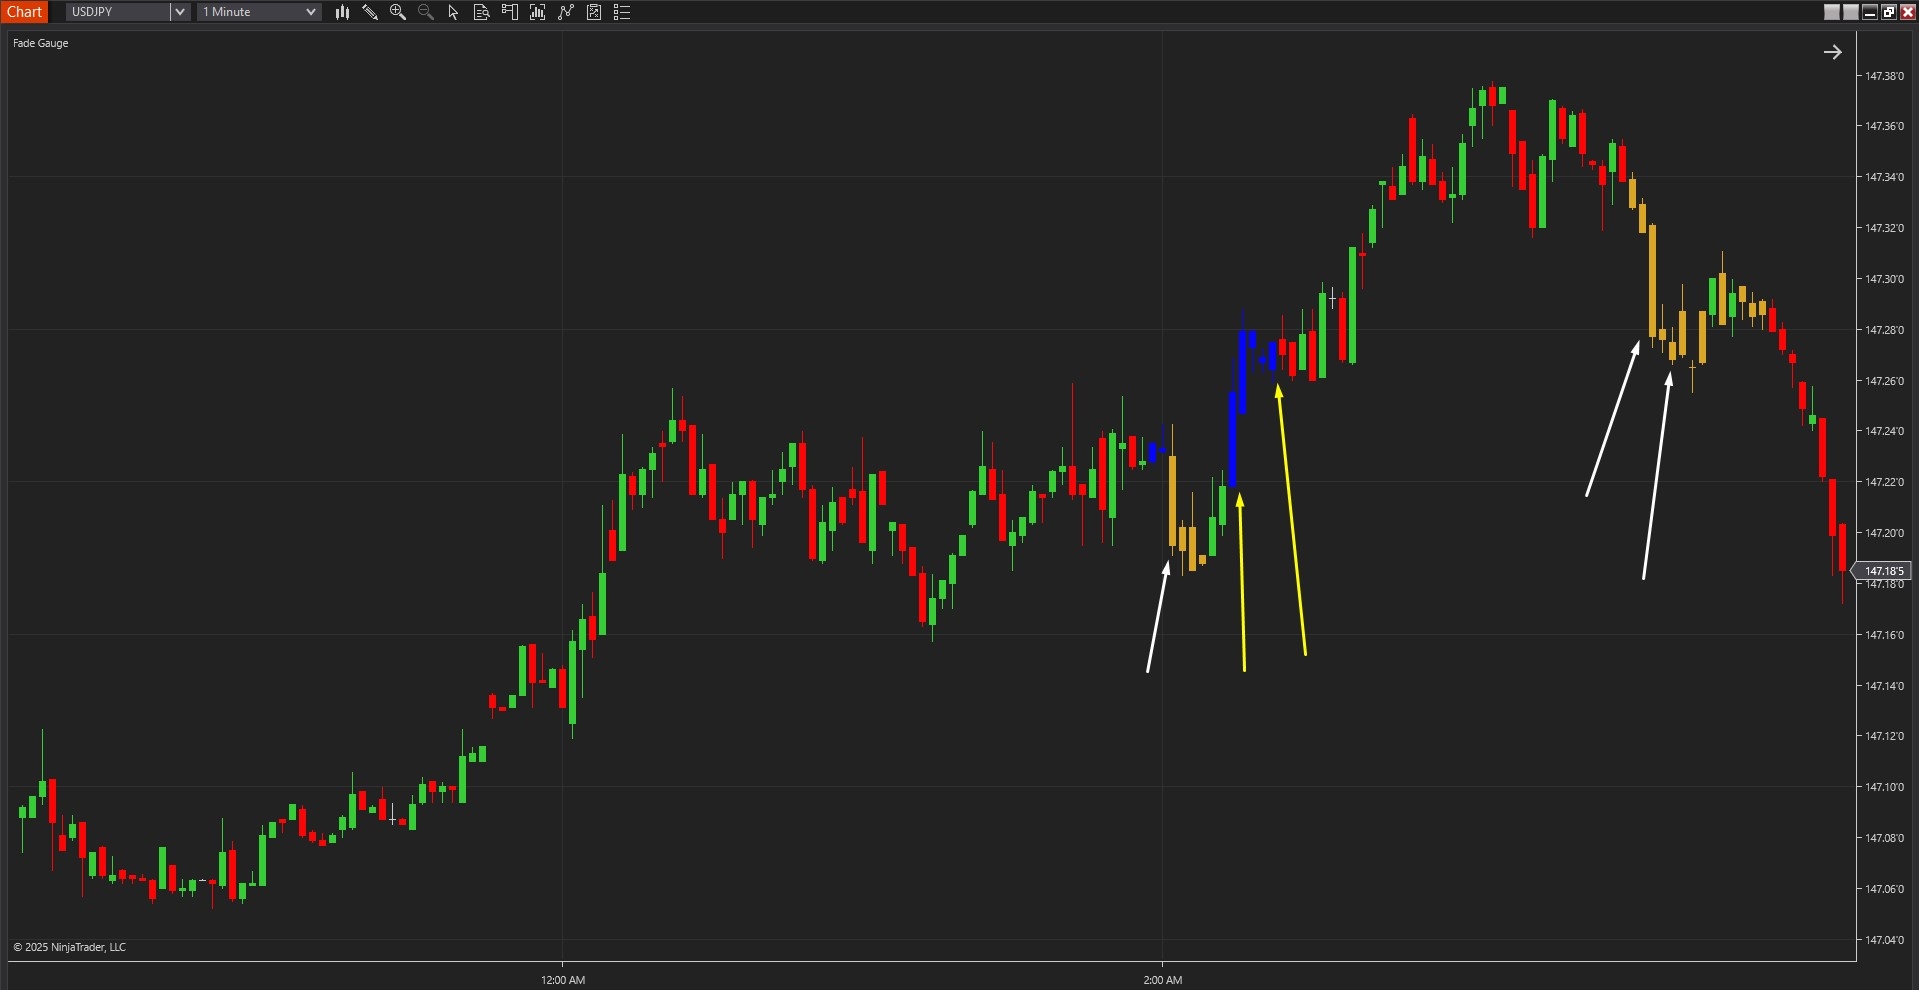
As shown in Image 1 (pointed by yellow arrows), blue painted bars represent potential long setups—areas where price has stretched significantly below the EMA and the gauge signals a high-probability reversal to the upside. Golden rod painted bars represent potential short setups (pointed by white arrows)—areas where price has extended well above the EMA and may be ready to reverse downward as it snaps back to the mean.
The indicator goes beyond simple deviation measurement by incorporating time bin probability analysis. The gauge constantly updates as the market moves, tracking not only how far price has deviated but also analysing historical success rates for fade trades during specific time windows throughout the session. This statistical layer ensures that signals only appear when both price stretch and time-based probabilities align in your favour, eliminating low-quality setups and keeping traders focused on the highest-conviction reversal opportunities.
The visual framework automatically filters noise by requiring minimum tick deviation thresholds before triggering signals. Blue bars only appear when price drops sufficiently below the EMA and the probability model confirms favourable conditions for upward mean reversion. Golden rod bars only fire when price climbs well above the EMA with statistical backing for downward reversion. This helps traders avoid overtrading and reduces hesitation by highlighting only the most actionable setups.
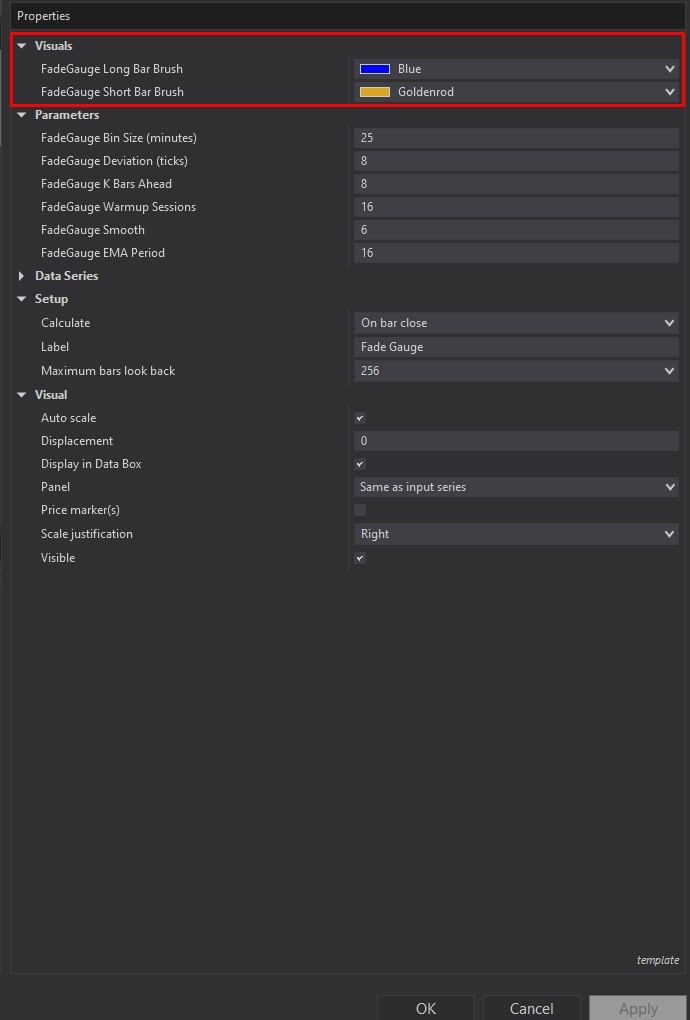
Fade Gauge offers comprehensive customisation through its settings panel. The Visuals section, highlighted by a red rectangle in Image 2, allows full control over signal appearance, including Fade Gauge Long Bar Brush (default blue) for bullish reversal signals highlighting potential long entries when price is stretched to the downside, and Fade Gauge Short Bar Brush (default golden rod) for bearish reversal signals making it easy to spot possible short entries when price is extended above the EMA. These colour settings ensure signals remain clearly visible across different chart themes and trading environments.
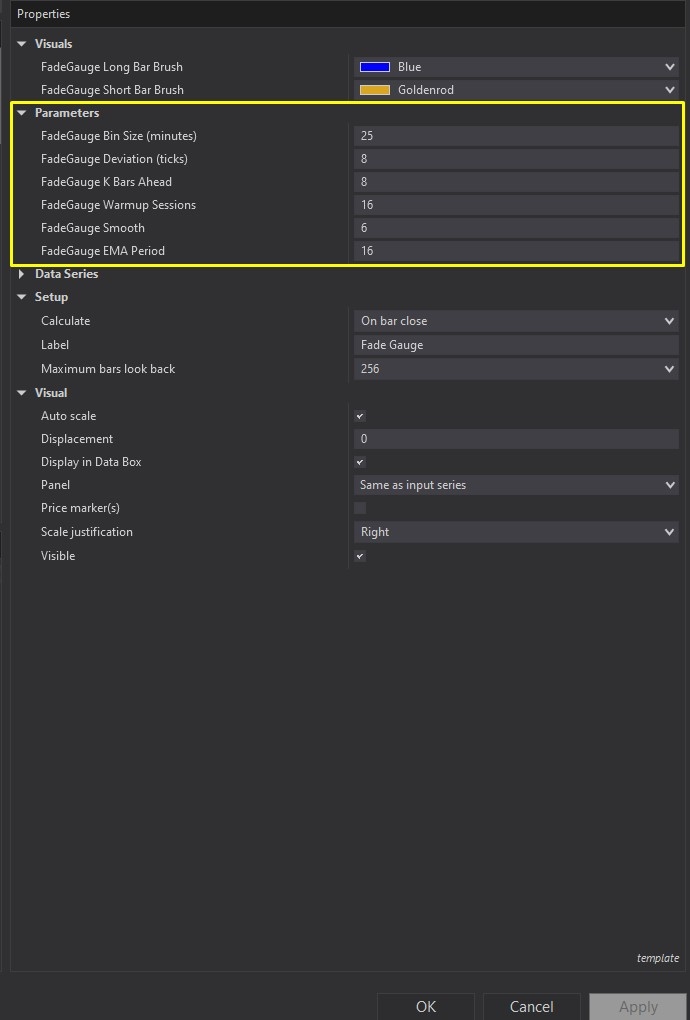
The Parameters configuration options are highlighted by a yellow rectangle in Image 3. The Fade Gauge Bin Size Minutes parameter (default 25 minutes) breaks the session into discrete time bins, with each bin tracking historical fade success rates for that specific time window, creating a dynamic probability model that adapts throughout the trading day. The Fade Gauge Deviation Ticks setting (default 8 ticks) establishes the minimum number of ticks price must move away from the EMA to trigger a potential fade setup—think of this as the stretch threshold that determines when price has truly become overextended.
The Fade Gauge K Bars Ahead parameter (default 8 bars) controls the lookback window used to evaluate whether previous fade signals were successful, checking what happened K bars after each signal to continuously refine the statistical logic. The Fade Gauge Warm-Up Sessions setting (default 16 sessions) determines how many past sessions the indicator analyses to build its probability models, providing a good balance between sufficient data depth and computational speed.
The Parameters section has additional fine-tuning controls. The Fade Gauge Smooth parameter (default 6) applies smoothing to the gauge value using an internal EMA calculation—higher values produce a smoother, less reactive gauge, whilst lower values increase sensitivity to rapid price movements. The Fade Gauge EMA Period setting (default 16) controls the fast exponential moving average used to measure price stretch, serving as the baseline reference point for determining when price has extended far enough to consider a fade opportunity.
These parameters allow precise calibration, whether you're scalping on 1-minute charts requiring tighter deviation thresholds and shorter bin sizes, or swing trading on 5-minute or 15-minute timeframes where larger deviations and longer probability windows become more appropriate. The indicator's statistical engine continuously learns from market behaviour, updating probability estimates as each session progresses and new data becomes available.
With full NinjaScript source code included, advanced users can modify the indicator. If you have questions about the source code, refer to the comprehensive video tutorial above.
Secure payment via PayPal
By downloading, you agree with our Terms & Conditions

