Mega Sale 50% OFF All Products & Memberships | Limited time onlyUse code RCSALE50ALL
Click to play video

Tutorial with Source Code
Please Register for FREE account or Login to purchase this source code.
By downloading, you agree with our Terms & Conditions
The Flow Shift Trajectories is a professional-grade visual NinjaTrader 8 drawing tool developed that identifies major turning points and trend shifts by tracking changes in price slope using a built-in regression model. When trend direction changes or momentum increases sharply, the tool automatically places an inflection marker at the exact candle where the shift occurs and projects a fan of angled lines showing the new trajectory, with the thickest line representing the dominant slope direction and thinner rays displaying supporting angles between previous and current trends. When you purchase the Flow Shift Trajectories from Rize Capital, you receive the complete NinjaScript source code. For a detailed overview, check out our video tutorial above.
See how the Flow Shift Trajectories - NinjaTrader 8 Drawing Tool looks in action with these screenshots
Learn how to use the Flow Shift Trajectories - NinjaTrader 8 Drawing Tool
The Flow Shift Trajectories Drawing Tool for NinjaTrader 8 revolutionises trend analysis by automatically identifying major turning points and momentum shifts through sophisticated slope tracking algorithms. The core functionality centres around a built-in regression model that continuously monitors how price slope evolves over time, detecting meaningful inflections where trend direction changes or momentum accelerates sharply.
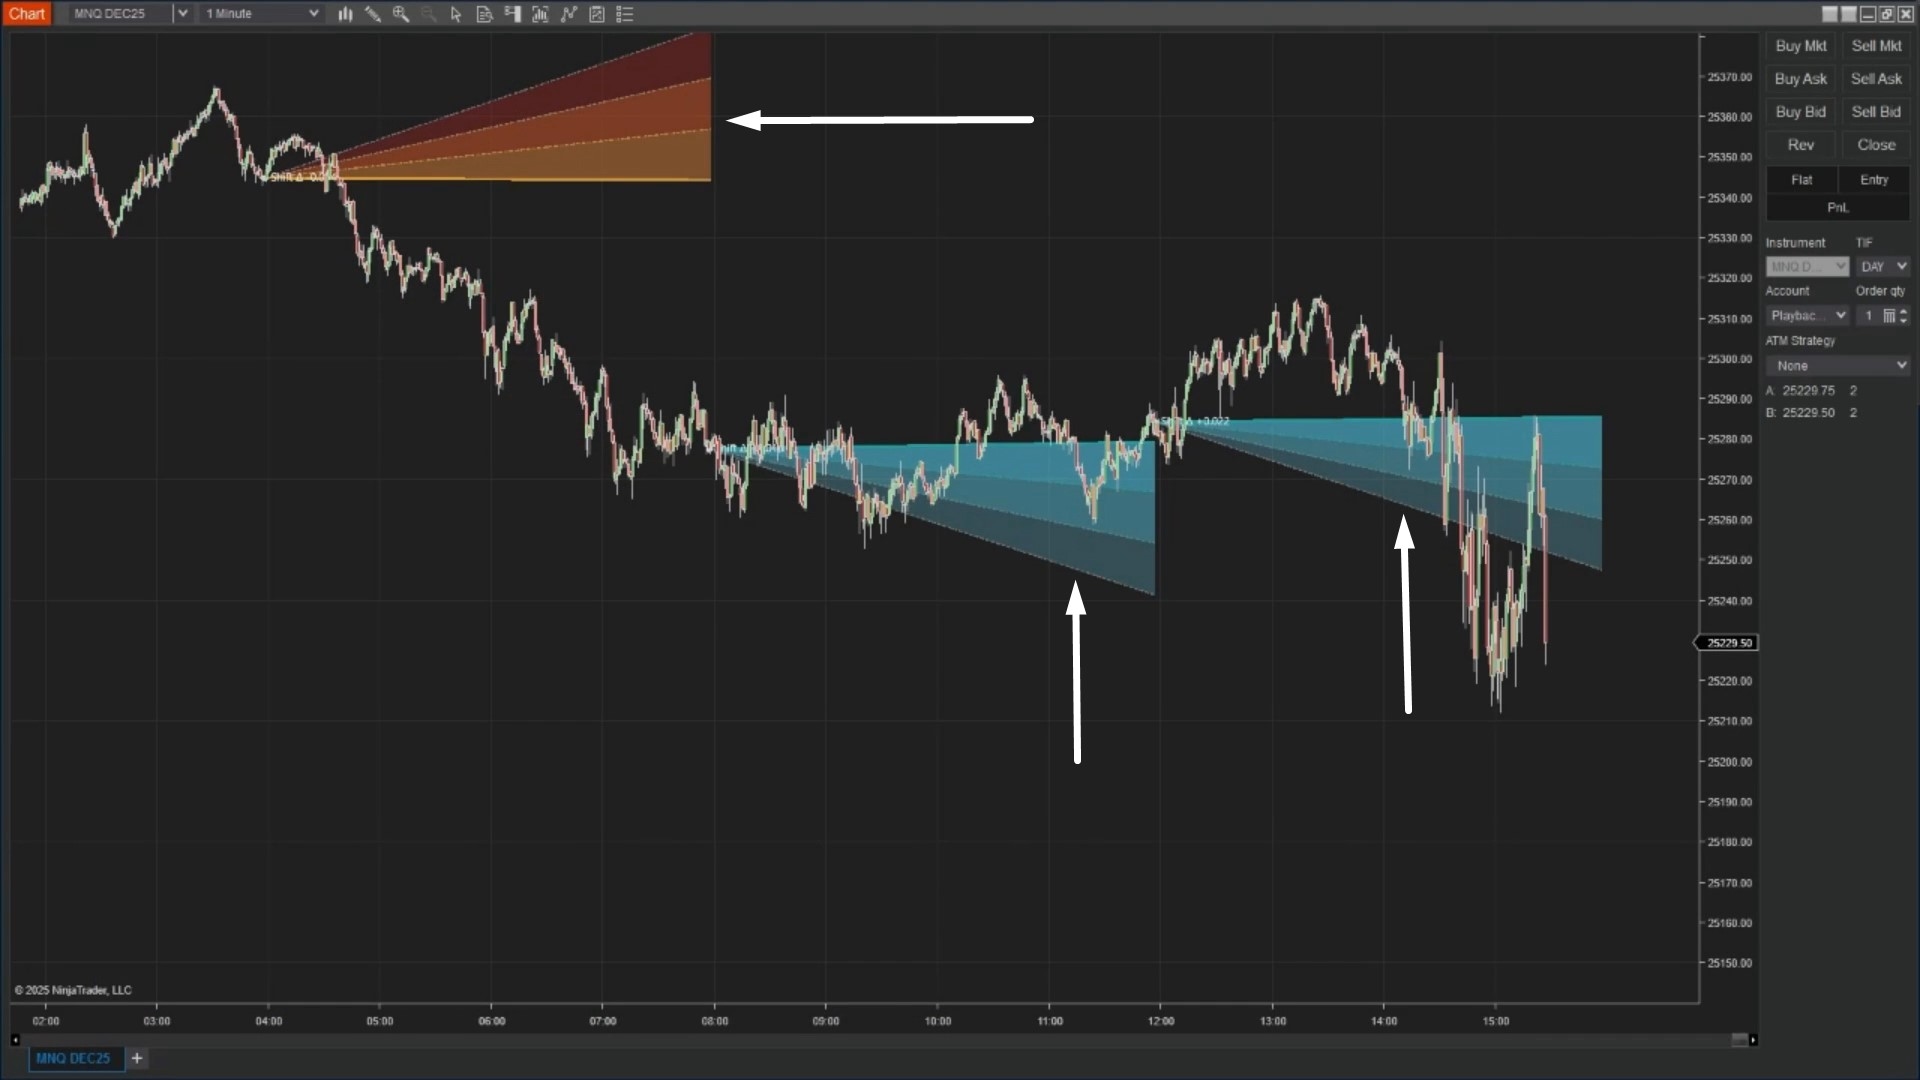
The tool operates through a simple two-anchor placement system—traders click once to set Anchor A (analysis window start) and again to place Anchor B (analysis window end). Once activated, the regression model immediately processes price behaviour within this window, identifying the precise candle where slope momentum shifted significantly. At this critical inflection point, a small marker dot appears (pointed by white arrows), accompanied by a compact label displaying the slope delta value that quantifies the strength of the directional change. This inflection marker provides exact visual confirmation of where market character transformed, eliminating guesswork about trend birth points or reversal locations.
The tool transforms abstract slope changes into actionable visual structure through intelligent fan projection. In Image 1 (pointed by white arrows), radiating from each inflection marker, a set of angled trajectory lines fans outward, visualising the new trend direction and momentum profile.
The thickest line represents the dominant trajectory—the current slope direction the market is most likely to follow based on regression analysis. This primary ray serves as the key structural guide for entries, exits, and position management. The thinner supporting rays display intermediate angles between the previous trend slope and the new trajectory, creating a visual envelope that helps traders understand the transition zone and potential price paths. When fan rays slope upward, they indicate a bullish shift where momentum favours long positions—ideal for entering early uptrends, riding continuation moves, or re-entering on pullbacks to the fan structure. When rays slope downward, they signal a bearish shift with sellers gaining control—perfect for identifying short setups, confirming breakdowns, or avoiding long trades during weakness. The slope delta label provides quantitative confirmation, with larger values indicating stronger, more reliable shifts whilst smaller values suggest tentative or weak momentum changes.
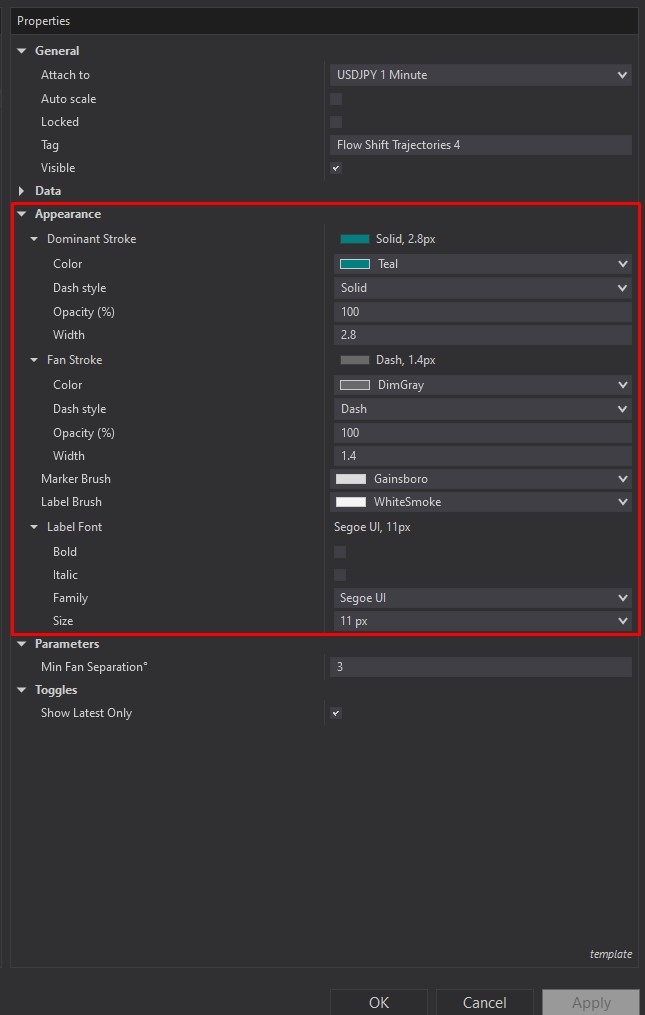
Flow Shift Trajectories offers comprehensive customisation through its properties panel. The Appearance section, highlighted by a red rectangle in Image 2, provides complete visual control over fan display. Dominant Stroke defines the appearance of the main trajectory ray representing current slope—default settings use a solid line at 2.8 pixels width, creating the strongest visual cue for active market direction. Traders can adjust colour to match their chart theme (bright colours for dark backgrounds, muted tones for light themes), modify line style (solid, dashed, dotted) for visual distinction, and change thickness for prominence or subtlety depending on charting preferences. Fan Stroke controls how supporting rays appear—default configuration uses lighter, dashed lines that show slope transition without overwhelming the chart. These settings allow traders to make supporting structure more prominent for detailed analysis or reduce visibility for cleaner, minimalist displays focused solely on the dominant trajectory.
You will also find additional appearance customisation options. Marker Brush determines the colour of the small dot placed at each inflection point where slope shifts occurred—default Gainsborough (soft grey) provides subtle marking that doesn't distract from price action, but traders can select high-contrast colours like cyan, magenta, or lime for immediate visual recognition during fast markets. Label Brush defines the text colour for the slope delta value displayed near each marker—this quantitative information helps traders assess shift strength at a glance, with customisable colouring ensuring readability against various chart backgrounds. Label Font allows complete typography control, defaulting to Segoe UI at 11 pixels for clean readability on standard monitors. Traders can increase font size for larger displays or distance viewing, change font family for personal preference, or adjust weight (bold, regular) for emphasis. These granular appearance controls ensure Flow Shift Trajectories integrates seamlessly with any charting setup whilst maintaining clear, professional visual communication.
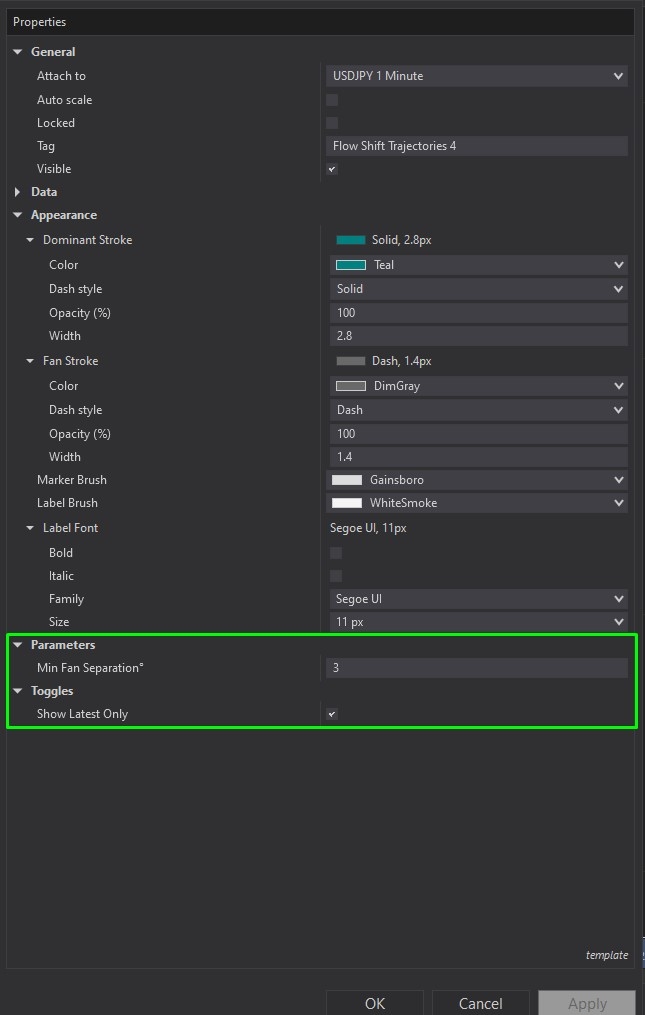
The Parameters and Toggles sections, illustrated in Image 3 (highlighted by a green rectangle), control the mathematical behaviour and display mode. Minimum Fan Separation defines the minimum angle between adjacent fan rays, measured in degrees with a default of 3 degrees. This spacing parameter ensures fans remain visually clean and readable, particularly during low-volatility conditions where actual slope differences might be minimal. Setting this value to zero enables natural interpolation, allowing rays to follow exact calculated slope differences without enforced spacing—useful for precise mathematical representation but potentially creating cluttered fans during tight consolidations. Increasing the value (e.g., 5-7 degrees) produces wider ray spacing, ideal for traders who prefer highly structured, easily distinguishable trajectory guides or who work with busy charts containing multiple indicators. This setting proves especially valuable for intraday traders monitoring multiple timeframes simultaneously, where visual clarity takes priority over mathematical precision. The Show Latest Only toggle represents a powerful focus tool—when enabled, the chart displays only the most recent slope shift and its associated fan projection, keeping visual attention concentrated on current market context without distraction from historical shifts. This mode suits live trading sessions perfectly, allowing rapid decision-making based solely on active structure. When disabled, all historical shift fans remain visible throughout the analysis window, providing comprehensive retrospective view ideal for backtesting, pattern study, or understanding how multiple shifts interacted during complex market phases. Swing traders and analysts often prefer this mode for thorough post-session review.
With full NinjaScript source code included, advanced users can customise the tool—all without any restrictions whatsoever. If you have questions about Flow Shift Trajectories, refer to the comprehensive video tutorial above for detailed guidance.
Secure payment via PayPal
By downloading, you agree with our Terms & Conditions

