Click to play video
Tutorial with Source Code
Please Register for FREE account or Login to purchase this source code.
By downloading, you agree with our Terms & Conditions
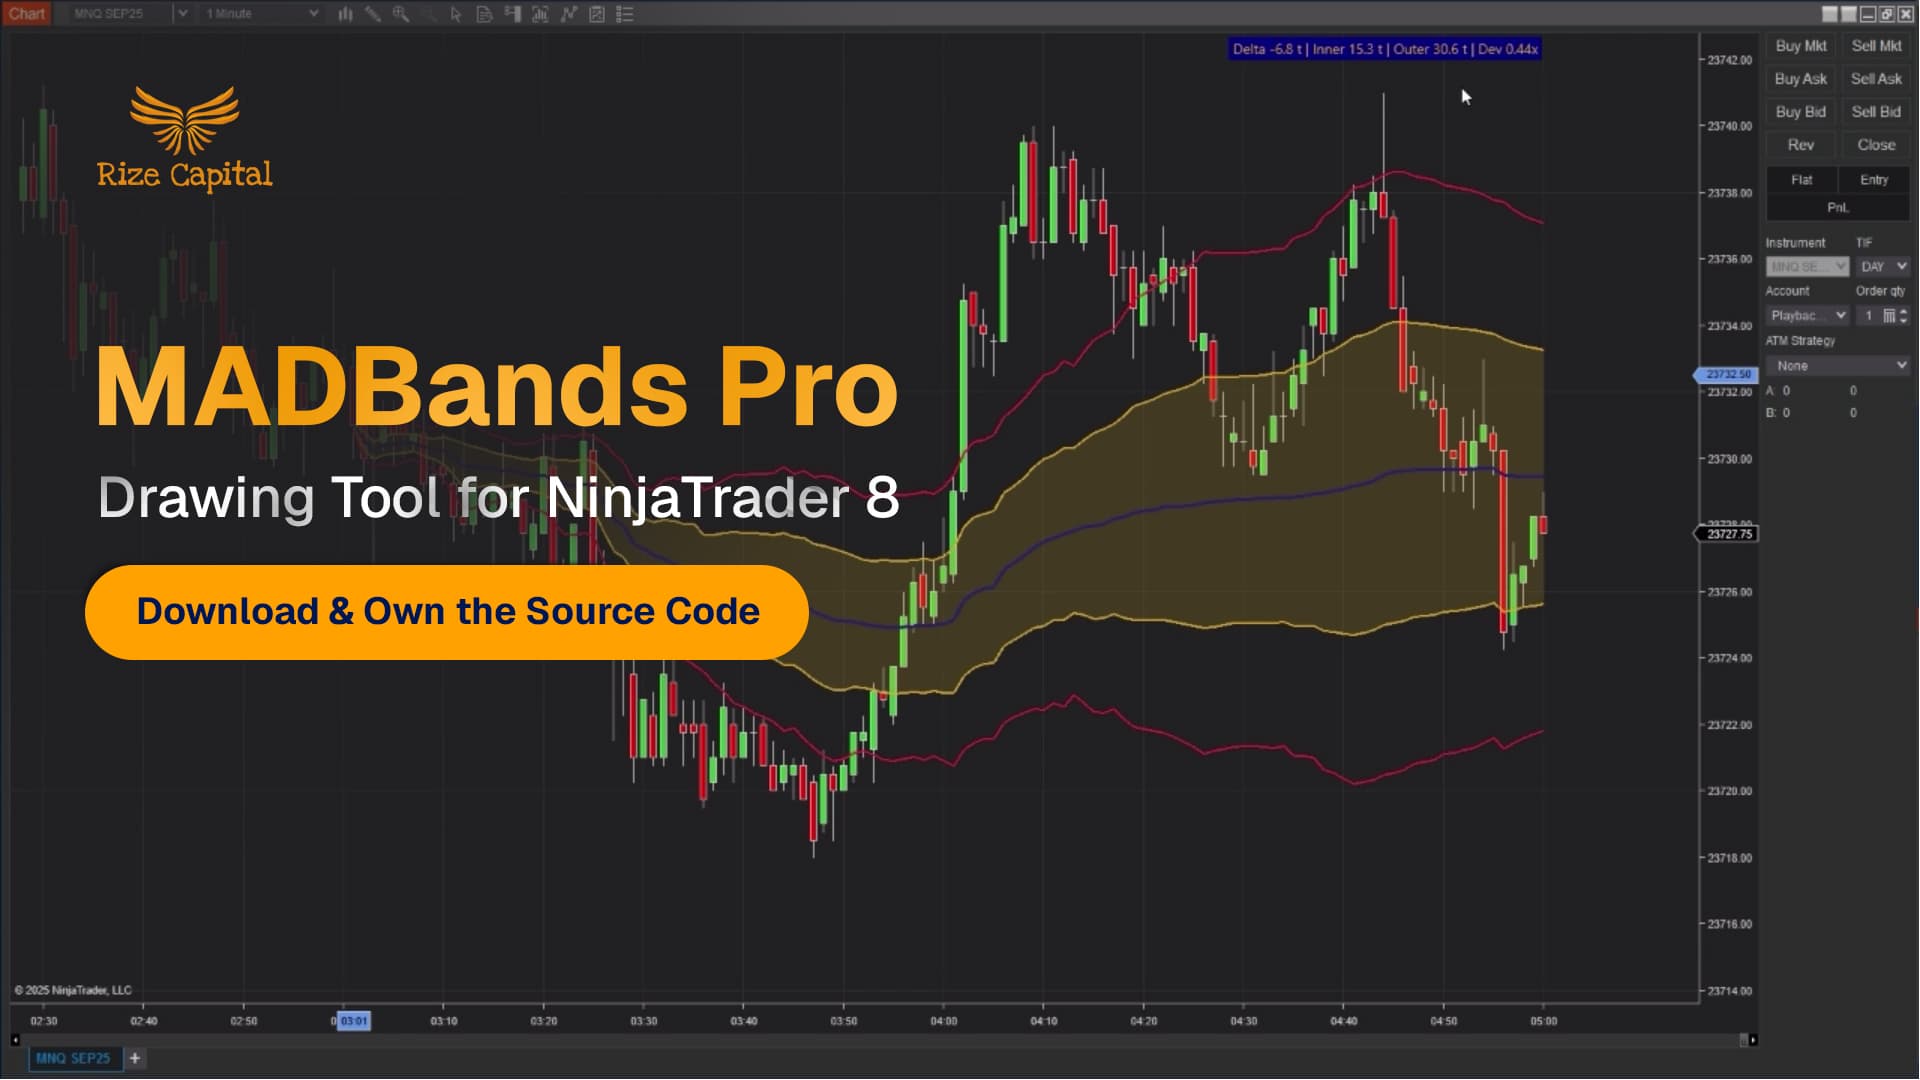
This pro-level premium NinjaTrader drawing tool is engineered to provide traders with a significant competitive advantage in day trading, swing trading, and position trading. It delivers intelligent market structure analysis through automatic equilibrium zone calculation based on volume-weighted median absolute deviation (MAD). This adaptive drawing tool is developed by Rize Capital, and it comes with complete NinjaScript source code ownership. Watch the comprehensive video tutorial to learn how this dynamic drawing tool works.
See how the MADBands Pro - Drawing Tool for NinjaTrader 8 looks in action with these screenshots
Learn how to use the MADBands Pro - Drawing Tool for NinjaTrader 8
The MADBands Pro is a professional drawing tool for NinjaTrader 8 and 8.1 that automatically calculates and plots equilibrium zones based on volume-weighted median absolute deviation (MAD). Created and presented to you by Rize Capital, this sophisticated tool instantly visualises your chart's fair value area and statistical deviation bands, providing traders with precision equilibrium analysis capabilities for mean reversion strategies, breakout trading, and volatility-based decision making.
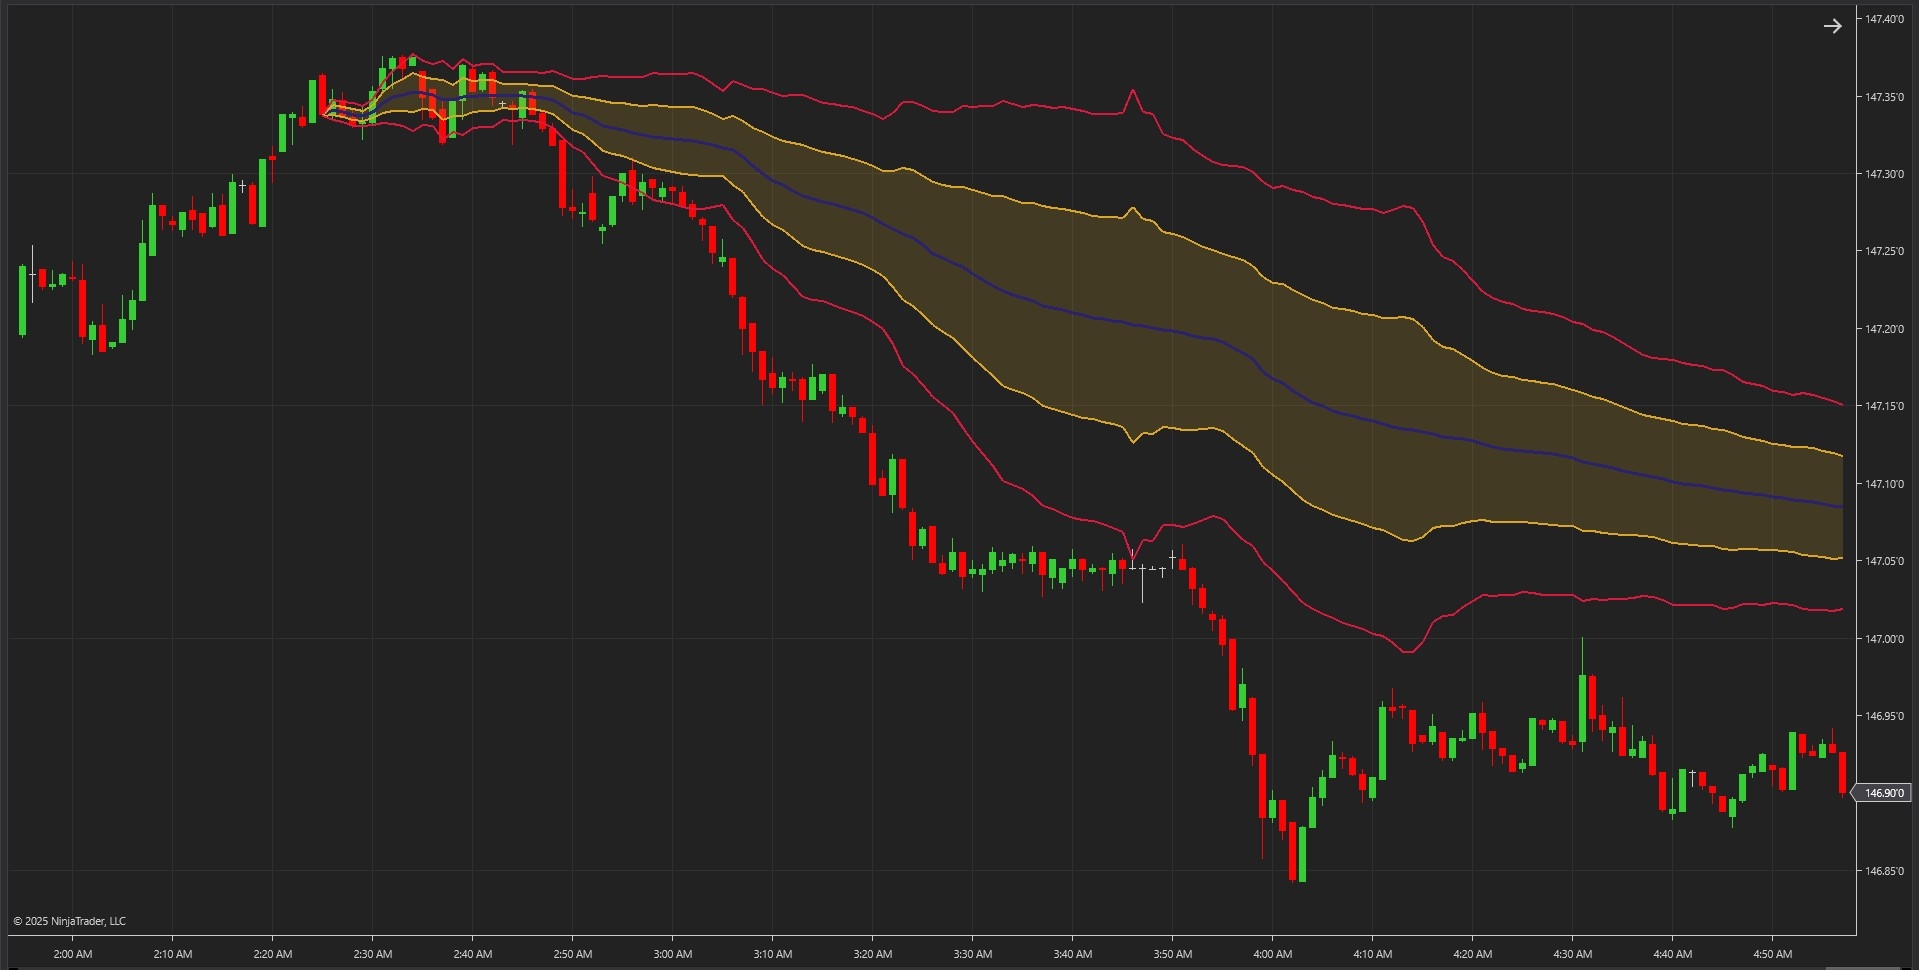
As shown in Image 1, the tool automatically identifies the core equilibrium line (displayed in blue by default), where price is statistically balanced, inner bands (displayed in goldenrod by default) representing normal volatility and healthy pullbacks, and outer bands (displayed in crimson red by default) marking extreme deviation zones where price is overstretched. The area between inner bands is filled with subtle goldenrod shading to clearly visualise the equilibrium zone. The bands dynamically expand during trending markets and contract during consolidation, adapting in real-time to current market conditions.
The MADBands Pro features comprehensive real-time alert functionality that monitors price action and fires notifications when price crosses outer deviation bands. When price breaches beyond the statistically extreme zones, traders receive instant visual and audio alerts signalling potential volatility expansion or exhaustion reversals. This gives traders immediate awareness of high-probability opportunities the moment they occur, whether monitoring one chart or managing multiple markets simultaneously.
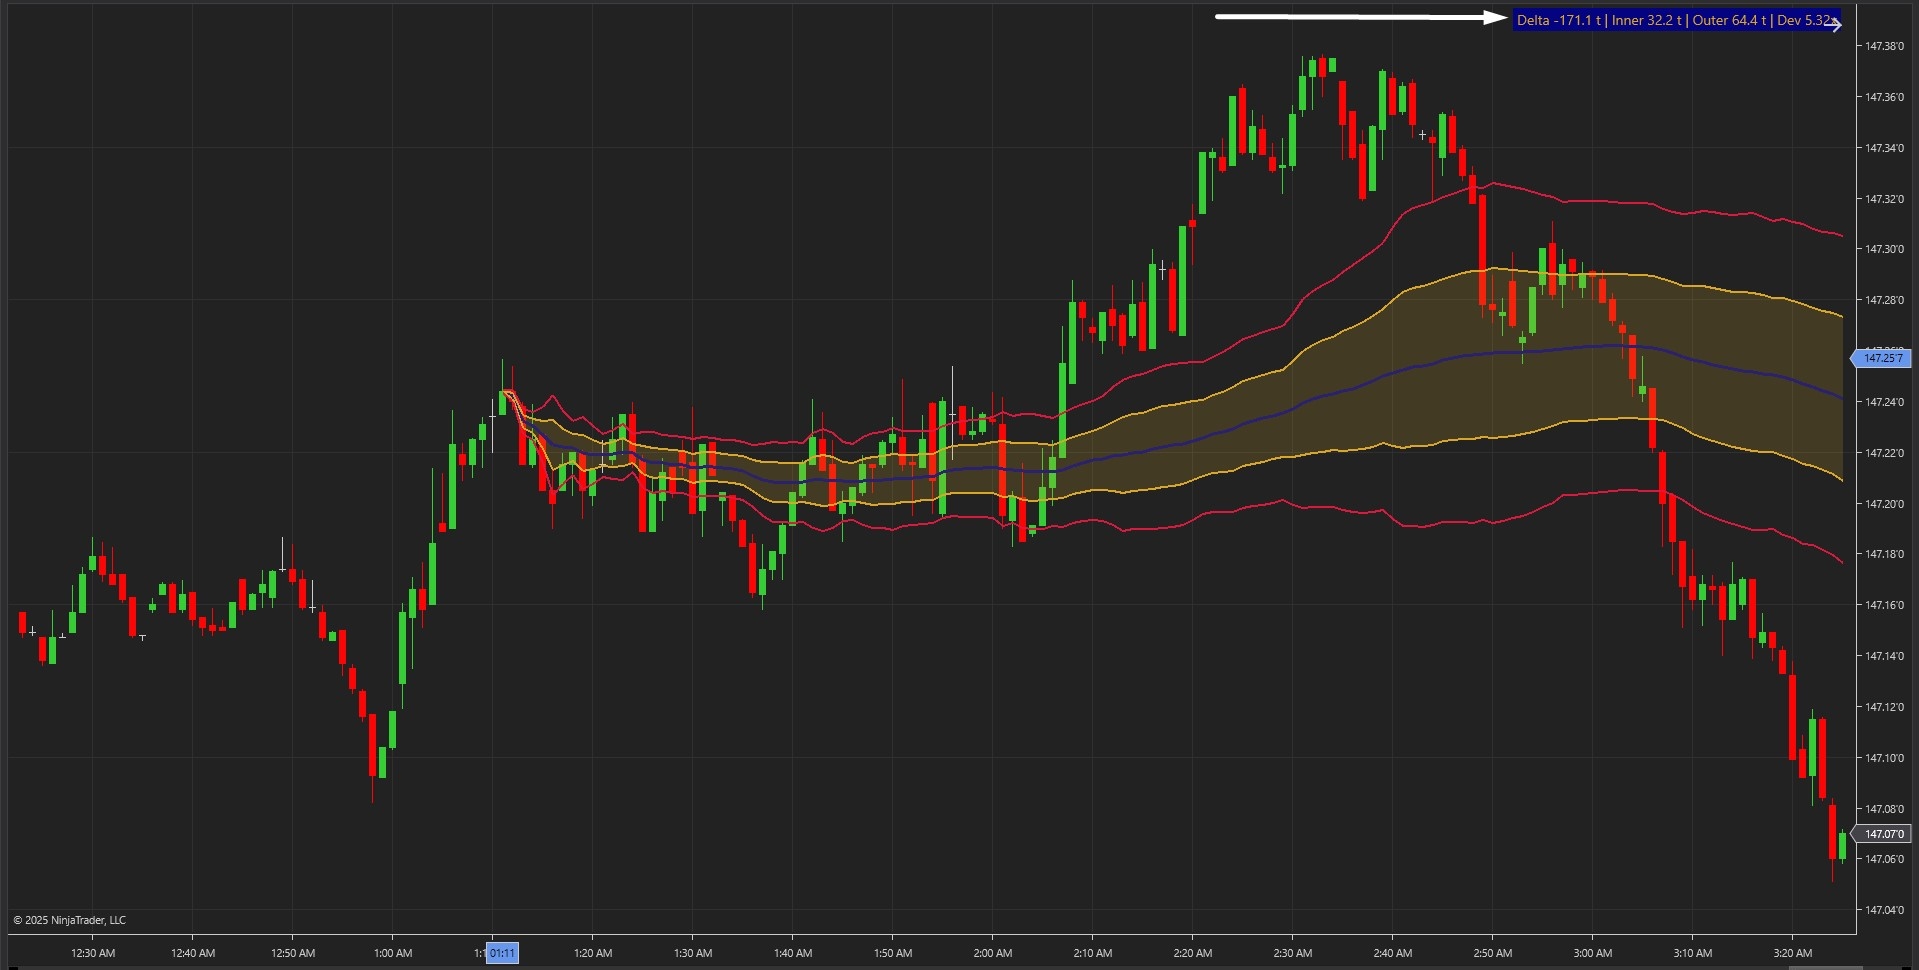
Image 2 showcases the live analytics label system (pointed by a white arrow). The label displays critical real-time metrics, including current distance from equilibrium in ticks, inner band width, outer band width, and the current deviation multiplier, showing how many times MAD the price has moved from fair value. When the label shows less than 1x MAD, the market is balanced. Between 1x and 2x MAD indicates normal volatility, ideal for active trading. Beyond 2x MAD signals statistically overstretched conditions where high-probability reversals often emerge.
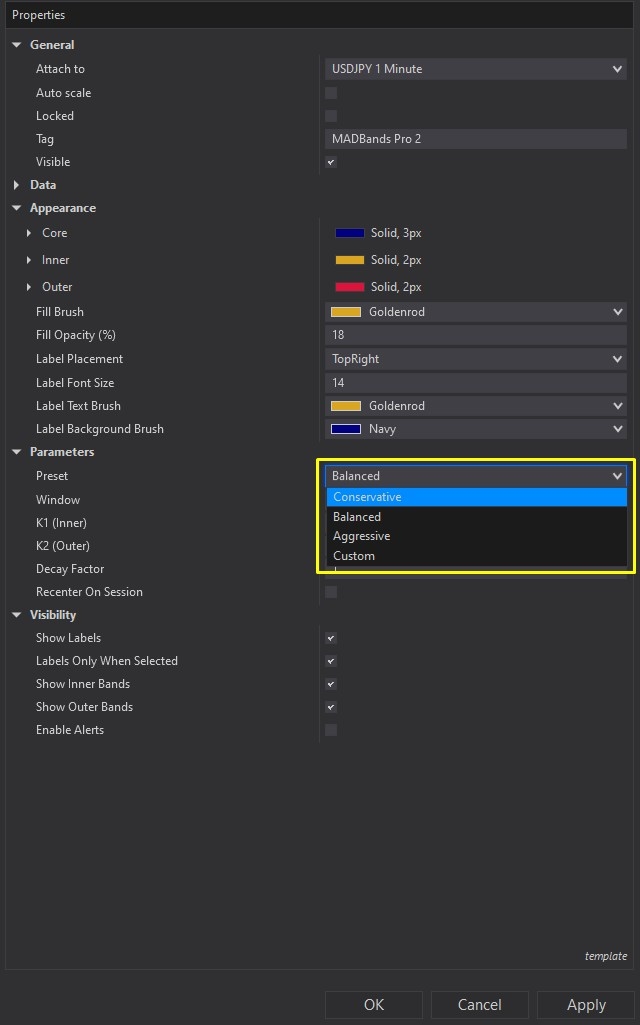
The parameter settings provide complete calculation control, as demonstrated in Image 3 with the yellow rectangle. Traders can select from three optimised presets: Conservative (wider bands for slower markets and fewer signals), Balanced (default setting providing perfect responsiveness and stability), or Aggressive (tighter bands for fast-reacting day traders wanting earlier signals). Custom mode unlocks manual tuning of the lookback window (default 150 bars defining calculation period), K1 inner multiplier (default 1.0), K2 outer multiplier (default 2.0), decay factor (controls band memory with lower values emphasising recent bars), and session reset options for intraday structure focus.
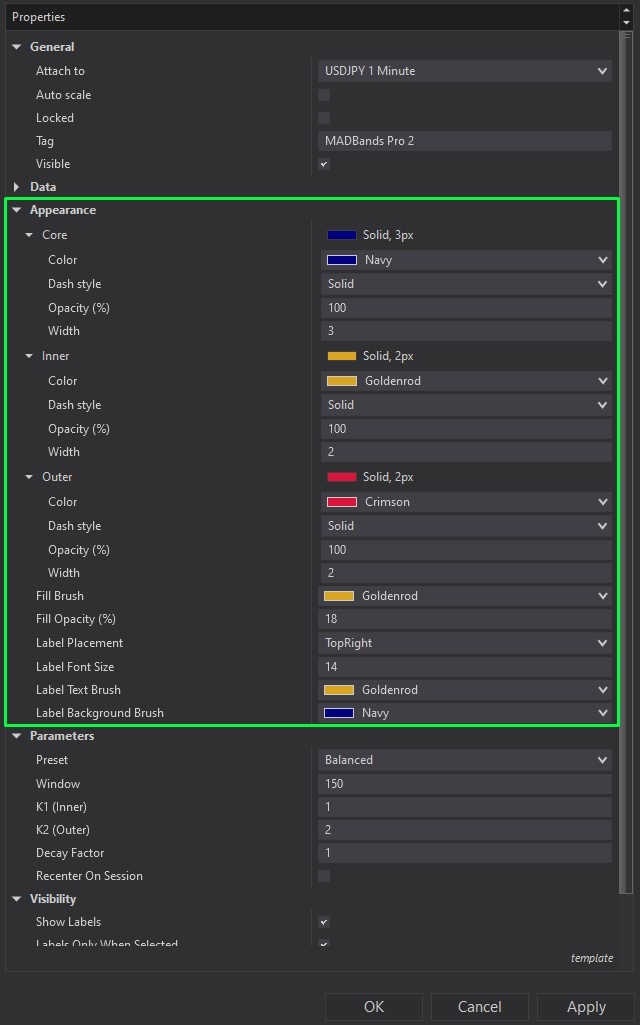
Image 4 displays the comprehensive appearance customisation options within the green rectangle. Traders can adjust core line colour (default blue), inner band colour (default goldenrod), outer band colour (default crimson), fill brush colour and opacity (default 18% for subtle visualization), label placement position (default top right), label font size (default 14), and label text/background colours (default gold text on navy background for high contrast clarity). The visibility settings allow traders to toggle label display, show labels only when selected for clean multi-chart setups, control inner and outer band visibility independently, and enable or disable real-time alerts based on trading style.
The tool comes with complete NinjaScript source code, including user-friendly documentation within the code file detailing features, functionalities, and customisation guidance. If you have any questions about MADBands Pro's functionality, installation process, equilibrium trading methodology, or advanced configuration, please refer to the video tutorial above for a complete step-by-step guide on setup, parameter optimisation.
Secure payment via PayPal
By downloading, you agree with our Terms & Conditions

