Click to play video

Tutorial with Source Code
Please Register for FREE account or Login to purchase this source code.
By downloading, you agree with our Terms & Conditions
Order Pulse is a powerful order flow indicator built for NinjaTrader 8 and 8.1. It reads real-time aggressive buying and selling pressure by classifying incoming trades based on whether they execute at the bid or ask, displaying buy pressure above zero and sell pressure below zero in a clean lower panel, with an optional net delta line showing which side dominates at any moment. When you buy Order Pulse from Rize Capital, you get the complete NinjaScript source code included—meaning you're not just getting an indicator to use, but code you actually own. You can open it, study how it works, modify the logic, change the colours, or build it into your own custom strategies without any limitations. For a detailed walkthrough, watch our video tutorial above
See how the Order Pulse - NinjaTrader 8 Indicator looks in action with these screenshots
Learn how to use the Order Pulse - NinjaTrader 8 Indicator
Order Pulse for NinjaTrader 8 helps traders understand who's actually controlling the market right now. It tracks aggressive trades—those where buyers lift the offer or sellers hit the bid—and separates them into visual columns. Buy pressure appears above the zero line, sell pressure appears below it. This simple structure lets you see at a glance whether buyers or sellers are pressing harder, and whether that pressure matches what you're seeing in price movement.
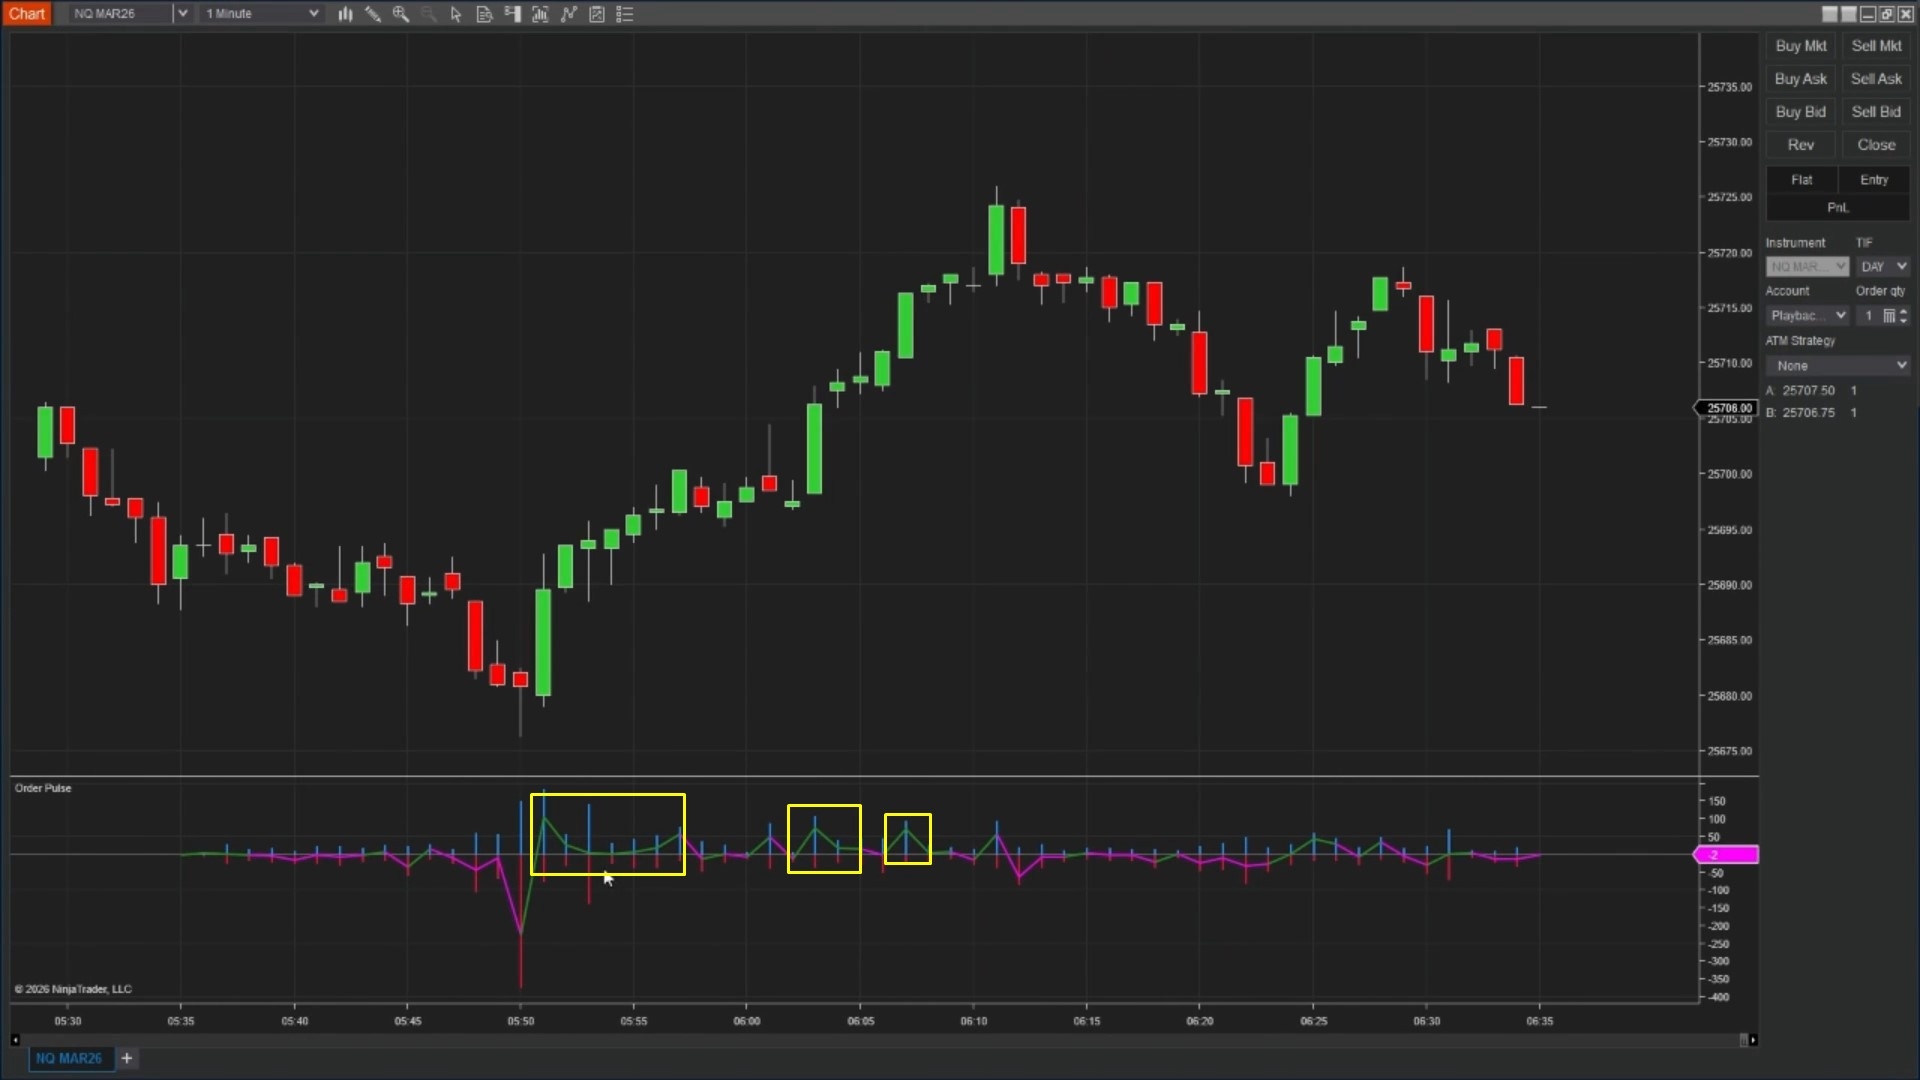
The main question most traders struggle with is: "Is this move real, or will it fail?" Order Pulse helps answer that. If price climbs and you see strong buy pressure building above zero, buyers are actively participating—the move has confirmation. If price climbs but the indicator shows weak or even negative pressure, the move might lack support and could reverse quickly. The same logic applies in reverse for downward moves.
Looking at Image 1 (highlighted by yellow boxes), you'll notice green columns building above the zero line whilst price rises. This represents aggressive buying—traders lifting the ask price, showing real demand. The taller the green columns, the more aggressive the buying becomes. When these green columns align with upward price movement, it confirms that buyers are genuinely supporting the rally rather than price just drifting higher on light volume.
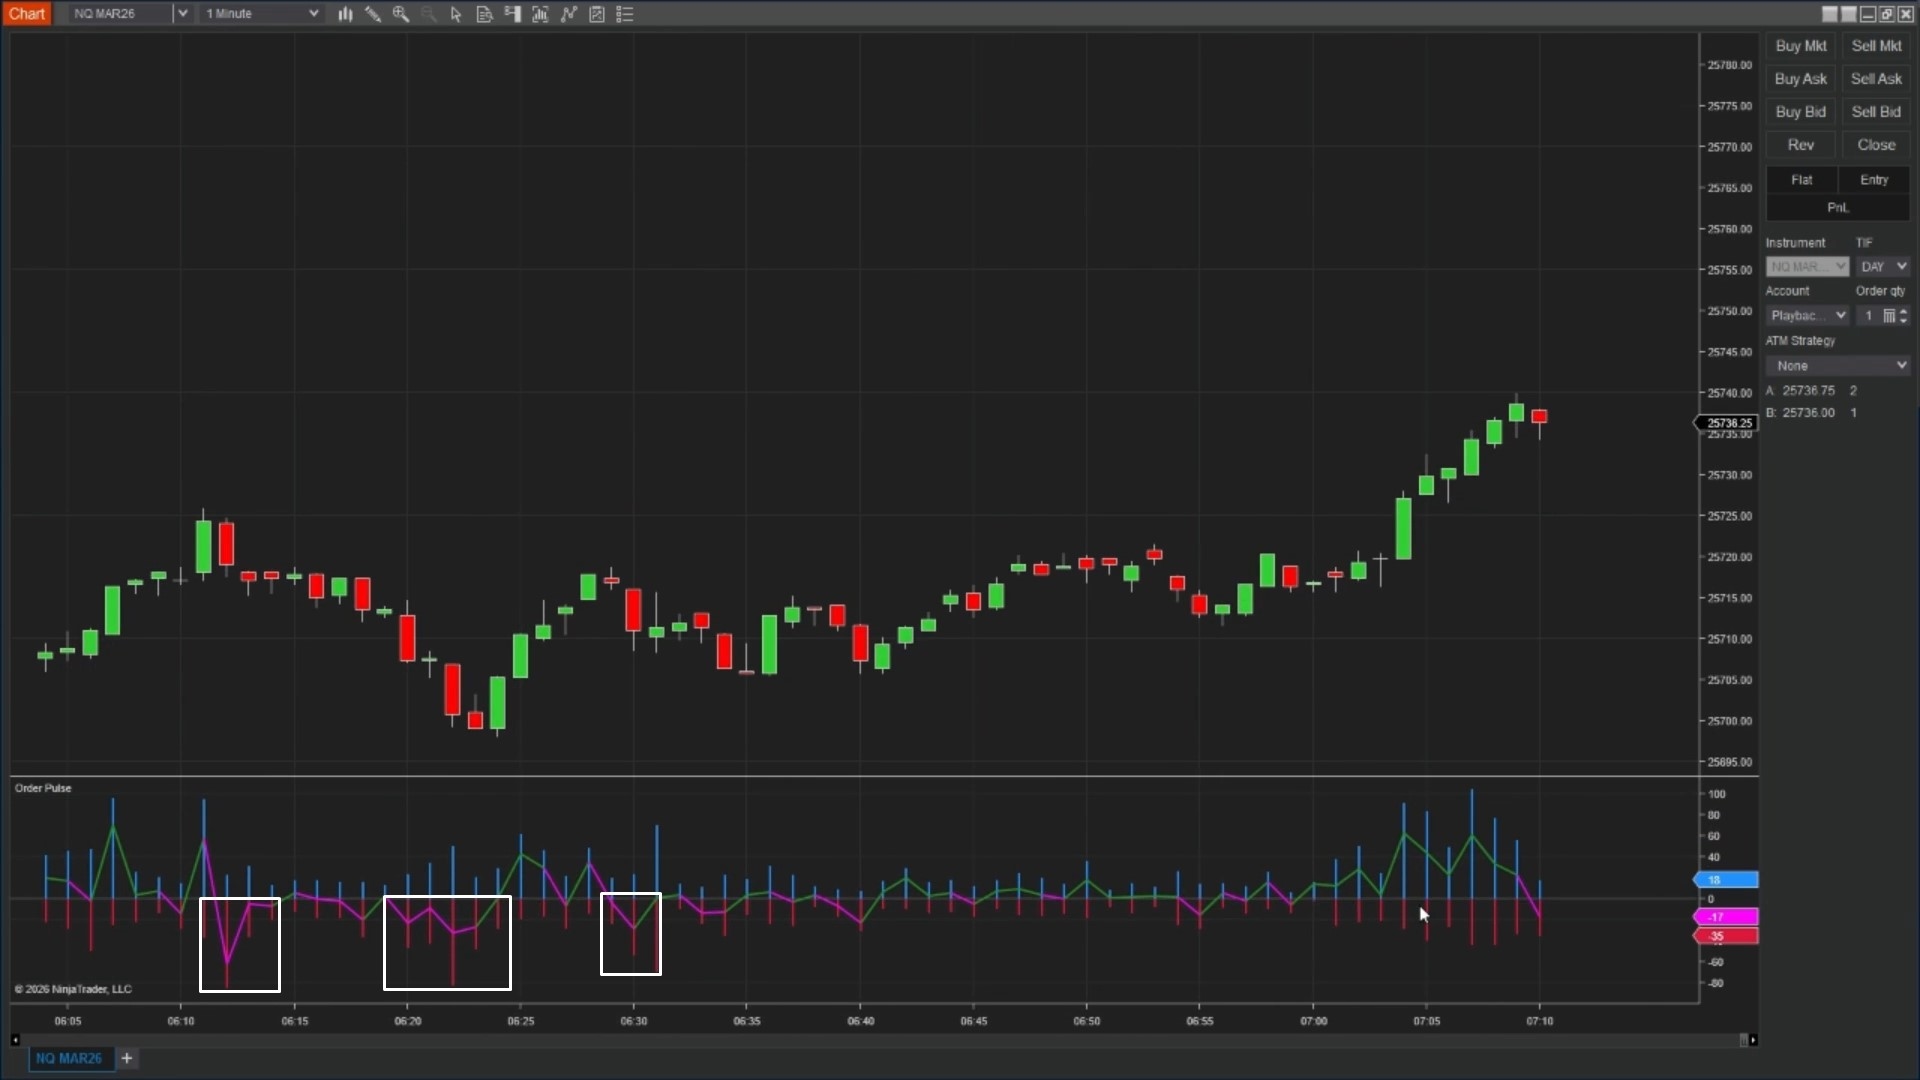
In Image 2 (marked with white boxes), red columns drop below the zero line as price falls. These represent aggressive selling—traders hitting the bid, creating supply pressure. The depth of the red columns shows how much selling pressure exists. When price drops and red columns expand, it confirms sellers are actively pushing the market lower with conviction.
The net delta line shown in Image 3 (indicated by yellow markers) tracks the difference between buy pressure and sell pressure. When the line stays positive (above zero), buying pressure exceeds selling pressure overall. When it drops negative (below zero), sellers dominate. This line gives you a quick snapshot of market control without having to compare column heights manually.
For instance, if price pushes higher but the delta line starts falling or turns negative, buyers are losing control even though price hasn't reversed yet. This early warning can help you tighten stops or avoid new long entries. Conversely, if price drops but delta starts rising toward positive territory, selling pressure might be exhausting and a bounce could develop.
Order Pulse becomes especially useful around support and resistance zones. Imagine price approaches a major support level and heavy red columns (aggressive selling) appear, but price refuses to drop further. This tells you buyers are absorbing the selling pressure—they're willing to step in and buy even when sellers attack. That absorption often precedes bounces.
The opposite scenario works too. If price reaches resistance and large green columns appear (aggressive buying) but price can't move higher, sellers are defending that level. They're meeting the buying pressure with enough supply to prevent the breakout. These situations help you avoid weak trades or position yourself for reversals.
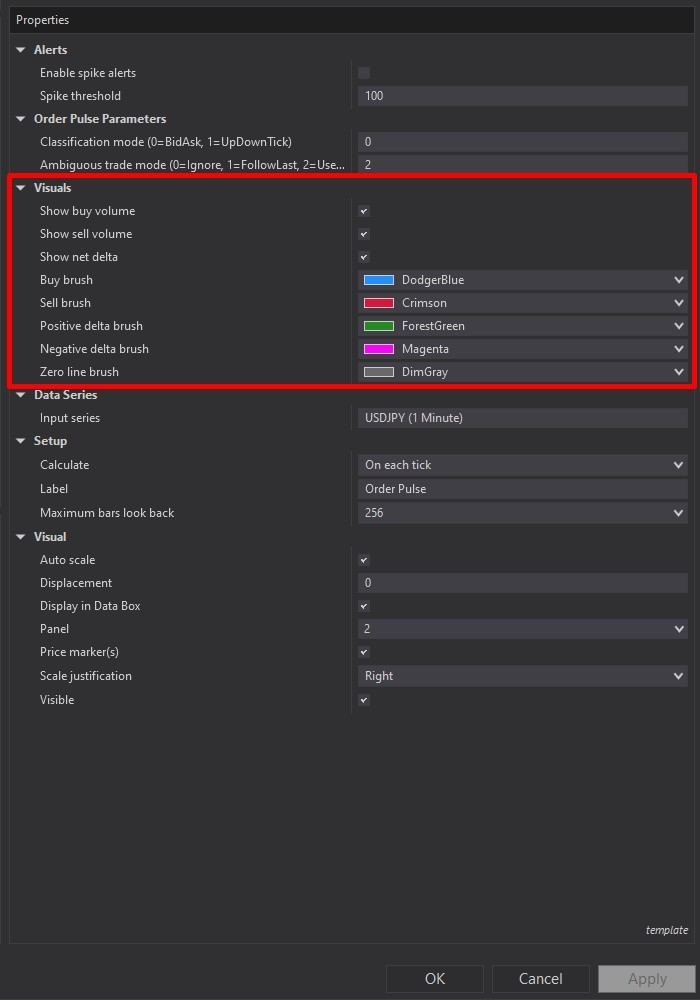
In Image 3 (highlighted by the red rectangle), you'll find the Visuals section where you can control what displays on the indicator. The "Show Buy Volume" toggle turns the green columns on or off. The "Show Sell Volume" toggle controls the red columns. The "Show Net Delta" toggle shows or hides the delta line.
Below these toggles, you can customise colours. "Buy Brush" sets the colour for buy pressure columns (default green). "Sell Brush" sets the colour for sell pressure columns (default red). "Positive Delta Brush" and "Negative Delta Brush" control the delta line colours depending on whether it's above or below zero. "Zero Line Brush" changes the appearance of the horizontal reference line.
These colour controls matter because you might trade with a dark theme or light theme, or you might want the indicator to match your existing chart setup. Having full colour control means the indicator stays readable regardless of your preferences.
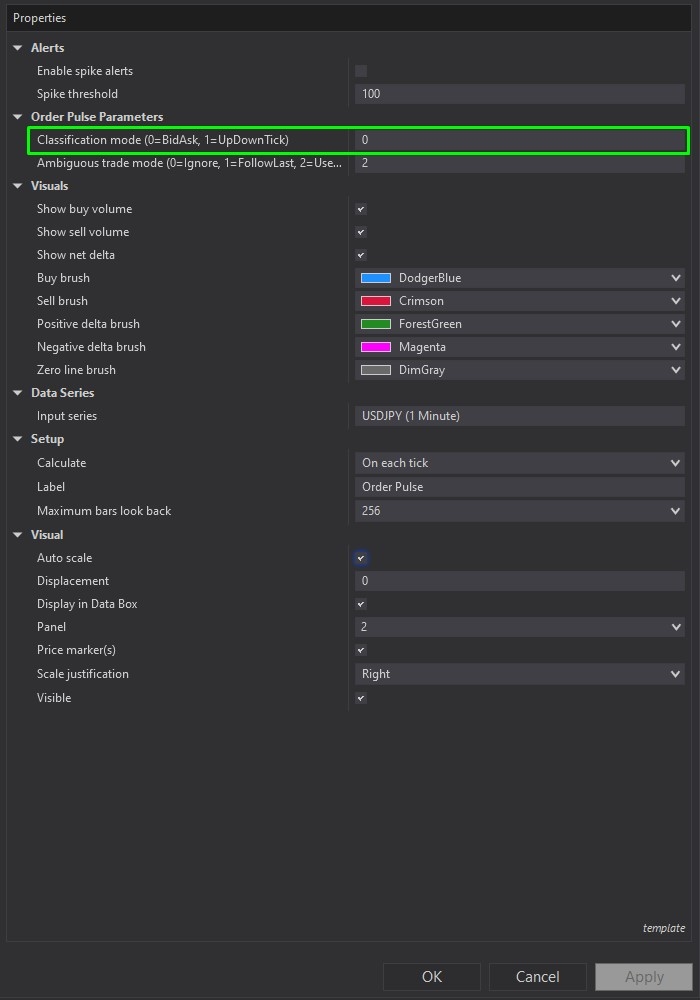
Image 4 (marked by the green rectangle) contains the "Classification Mode" setting in the Parameters section. This determines how the indicator decides whether a trade represents buying or selling pressure.
The default mode is "Bid-Ask" classification. In this mode, trades executing at or above the ask price count as aggressive buying (buyers lifting the offer). Trades at or below the bid price count as aggressive selling (sellers hitting the bid). This method typically provides the clearest picture of who's pressing the market.
The alternative is "Up-Down Tick" mode. Instead of looking at bid and ask prices, this method compares each trade to the previous one. If the price ticks higher, it's classified as buying pressure. If it ticks lower, it's selling pressure. Some traders prefer this on instruments where bid-ask spread data might be less reliable.
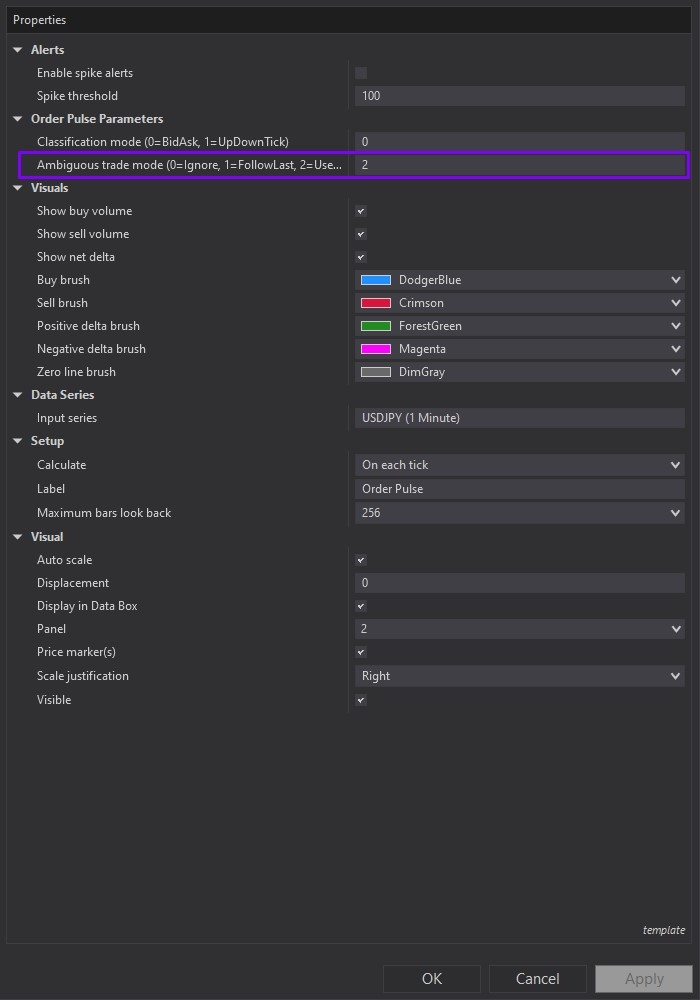
Sometimes trades execute between the bid and ask—in the spread itself. Image 5 (highlighted by the purple box) shows the "Ambiguous Trade Mode" setting that tells the indicator what to do with these trades.
"Ignore" skips them entirely, only counting clear bid or ask trades. "Follow Last" assumes the same direction as the most recent classified trade—if the last clear trade was buying, the ambiguous trade counts as buying too. "Use Up-Down Tick" falls back to comparing the trade price to the previous trade to determine direction.
For most traders, "Follow Last" works well because it keeps the flow of data continuous without making aggressive assumptions about unclear trades.
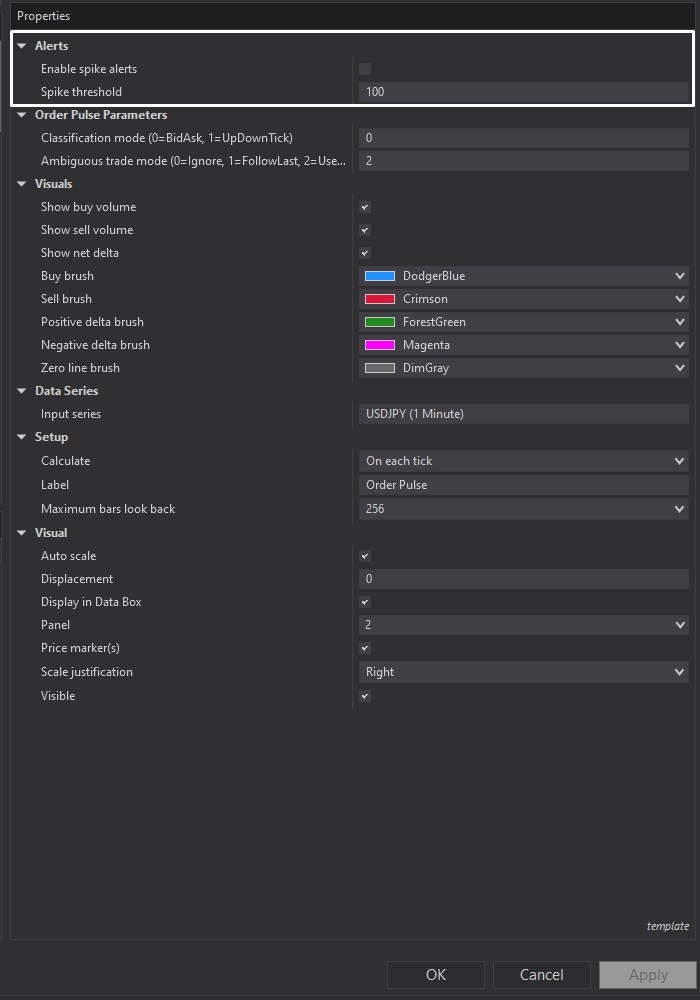
Image 6 (marked with a white rectangle) shows the Alerts section that lets you get notifications when unusually large aggressive trades hit the market. "Enable Spike Alerts" turns this feature on or off. When enabled, you'll hear an alert whenever a trade exceeding the "Spike Threshold" size executes.
The threshold defaults to 100 contracts. If you're trading ES (S&P 500 futures), a 100-lot hitting the bid or offer is significant and might signal institutional activity. You can lower this number to catch smaller bursts, or raise it to filter out everything except the largest trades.
These alerts help when you're watching multiple charts or need to step away briefly—you'll get notified when serious pressure enters your market.
When you download Order Pulse from rizecap.com, you receive the full NinjaScript .cs source file. This isn't a compiled DLL that locks you out—it's readable code you can open in any text editor or the NinjaScript editor.
Inside the code, you'll find comments explaining each section: how trades are classified, how the histograms are drawn, how alerts trigger, and how the delta calculation works. Even if you're not a programmer, the code structure is clear enough to follow along and understand the logic.
If you want to make changes—maybe use different colours by default, adjust how ambiguous trades are handled, or add your own custom alerts—you can edit the code directly. For developers, this becomes a foundation for building more complex order flow tools or integrating this logic into automated strategies.
The transparency matters. You're not relying on a black box where you don't know what's being measured or how calculations happen. You can verify everything yourself, which builds confidence in the tool.
If you have questions about configuring Order Pulse for different instruments, understanding bid-ask classification versus tick-based methods, or integrating order flow analysis into your existing strategies, check out the complete video tutorial above. It walks through real examples across different market conditions and shows exactly how to interpret what you're seeing on the indicator.
Secure payment via PayPal
By downloading, you agree with our Terms & Conditions

