Click to play video

Tutorial with Source Code
Please Register for FREE account or Login to purchase this source code.
By downloading, you agree with our Terms & Conditions
The Pivot Weave Bands is a sophisticated drawing tool developed for NinjaTrader 8 and 8.1. It specialises in creating adaptive volatility frameworks by analysing recent swing pivots to form dynamic bands around price, automatically adjusting band width and positioning as market behaviour changes rather than relying on fixed calculations, providing traders with visual representation of balance, expansion, and contraction that evolves in real-time with current market conditions. When you purchase the Pivot Weave Bands from Rize Capital, you receive the complete NinjaScript source code, providing total freedom to modify the pivot detection algorithms, customise the band calculation methodology and visual appearance parameters, or integrate the adaptive volatility logic into your own trading frameworks with no restrictions whatsoever. For a detailed overview, check out our video tutorial above.
See how the Pivot Weave Bands - NinjaTrader 8 Drawing Tool looks in action with these screenshots
Learn how to use the Pivot Weave Bands - NinjaTrader 8 Drawing Tool
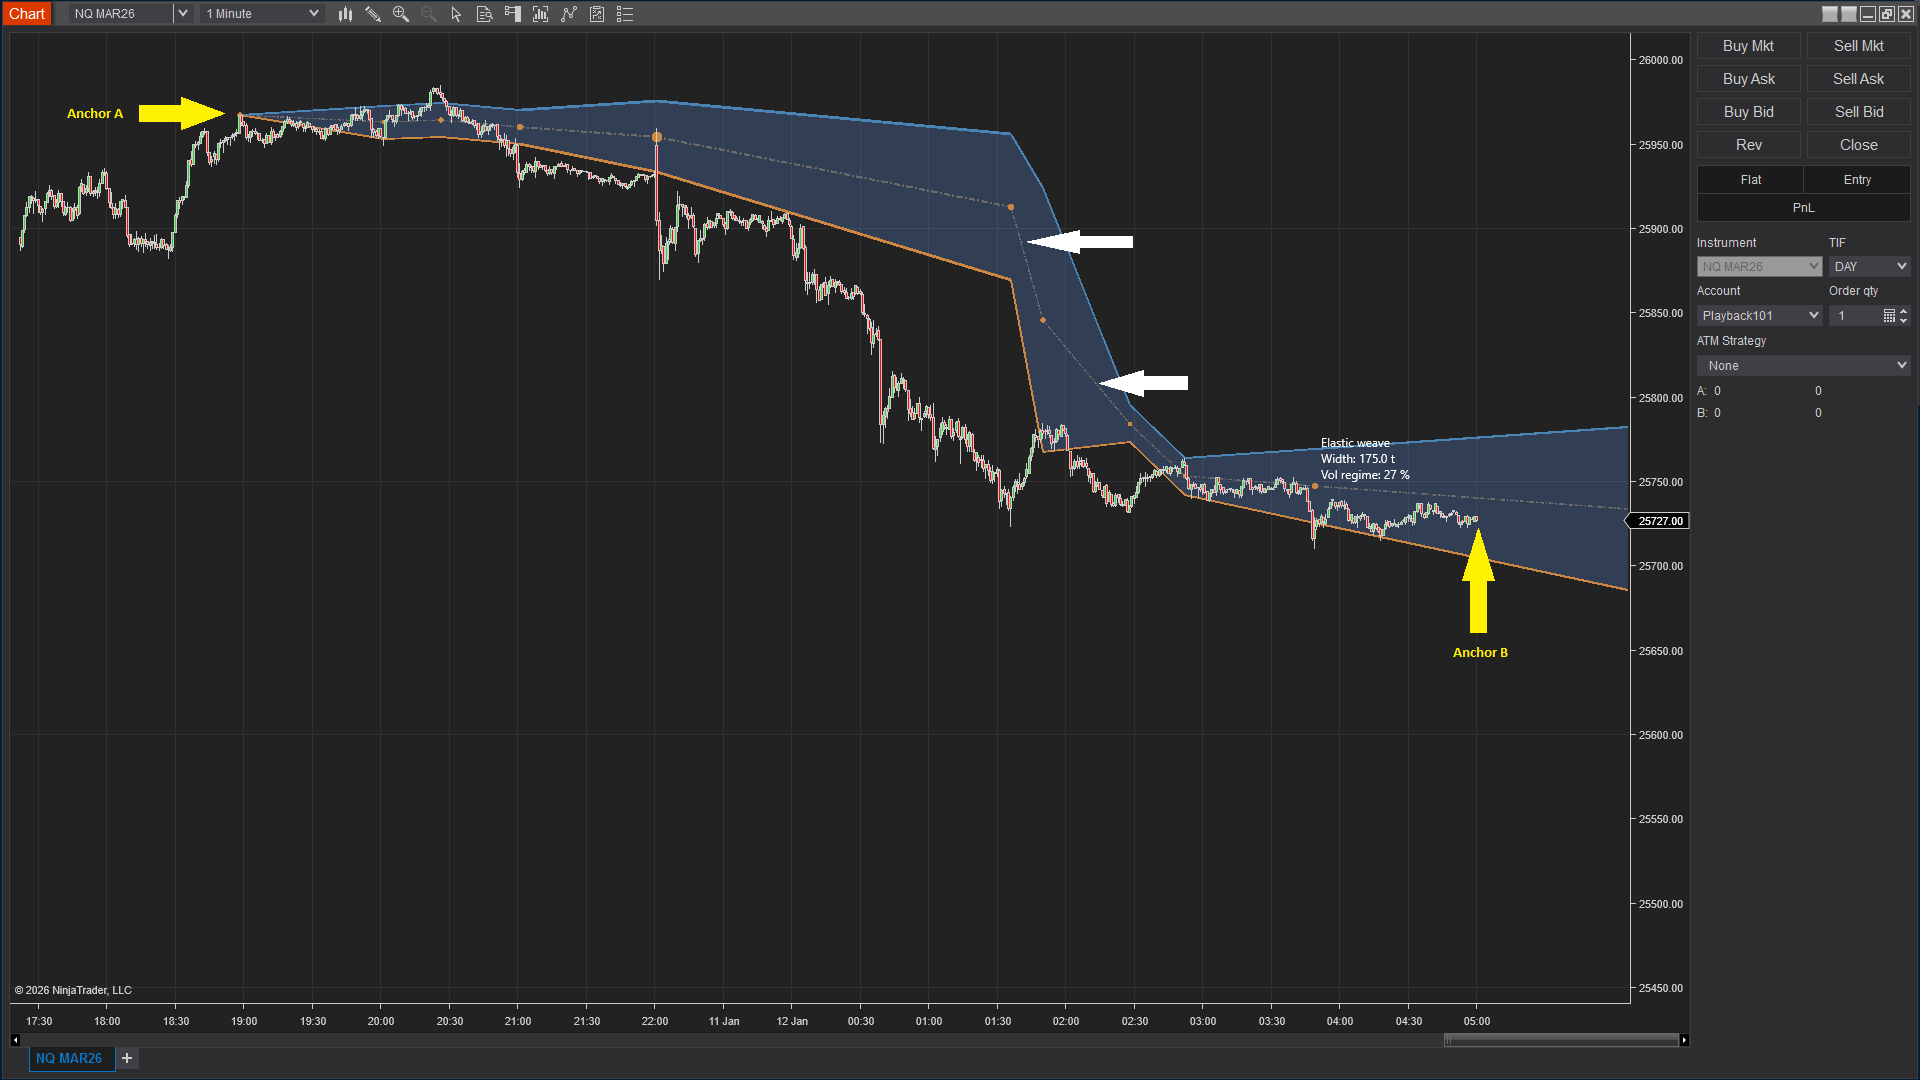
The Pivot Weave Bands Drawing Tool for NinjaTrader 8 specialises in adaptive volatility framework construction by analysing recent swing pivot behaviour to calculate dynamic upper and lower bands around an elastic centre line, automatically adjusting band width and regime classification as market conditions evolve from compression to expansion. The core functionality revolves around pivot-based volatility measurement combined with regime-aware visualisation that transforms raw price movement into structured context showing where price operates relative to current volatility extremes and equilibrium zones.
As shown in Image 1 (pointed by yellow arrows), traders place Anchor A and Anchor B to define the analysis window—the tool evaluates swing pivot behaviour between these anchors to construct the band framework. If anchors are not manually placed, the tool automatically analyses recent price history based on the Pivot Look Back parameter. Once calculation completes, three primary elements appear: the centre line representing the elastic equilibrium where price is most balanced (pointed by white arrows in Image 1), the upper band marking the adaptive volatility extreme above price, and the lower band establishing the volatility extreme below price.
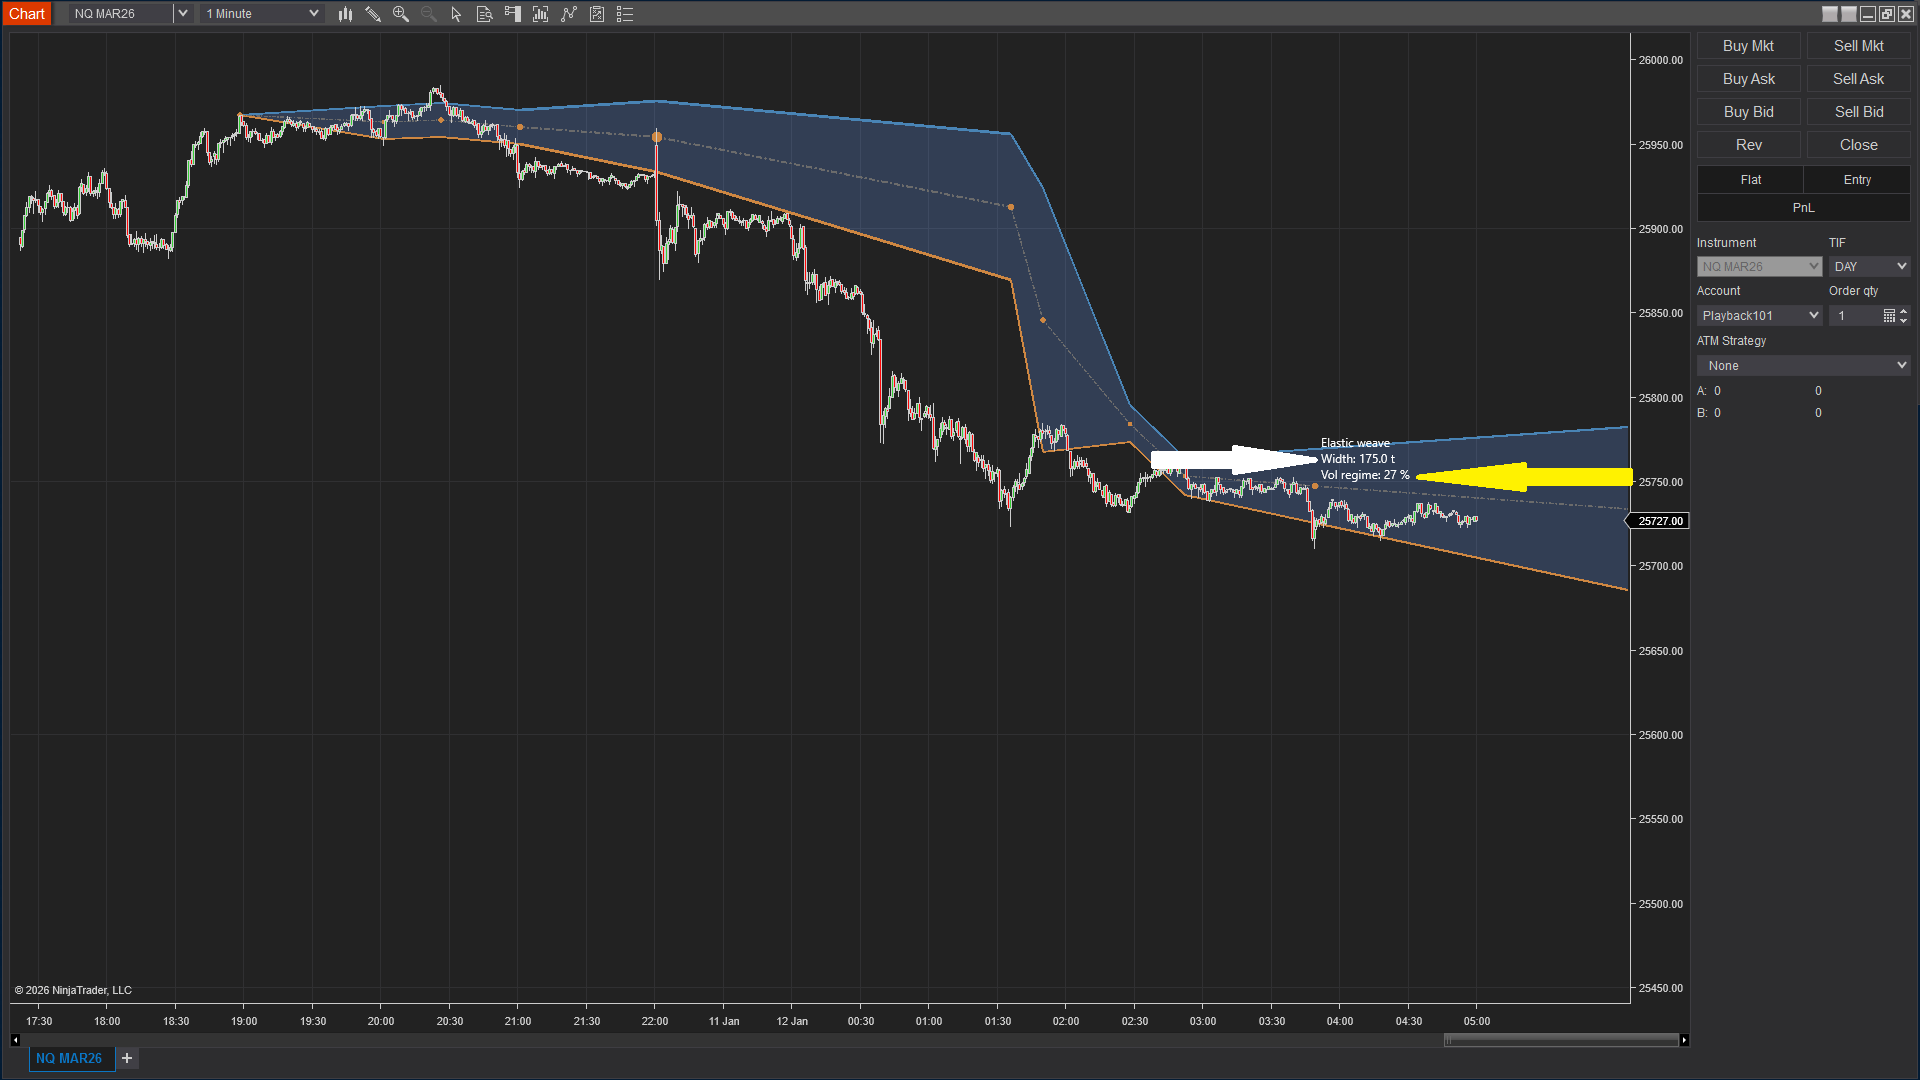
The tool goes beyond simple channel drawing by incorporating real-time volatility metrics that quantify market behaviour. In Image 2 (pointed by a white arrow), the Bandwidth Label displays the current band width measured in ticks—this value reveals how far price has been stretching recently. Large bandwidth values (e.g., 45 ticks, 60 ticks) indicate the market is moving in wider ranges with expanding volatility, suggesting moves will travel further, and trades require more room. Small bandwidth values (e.g., 12 ticks, 18 ticks) signal market compression with tight ranges, slower movement, and potential coiling energy that may precede breakouts.
The visual framework includes the Volatility Regime Label shown as a percentage (pointed by a yellow arrow in Image 2). This metric compares current volatility activity against recent historical averages—low regime values (e.g., 35%, 45%) indicate muted volatility where price tends to rotate, stall, or produce false breakouts. High regime values (e.g., 75%, 85%) signal elevated volatility where moves carry more energy and follow-through becomes more likely. Together, bandwidth and regime percentage provide complete context: wide bands with high regime signal expansion and trending potential, narrow bands with low regime indicate compression and range-bound behaviour.
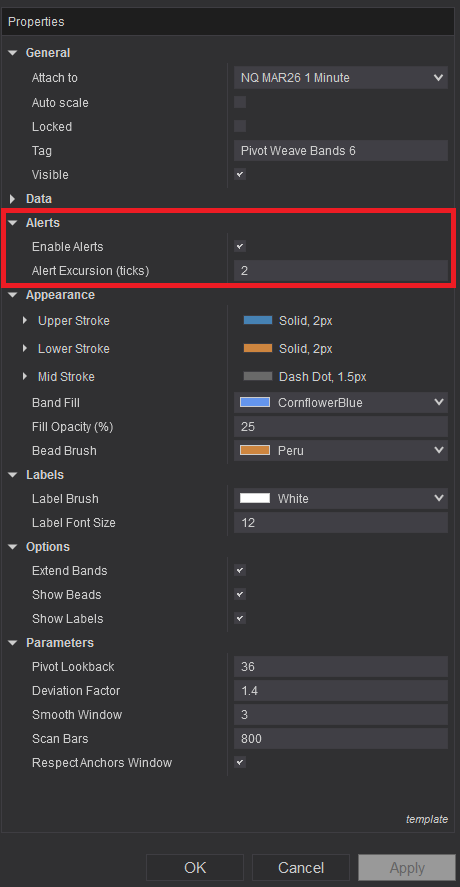
Pivot Weave Bands offers comprehensive customisation through its settings panel. The Alerts section, highlighted by a red rectangle in Image 3, controls notification functionality. The Enable Alerts parameter activates audible and visual alerts when price moves beyond band boundaries, helping traders monitor volatility expansion events without constant chart watching. The Alert Excursion Ticks setting defines how far price must travel beyond a band before triggering notifications—this filtering prevents alerts on minor boundary touches or noise, focusing attention only on meaningful volatility expansion moves that represent genuine regime changes rather than temporary fluctuations.
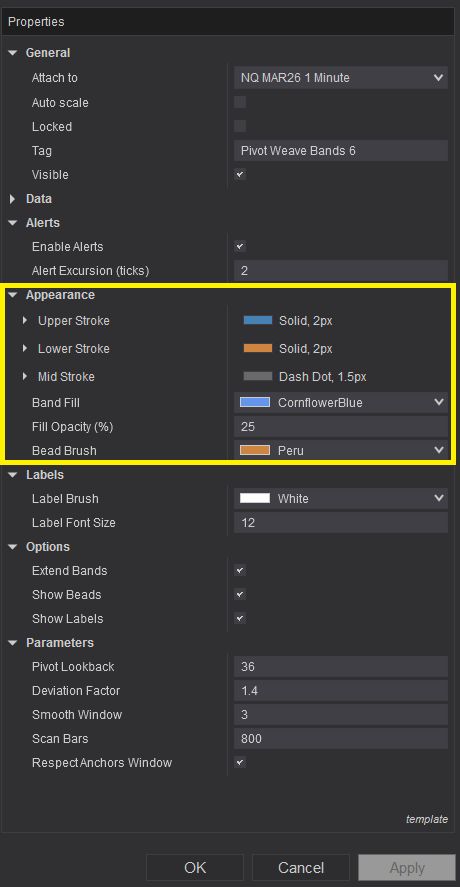
Image 4 displays the Appearance configuration options, highlighted by a yellow rectangle. The Upper Stroke parameter controls the colour, style (solid, dashed, dotted), and thickness of the upper volatility band, allowing clear visual distinction from other chart elements. The Lower Stroke setting determines styling for the lower volatility band with identical customisation options. The Mid Stroke parameter controls the elastic centre line appearance—this balance reference typically uses subtle styling to differentiate from the more prominent outer bands whilst remaining visible as the equilibrium zone.
The Band Fill setting establishes the colour used between upper and lower bands, creating a visual volatility envelope that makes the framework instantly recognisable. The Fill Opacity parameter controls transparency of this band fill—lower opacity values maintain price action visibility whilst subtle shading indicates the volatility zone, higher opacity creates more prominent visual emphasis. The Bead Brush parameter determines the colour of bead markers that highlight key pivot interactions within the band structure, providing visual reference points for the swing pivots that anchor the framework calculations.
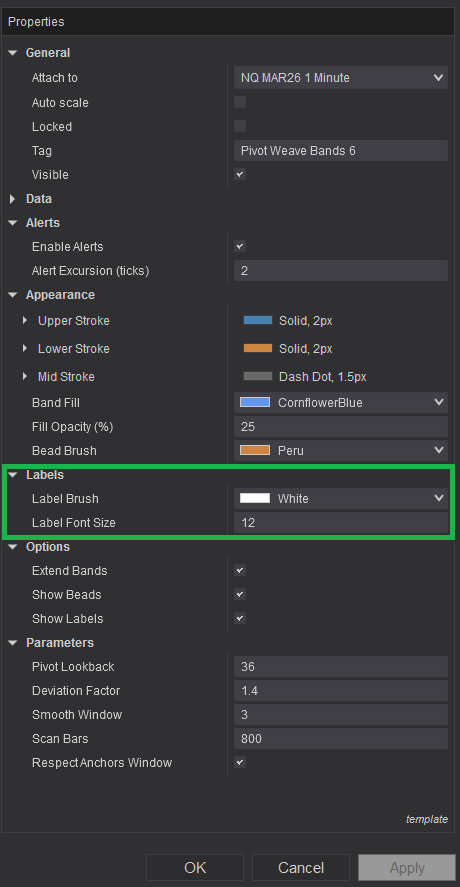
The Labels section, illustrated in Image 5 (highlighted by a green rectangle), controls information display. The Label Brush parameter sets the colour for all on-chart text, including bandwidth values and volatility regime percentages, ensuring readability against various chart backgrounds and colour schemes. The Label Font Size setting adjusts text scale for different monitor sizes, viewing distances, and personal preferences whilst maintaining clarity of the quantitative metrics that inform trading decisions.
The Options subsection provides behavioural controls. The Extend Bands parameter, when enabled, allows bands to project forward as new bars form, maintaining context visibility in real-time and helping traders see how current price action relates to established volatility boundaries. The Show Beads toggle controls visibility of pivot interaction markers—enabling this displays the specific swing points that anchor the band calculations, whilst disabling it creates cleaner charts when traders focus primarily on band boundaries rather than underlying pivot structure. The Show Labels toggle determines whether bandwidth and volatility regime values appear on the chart, allowing information display when learning the tool or cleaner presentation once interpretation becomes intuitive.
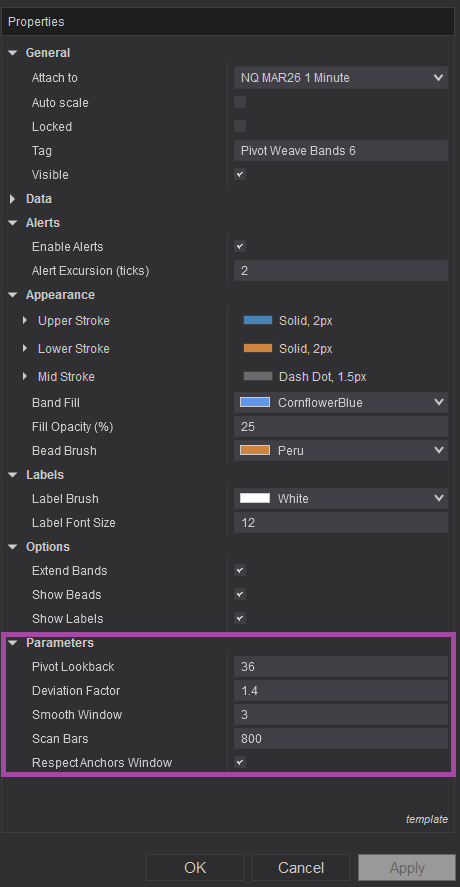
Image 6 (highlighted by a purple rectangle) reveals the fundamental calculation controls. The Pivot Look Back parameter defines how many bars the tool analyses to identify swing pivots used in band construction—higher values incorporate more historical pivots creating smoother, more stable bands that respond gradually to volatility changes, lower values focus on recent pivots producing more responsive bands that adapt quickly to regime shifts. This setting critically affects the band's balance between stability and sensitivity.
The Deviation Factor parameter controls how wide the bands expand around the elastic centre line based on measured swing pivot behaviour—higher deviation factors (e.g., 2.5, 3.0) create wider bands providing generous volatility envelopes appropriate for instruments with large price swings or when seeking high-conviction band breakout signals. Lower deviation factors (e.g., 1.5, 2.0) produce tighter bands that more closely track price extremes, suitable for low-volatility instruments or strategies requiring precise volatility boundary identification.
The Smooth Window setting applies smoothing to band calculations, reducing sharp fluctuations that might occur from individual volatile bars—higher smoothing values create calmer, more stable band movement that avoids whipsaw adjustments, lower smoothing increases responsiveness to immediate volatility changes. This parameter helps traders balance between band stability for strategic context and reactivity for tactical timing.
The Scan Bars parameter determines the historical depth of price data analysis available for pivot detection and volatility calculation—higher values provide more comprehensive historical context for regime comparison but increase computational requirements, lower values focus calculations on recent behaviour with faster processing. Traders should balance the need for historical perspective against performance considerations.
The Respect Anchors Window toggle, when enabled, limits all calculations exclusively to the area between manually placed Anchor A and Anchor B, allowing focused analysis of specific chart sections or time periods. When disabled, the tool analyses the full lookback period defined by Pivot Look Back and Scan Bars parameters regardless of anchor positioning, providing continuous band framework across the entire visible chart.
With full NinjaScript source code included, advanced users can modify the pivot detection methodology to implement alternative swing identification algorithms (e.g., percentage-based swings, ATR-based pivots), adjust the deviation factor calculation to incorporate volatility percentile rankings or standard deviation multiples, alter the regime percentage computation to use different statistical periods or normalisation methods, integrate additional metrics such as volume-weighted volatility or tick distribution analysis, create automated strategy frameworks that adjust position sizing based on bandwidth and regime values, or build sophisticated alert systems that distinguish between different types of band interactions without restrictions.
The source code package includes comprehensive documentation with clear overview sections explaining pivot-based volatility concepts, detailed swing pivot detection logic revealing how recent highs and lows anchor the calculations, complete band width algorithms showing deviation factor application and smoothing methodology, regime percentage computation descriptions demonstrating volatility activity comparison, and parameter interaction explanations clarifying how lookback, deviation, and smoothing settings combine. This transparency facilitates both understanding and practical customisation even for traders with intermediate NinjaScript experience.
The code architecture supports educational purposes—developers can study professional adaptive volatility framework construction, understand how pivot-based calculations differ from fixed-period indicators like Bollinger Bands, examine the balance between stability and responsiveness through smoothing and lookback parameters, and learn best practices for creating tools that provide both visual clarity and quantitative metrics. This knowledge transfers beyond the specific tool, improving overall volatility analysis and regime detection capabilities.
If you have questions about optimal parameter selection for different instruments, combining Pivot Weave Bands with momentum or volume analysis tools, interpreting bandwidth and regime metrics across various market conditions, or building automated strategies that reference band positions and volatility states for systematic trade management, refer to the comprehensive video tutorial above for detailed guidance on maximising the Pivot Weave Bands' effectiveness.
Secure payment via PayPal
By downloading, you agree with our Terms & Conditions

