Click to play video

Tutorial with Source Code
Please Register for FREE account or Login to purchase this source code.
By downloading, you agree with our Terms & Conditions
The Price Memory Zones is one of the best NinjaTrader indicators for professional-grade analytics that automatically identify and visualise price levels where candle bodies have historically overlapped most frequently across recent sessions. It analyses historical price activity using sophisticated density calculations to detect high-memory regions where institutional and retail traders have repeatedly interacted, transforming these findings into clean, shaded zones that represent natural support and resistance areas. When you purchase the Price Memory Zones from Rize Capital, you receive the complete NinjaScript source code. For a detailed overview, check out our video tutorial above.
See how the Price Memory Zones - NinjaTrader 8 Indicator looks in action with these screenshots
Learn how to use the Price Memory Zones - NinjaTrader 8 Indicator
The Price Memory Zones Indicator for NinjaTrader 8 improves support and resistance analysis by automatically identifying price levels where candle bodies have historically overlapped with the highest frequency and intensity across recent sessions. The core functionality centres around sophisticated density histogram calculations that aggregate price activity from multiple sessions, applying decay weighting to prioritise recent behaviour whilst incorporating historical context for robust zone identification.
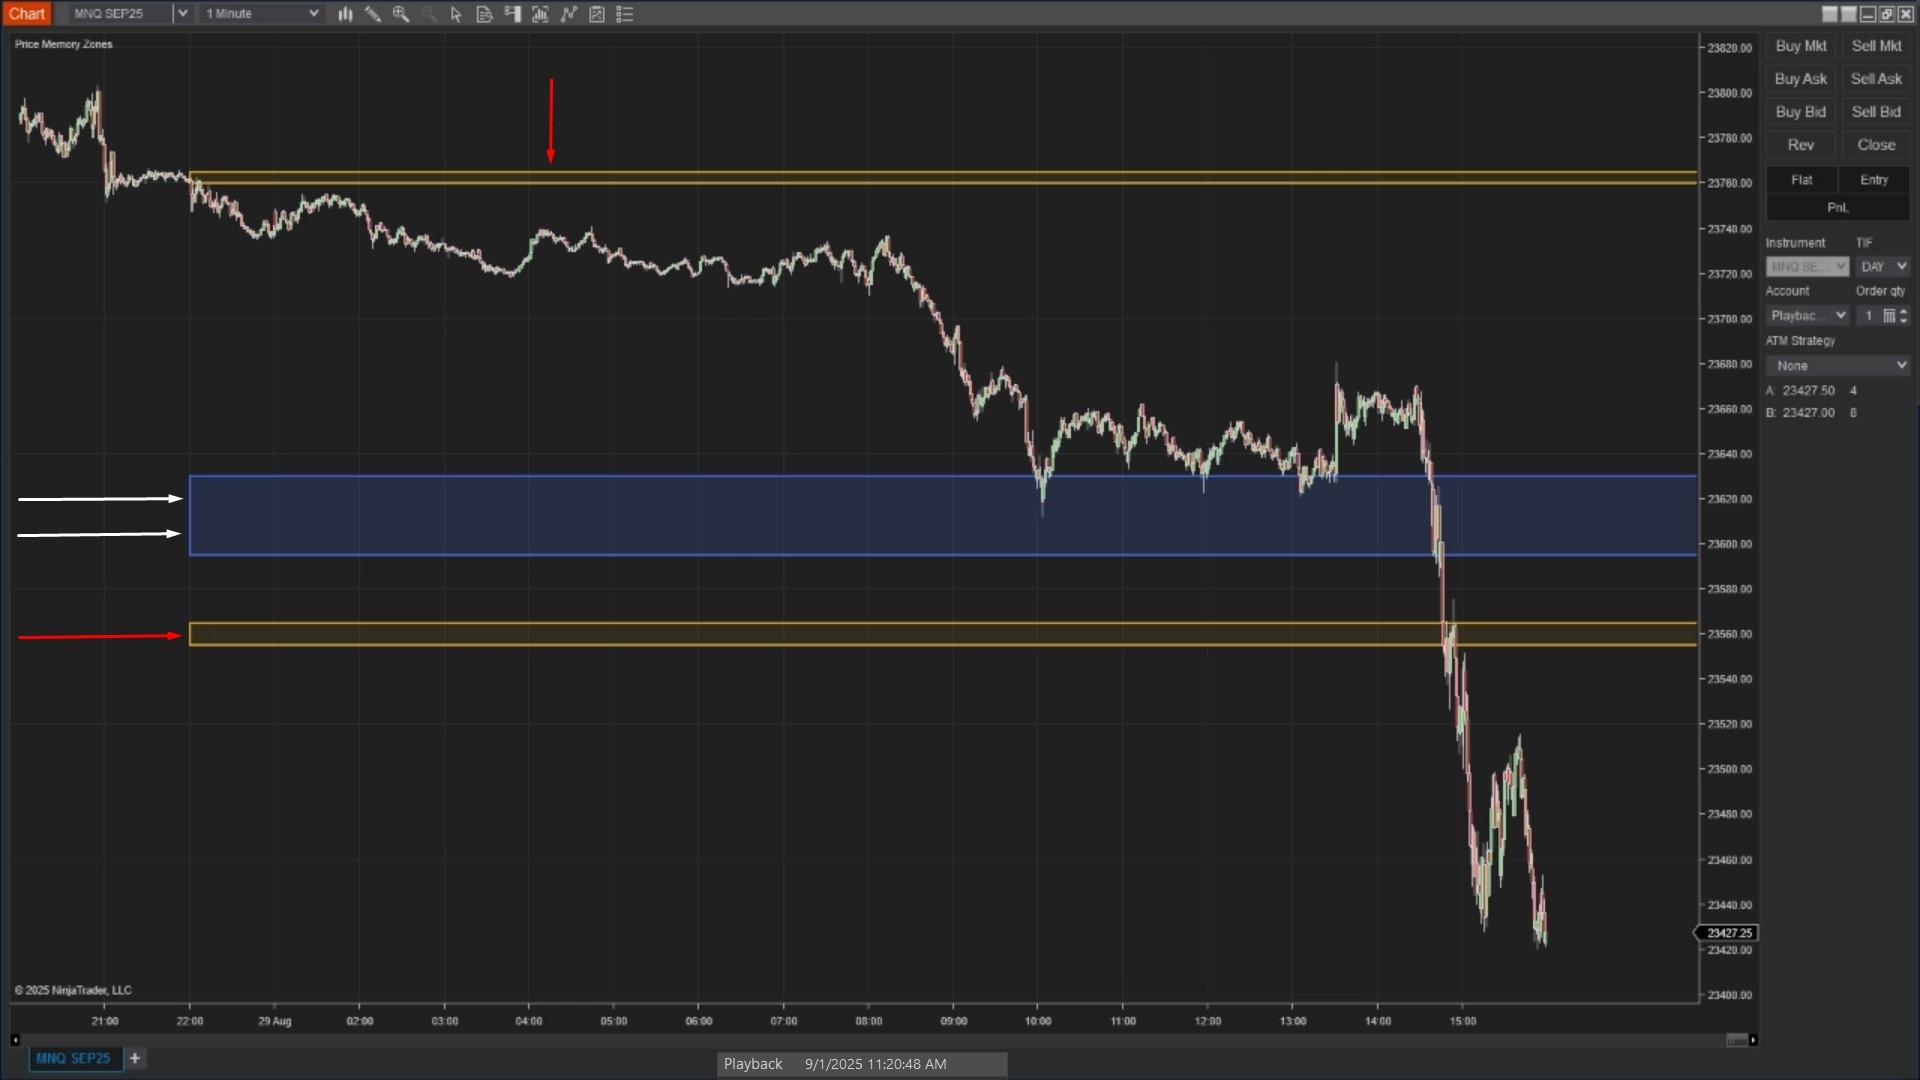
As shown in Image 1 (pointed by yellow arrows), the primary zone displayed in royal blue represents the strongest historical price memory—the level where price has interacted most frequently with the highest intensity, indicating where institutional and retail order flow has repeatedly engaged. These primary zones often act as the most reliable support and resistance areas, providing high-probability reaction points for entries and exits. The secondary zones shown in goldenrod (pointed by white arrows) highlight additional but less dominant areas of interest that can still serve as meaningful pause points, rejection levels, or secondary support and resistance during market movement. The shaded appearance uses modest opacity settings to ensure price candles and wicks remain clearly visible whilst the zones provide unmistakable structural context beneath the price action.
The indicator eliminates subjective level drawing through automatic session-based analysis and real-time zone updates. When price approaches a memory zone from above and shows bullish rejection (bouncing off the zone), traders receive clear visual confirmation of support holding, signalling potential long entry opportunities with logical stop placement just beyond the zone edge. Conversely, when price breaks cleanly through a memory band and closes on the opposite side, it signals a shift in sentiment where the broken zone often flips its role—support becomes resistance or vice versa—creating continuation and retest opportunities for trend-following setups. The zones automatically recalculate at the start of each session, incorporating the latest price activity whilst applying decay factors to ensure recent sessions carry greater weight than older data, keeping the zones adaptive yet stable.
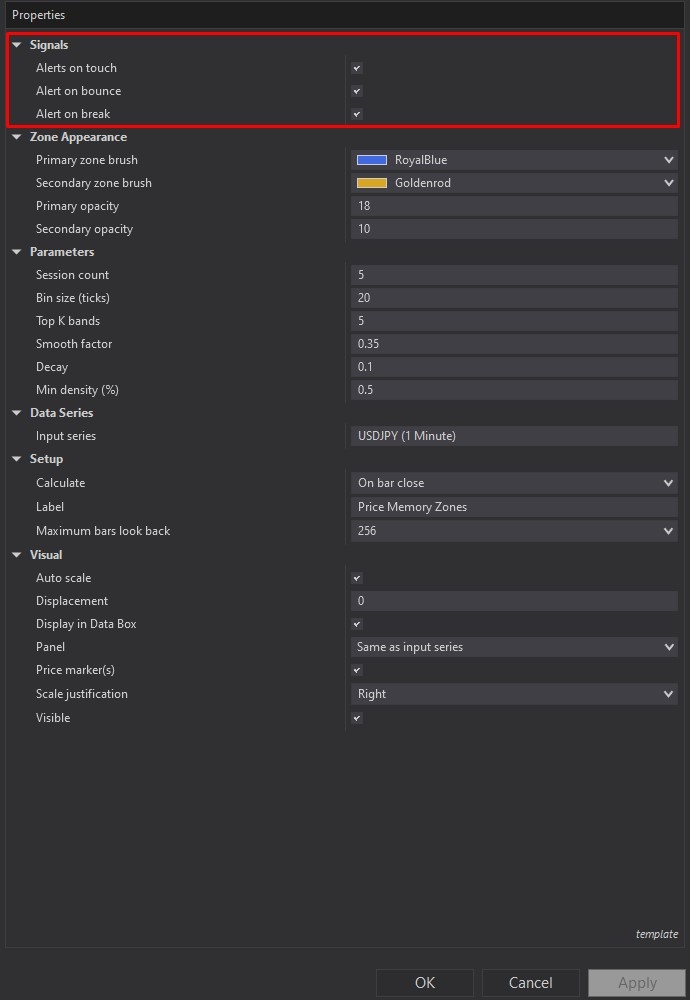
Price Memory Zones offers extensive customisation through its comprehensive settings panel. The Signals and Alerts section, highlighted by a red rectangle in Image 2, provides intelligent notification systems that operate in real-time to keep traders informed of critical zone interactions. Alert on Touch triggers the moment price enters a zone from outside, providing early warning of potential reaction areas. Alert on Bounce fires when price exits the zone on the same side it entered, signalling a rejection or reversal pattern where the zone held as support or resistance. Alert on Break activates when price exits the opposite side of the zone, indicating a pass-through or breakout scenario where the level failed to hold. The system uses simple internal flag tracking to classify whether entry came from below or above, intelligently differentiating bounces from breaks. These alerts serve as attention mechanisms for discretionary traders rather than automated trading signals, keeping you focused on the right moments without overwhelming notification noise.
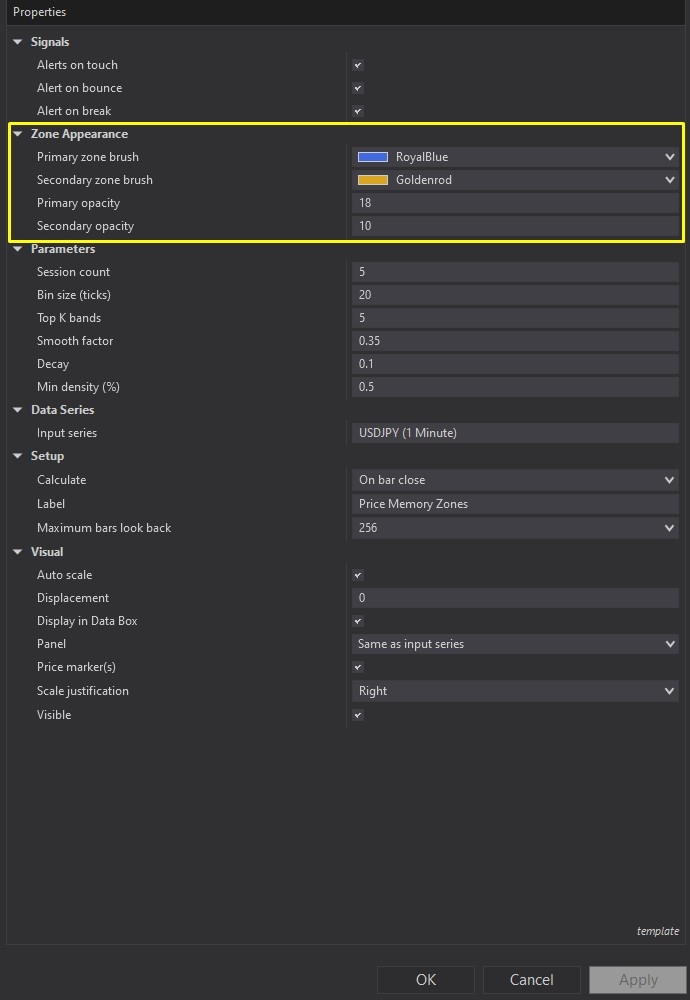
Image 3 displays the Zone Appearance configuration options, highlighted by a yellow rectangle. The Primary Zone Brush and Opacity controls allow complete colour customisation for the strongest memory bands, with default royal blue colouring and light transparency ensuring price candles remain readable whilst the zone stands out clearly. Secondary Zone Brush and Opacity settings provide separate styling for additional bands, defaulting to goldenrod with slightly lower opacity to create visual hierarchy between primary and secondary importance levels. Traders can adjust opacity percentages to suit their charting preferences—keeping settings modest during live trading for clean price reading, then intensifying transparency during historical review and backtesting analysis. This flexible visual framework ensures memory zones provide structural context without cluttering the chart or obscuring critical price action details.
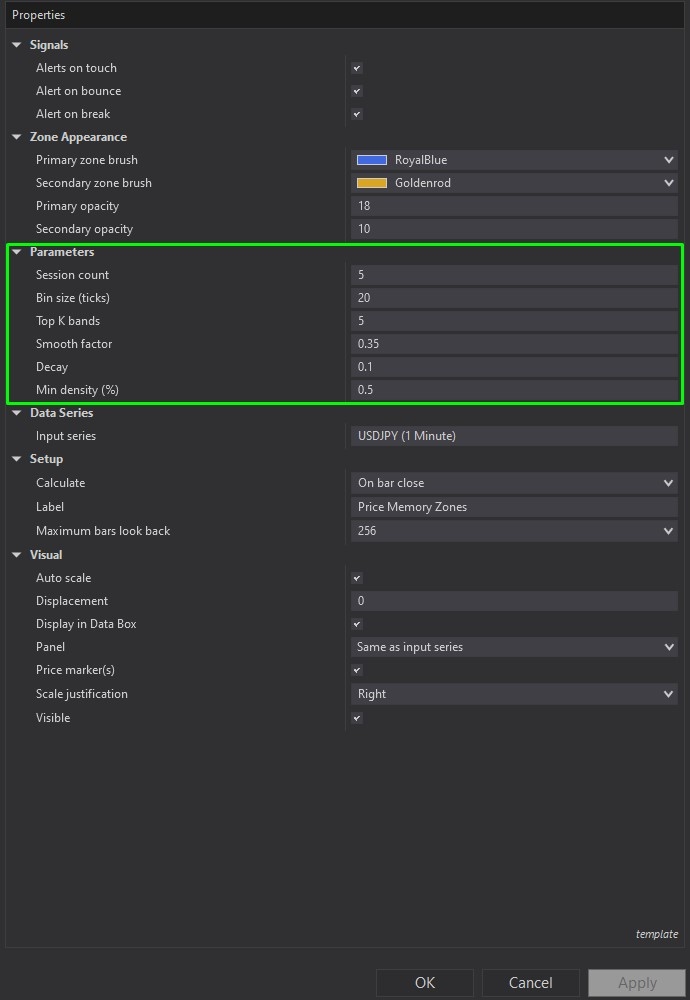
The Inputs and Parameters section, illustrated in Image 4 (highlighted by a green rectangle), controls the sophisticated mathematical engine driving zone detection. Session Count determines how many recent sessions to include in the aggregate calculation—higher values (e.g., 10 sessions) provide stability and smoother zones less susceptible to single-session anomalies, whilst lower values (e.g., 3 sessions) make zones adapt faster to changing market conditions. Bin Size Ticks sets the vertical resolution of the price histogram used for density calculations—larger bins combine nearby prices into thicker, more prominent zones suitable for higher timeframes, whilst smaller bins create precise, granular zones ideal for scalping. Top K Bands defines the maximum number of memory zones to display simultaneously, with default of five providing balanced information without excessive visual clutter. Smooth Factor applies light neighbour smoothing to reduce jaggedness in zone edges, with values around 0.35 blending adjacent histogram bins for cleaner, more professional-looking bands. Decay gently downweights older sessions so the most recent activity matters more in the calculation, with values around 0.10 providing natural recency bias whilst maintaining historical context. Minimum Density Percent establishes a relative threshold that filters out weak zones by keeping only histogram bins at or above a specified fraction of peak density—raising this parameter focuses display on only the strongest zones, whilst lowering it reveals more secondary zones for comprehensive market structure analysis.
With full NinjaScript source code included, advanced users can study the complete session profiling and aggregation algorithms, modify the decay weighting functions, adjust the histogram bin calculations and smoothing logic, customise the band extraction methodology, alter the alert classification system, or integrate the zone data into automated strategies and custom indicators without any restrictions whatsoever.
If you have questions about the indicator, refer to the comprehensive video tutorial above.
Secure payment via PayPal
By downloading, you agree with our Terms & Conditions

