Mega Sale 50% OFF All Products & Memberships | Limited time onlyUse code RCSALE50ALL
Click to play video

Tutorial with Source Code
Please Register for FREE account or Login to purchase this source code.
By downloading, you agree with our Terms & Conditions
The Pulse Corridor is a sophisticated drawing tool developed for NinjaTrader 8 and 8.1. It specialises in identifying clean momentum impulses and mapping structured volatility corridors by scanning price action for strong same-direction pushes, fitting regression-based centre lines that define directional bias, and building ATR-adaptive upper and lower rails that expand and contract with market conditions, whilst projecting measured continuation targets through echo functionality that extends impulse structure forward. When you purchase the Pulse Corridor from Rize Capital, you receive the complete NinjaScript source code, providing total freedom to modify the impulse detection algorithms, customise the corridor calculation methodology and visual appearance parameters, or integrate the momentum mapping logic into your own trading frameworks with no restrictions whatsoever. For a detailed overview, check out our video tutorial above.
See how the Pulse Corridor - NinjaTrader 8 Drawing Tool looks in action with these screenshots
Learn how to use the Pulse Corridor - NinjaTrader 8 Drawing Tool
The Pulse Corridor Drawing Tool for NinjaTrader 8 specialises in momentum impulse identification and volatility corridor construction by scanning defined price ranges for consecutive same-direction candles that meet minimum body-to-range ratios, calculating regression-based centre lines that establish directional bias, and projecting ATR-adaptive upper and lower rails that form volatility boundaries around the impulse structure. The core functionality revolves around impulse quality filtering combined with adaptive corridor visualisation that transforms raw momentum moves into structured trading lanes with clear continuation projections.
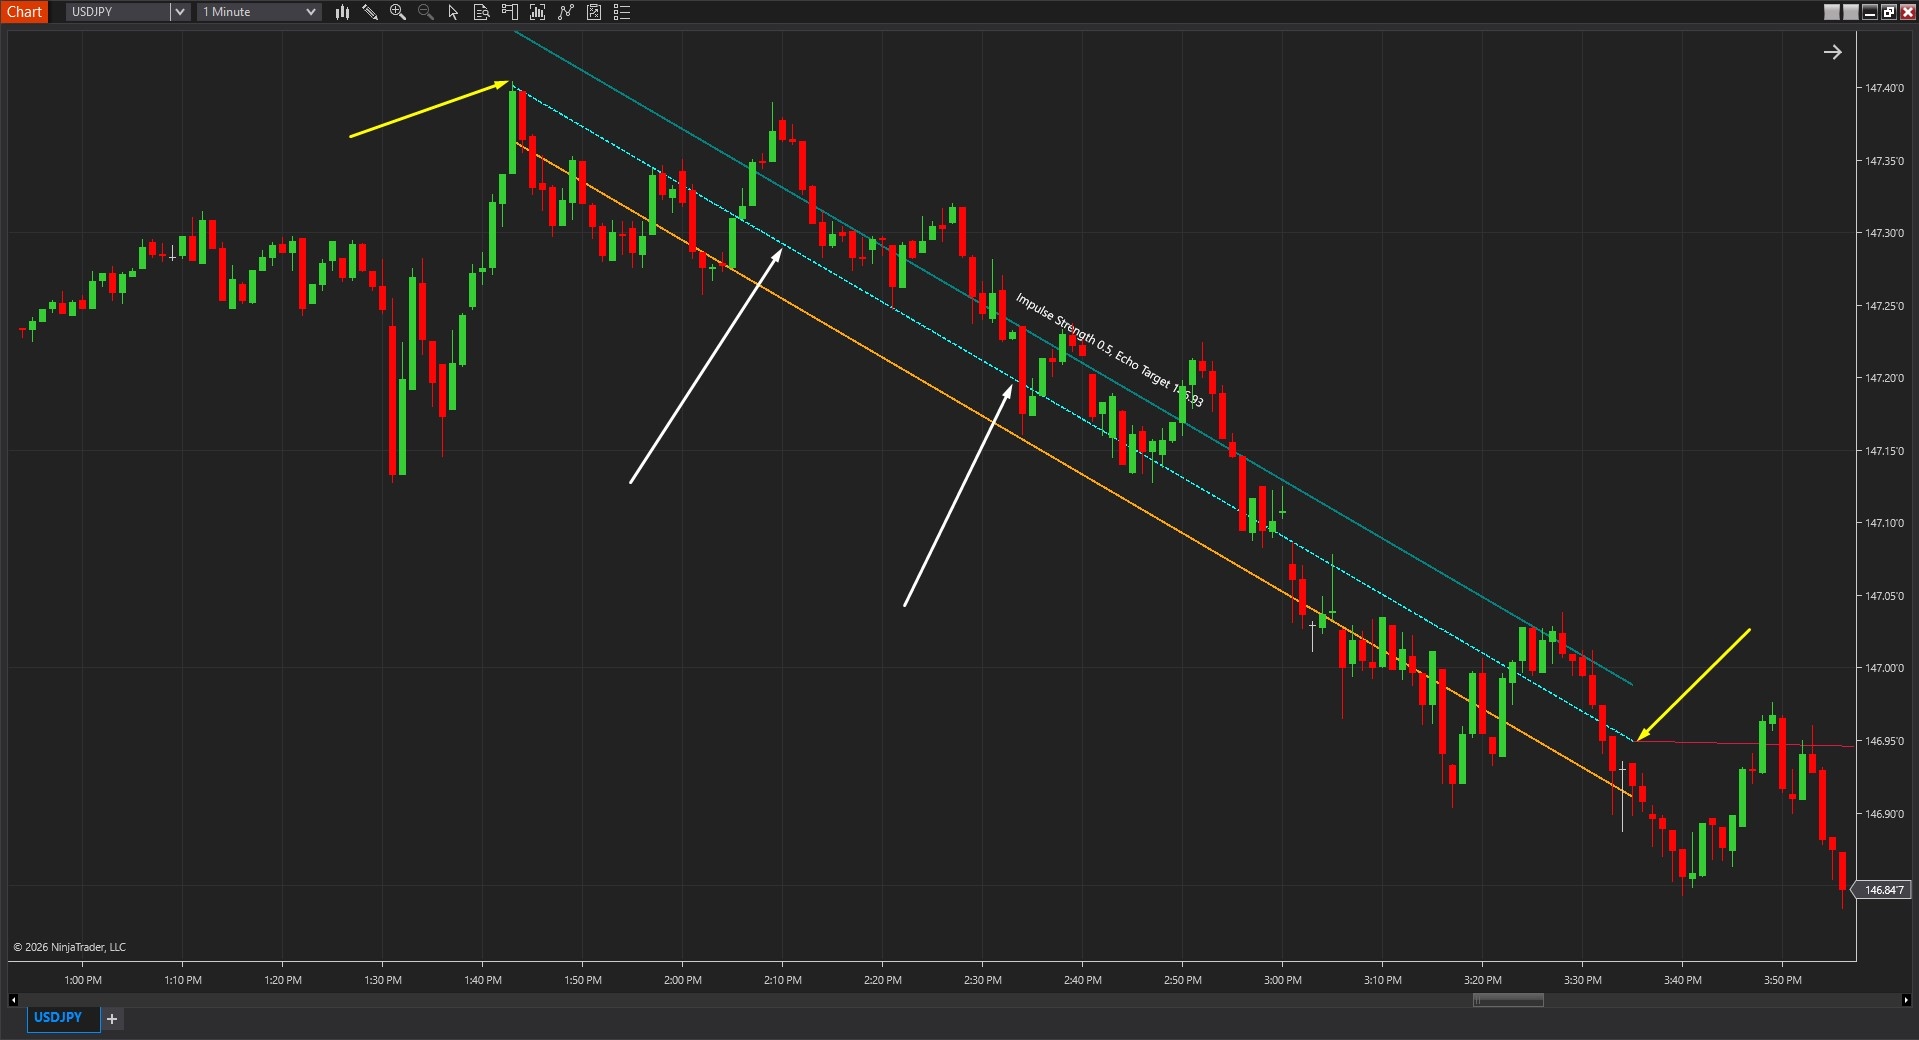
As shown in Image 1 (pointed by yellow arrows), traders place Anchor A at the beginning of a suspected impulse move and Anchor B at the end of the momentum push. The tool immediately scans the defined range to identify qualifying impulse sequences—consecutive bars moving in the same direction with sufficient body strength. Once detection completes, the corridor structure appears featuring three primary elements: the centre line representing the regression-based directional spine of the impulse (pointed by white arrows), the upper rail marking the volatility boundary above the centre line, and the lower rail establishing the volatility boundary below the centre line.
The tool goes beyond simple channel drawing by incorporating quality-filtered impulse detection that distinguishes genuine momentum from choppy noise. The centre line slope immediately reveals directional bias—rising centre lines indicate structurally bullish momentum, suggesting focus on long opportunities, whilst falling centre lines show structurally bearish momentum warranting short-side focus. This regression-based approach eliminates subjective trend identification, providing mathematical confirmation of directional structure rather than interpretation of random swing patterns.
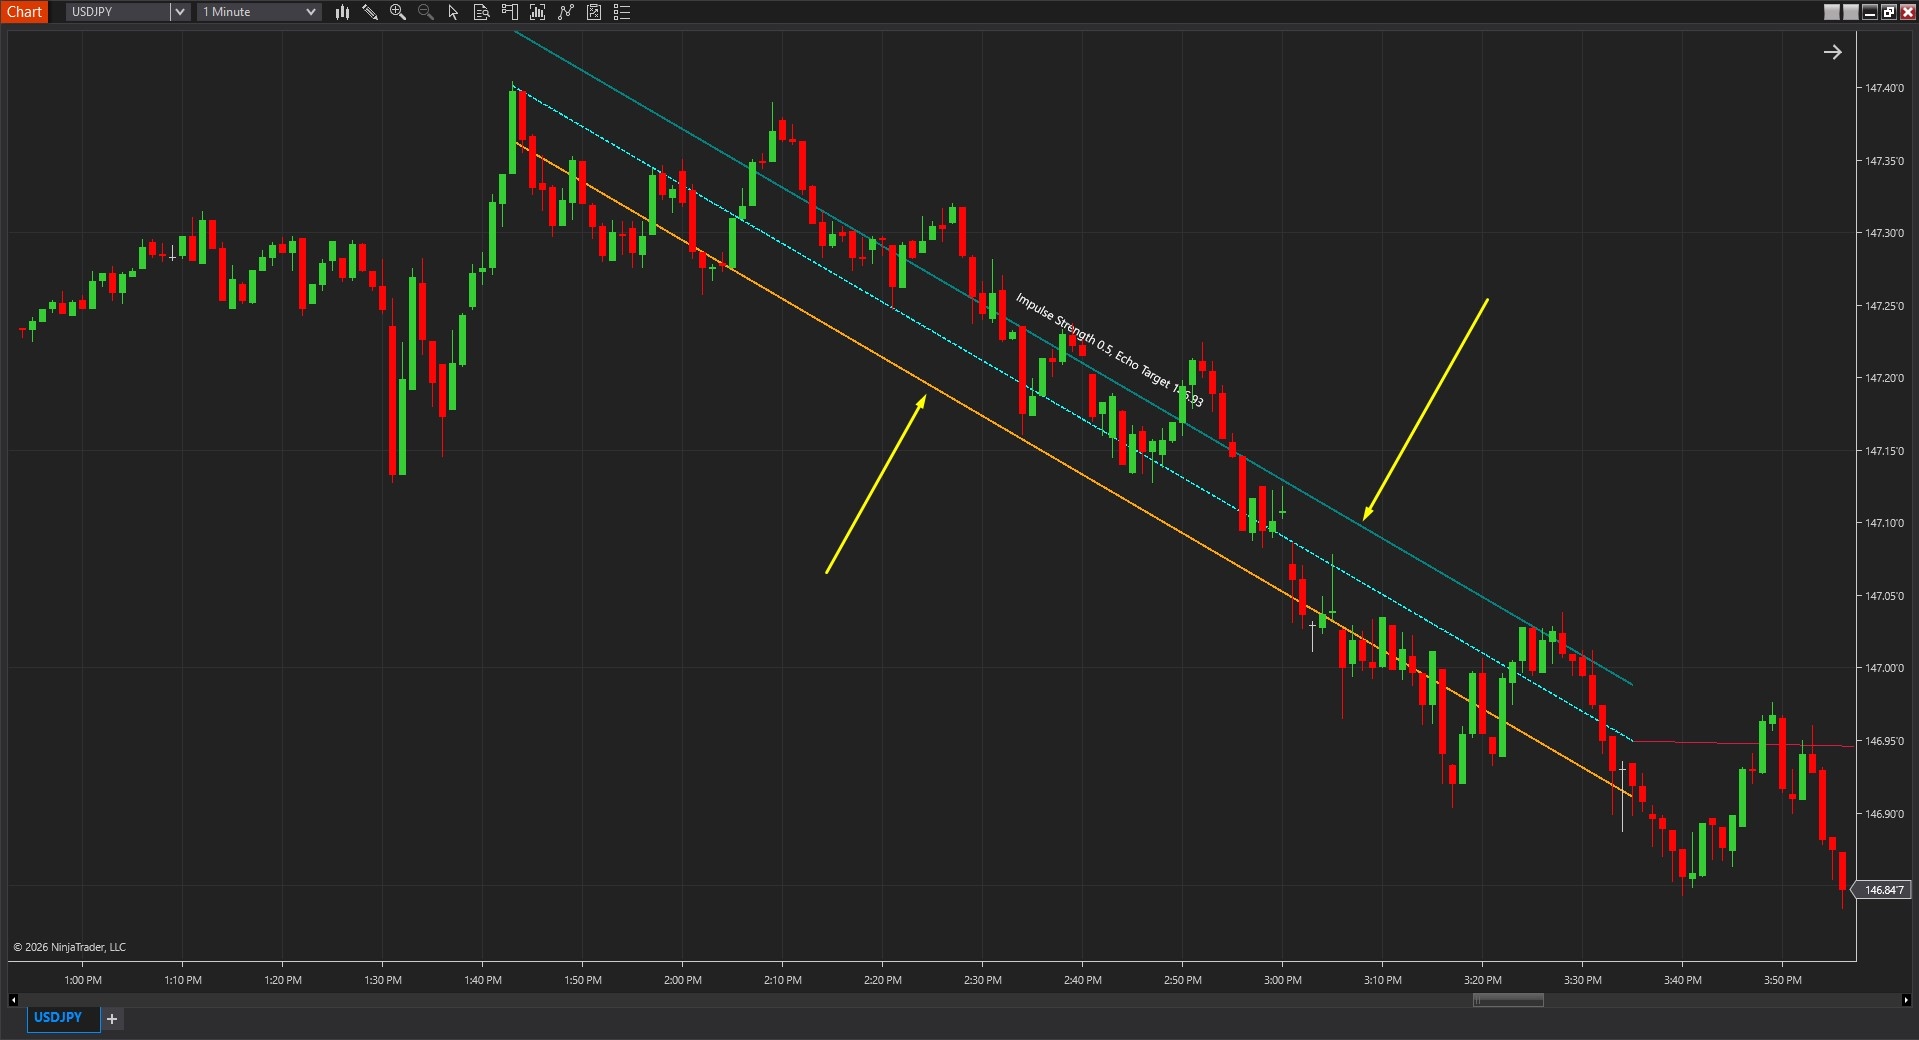
The visual framework includes ATR-adaptive rails that automatically adjust width based on current volatility conditions. As shown in Image 2 (pointed by yellow arrows), the upper and lower rails expand during high-volatility periods creating wider corridors that accommodate larger price swings without generating false breakout signals. During low-volatility conditions, rails contract producing tighter corridors that maintain relevance to current price behaviour. This adaptive quality ensures the corridor remains meaningful across changing market regimes rather than using fixed width that becomes too narrow during expansion or too wide during compression.
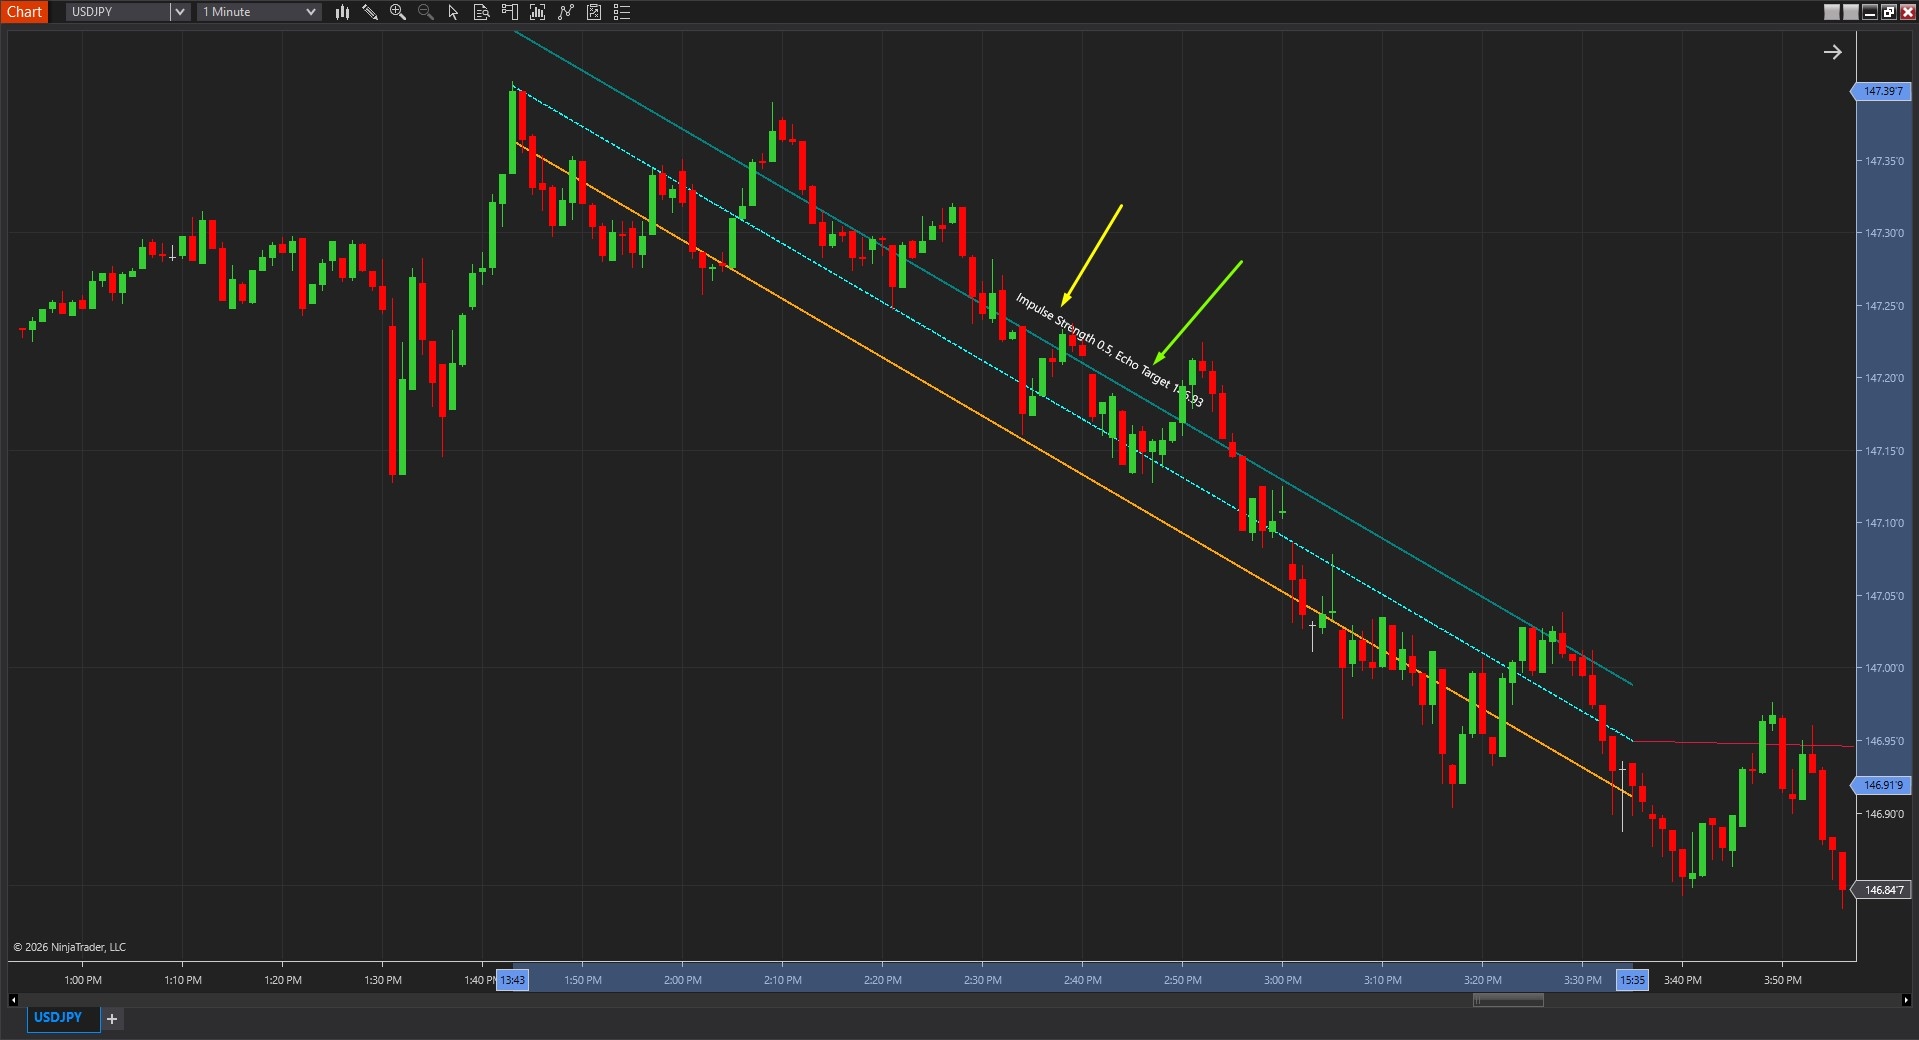
One of Pulse Corridor's most valuable features, illustrated in Image 3 (pointed by a yellow arrow), involves the on-chart label displaying critical metrics. The Impulse Strength value quantifies how clean and decisive the detected impulse appears—higher strength readings suggest institutional-style momentum with strong conviction, cleaner structure, minimal retracement noise, and increased follow-through potential. Lower strength values indicate weaker impulses with more internal choppiness, suggesting cautious approach or waiting for stronger confirmation before committing to continuation trades.
When the Show Echo toggle is enabled (pointed by a green arrow), the Echo Target appears in the label alongside a projected extension line. This echo projection represents a measured continuation target based on the original impulse size scaled by the Echo Factor parameter—essentially projecting forward where price might travel if the impulse continues with similar magnitude. The echo provides structured reference for profit target planning, partial exit scaling, or trailing stop logic rather than arbitrary price level selection.
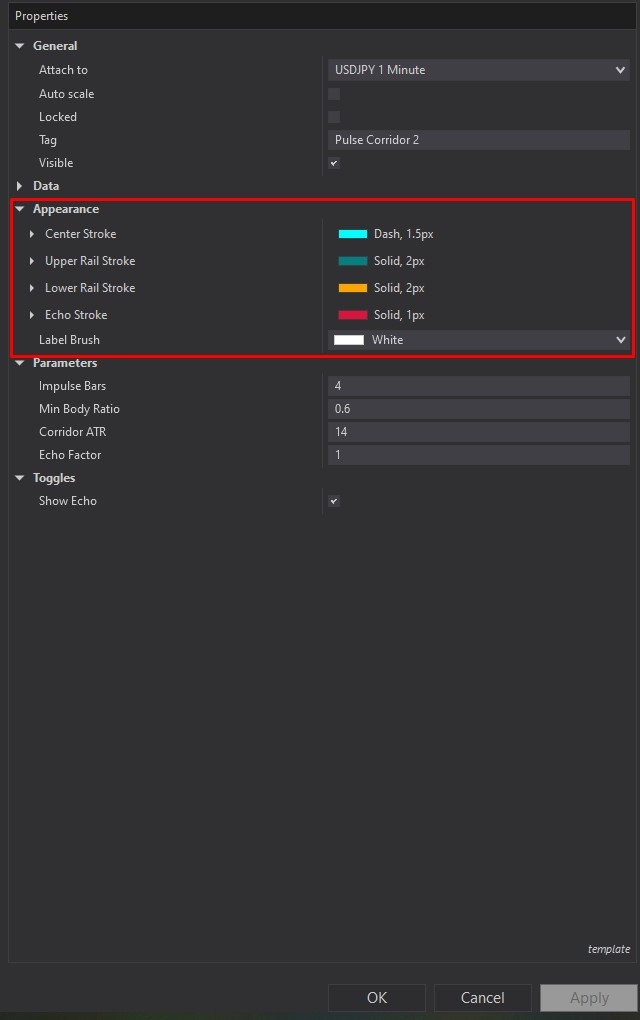
Pulse Corridor offers comprehensive customisation through its settings panel. The Appearance section, highlighted by a red rectangle in Image 4, controls visual presentation of all corridor elements. The Centre Stroke parameter customises the regression centre line appearance including colour, thickness, and dash style options—many traders use dashed styling to visually differentiate the directional spine from the outer rails, whilst increased thickness emphasises the core trend reference on busy charts.
The Upper Rail Stroke and Lower Rail Stroke settings control the volatility boundary appearances with independent colour and thickness customisation. Traders often match both rails for visual symmetry creating clean corridor presentation, though differentiation through distinct colours can improve clarity during fast-moving markets where rapid visual assessment becomes critical. Solid, slightly thicker rail lines clearly define the momentum lane boundaries, helping traders instantly recognise when price operates within structure versus breaking beyond volatility limits.
The Echo Stroke parameter determines the projected continuation line appearance when Show Echo is enabled. Subtle styling with thinner lines and muted colours creates understated target reference without overwhelming price action visibility, whilst brighter, thicker styling emphasises the echo as prominent profit target zone. The Label Brush setting controls on-chart text colour for impulse strength and echo target information, requiring adjustment based on chart background themes—light colours for dark mode charts, dark colours for light backgrounds—ensuring constant readability.
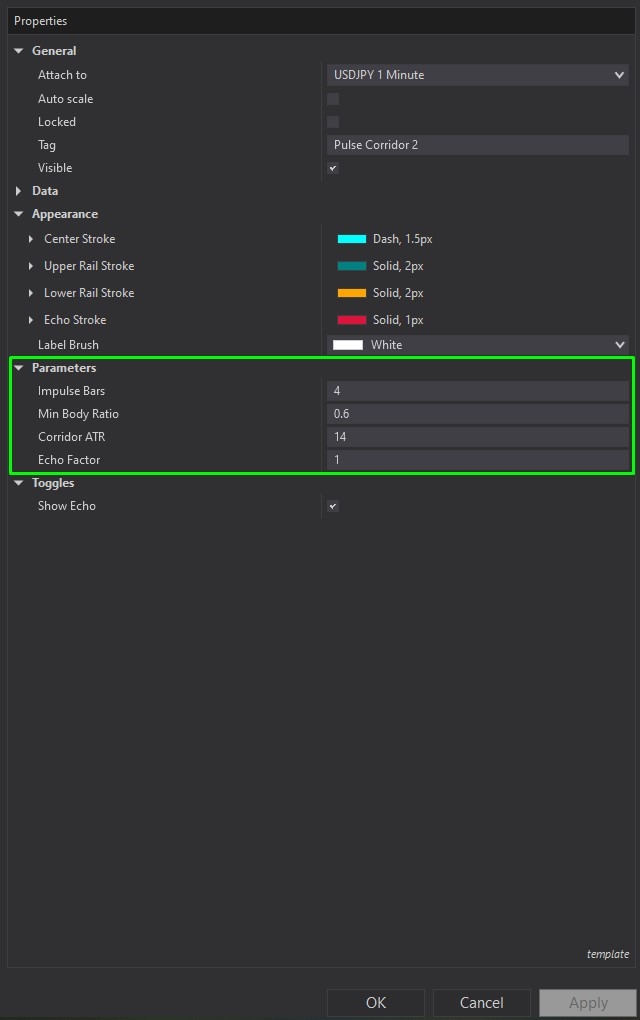
The Parameters section, illustrated in Image 5 (highlighted by a green rectangle), controls the fundamental detection and calculation logic. The Impulse Bars parameter defines the minimum number of consecutive same-direction bars required to qualify as a valid impulse—higher values (e.g., 8, 10, 12 bars) demand stronger, longer momentum pushes before corridor formation, filtering out brief spurts that lack follow-through conviction. Lower values (e.g., 4, 5, 6 bars) allow faster reaction to shorter momentum bursts, suitable for lower timeframes or volatile instruments where impulses develop rapidly.
The Minimum Body Ratio parameter sets the body-to-range threshold for impulse candles, filtering out bars with disproportionate wicks relative to real body size. A value of 0.6 requires at least 60% of each bar's range to be real body rather than wicks, ensuring impulse bars demonstrate genuine directional conviction rather than indecisive price action. Increasing this value (e.g., 0.7, 0.8) creates stricter detection focusing only on the most powerful, decisive candles. Lowering it (e.g., 0.5, 0.4) provides more flexible detection allowing impulses with moderate wick presence.
The Corridor ATR parameter defines the ATR period used for corridor width calculation—the rails position themselves at distances from the centre line based on this ATR measurement. Higher ATR periods (e.g., 20, 30) create smoother, more stable corridor width that responds gradually to volatility changes, appropriate for swing trading approaches valuing consistency over reactivity. Lower ATR periods (e.g., 10, 14) produce more responsive corridors that quickly adapt to recent volatility shifts, suitable for day trading and scalping where current conditions matter more than longer-term averages.
The Echo Factor parameter scales the continuation projection—a value of 1.0 creates a measured move projection that mirrors the original impulse distance, effectively doubling the move from anchor start through echo target. Higher echo factors (e.g., 1.5, 2.0) extend projections further creating more aggressive continuation targets suitable for strong trending conditions or when seeking extended profit objectives. Lower echo factors (e.g., 0.5, 0.75) produce conservative targets appropriate for choppy conditions or when taking quick profits becomes priority.
The Toggles subsection provides behavioural controls. The Show Echo parameter, when enabled, displays the forward projection line and includes the echo target value in the on-chart label, providing complete continuation framework with visual reference and numerical target. When disabled, the corridor structure remains fully functional with centre line and rails, but the projection disappears creating cleaner presentation focused purely on the momentum lane structure without target extensions—useful for traders who prefer using the corridor solely for directional bias and pullback entries rather than measured move targeting.
With full NinjaScript source code included, advanced users can modify the impulse detection logic to incorporate additional filters such as volume confirmation or momentum indicator alignment, adjust the regression calculation methodology to implement weighted linear regression or polynomial fitting, alter the ATR-based rail positioning to use standard deviation bands or custom volatility metrics, integrate the impulse strength calculation into automated strategy entry filters, create alert systems that distinguish between centre line pullbacks versus rail breakouts, or build sophisticated position sizing frameworks that scale risk based on impulse strength readings without restrictions.
If you have questions about Pulse Corridor, refer to the comprehensive video tutorial above for detailed guidance.
Secure payment via PayPal
By downloading, you agree with our Terms & Conditions

