Mega Sale 50% OFF All Products & Memberships | Limited time onlyUse code RCSALE50ALL
Click to play video

Tutorial with Source Code
Please Register for FREE account or Login to purchase this source code.
By downloading, you agree with our Terms & Conditions
The Purpose Edge Bands is a sophisticated drawing tool developed for NinjaTrader 8 and 8.1. It specialises in identifying fair value equilibrium from user-defined anchor points and mapping robust volatility edges by calculating a dynamic equilibrium core line, then projecting inner and outer bands based on Median Absolute Deviation (MAD) calculations that remain stable during sharp price spikes, providing traders with clear visual frameworks showing when price is balanced, stretched, or reaching extremes where rotation or expansion becomes likely. When you purchase the Purpose Edge Bands from Rize Capital, you receive the complete NinjaScript source code, providing total freedom to modify the equilibrium calculation methodology, customise the MAD-based band distance parameters and visual appearance settings, or integrate the anchored fair value logic into your own trading frameworks with no restrictions whatsoever. For a detailed overview, check out our video tutorial above.
See how the Purpose Edge Bands - NinjaTrader 8 Drawing Tool looks in action with these screenshots
Learn how to use the Purpose Edge Bands - NinjaTrader 8 Drawing Tool
The Purpose Edge Bands Drawing Tool for NinjaTrader 8 specialises in anchored fair value identification and robust volatility band construction by establishing user-defined starting points, calculating dynamic equilibrium core lines that represent fair value from the anchor forward, and projecting inner and outer bands using Median Absolute Deviation (MAD) methodology that resists distortion from outlier candles and sharp volatility spikes. The core functionality revolves around MAD-based dispersion measurement combined with anchored equilibrium visualisation that transforms price action into structured zones showing balance, stretch, and extreme conditions.
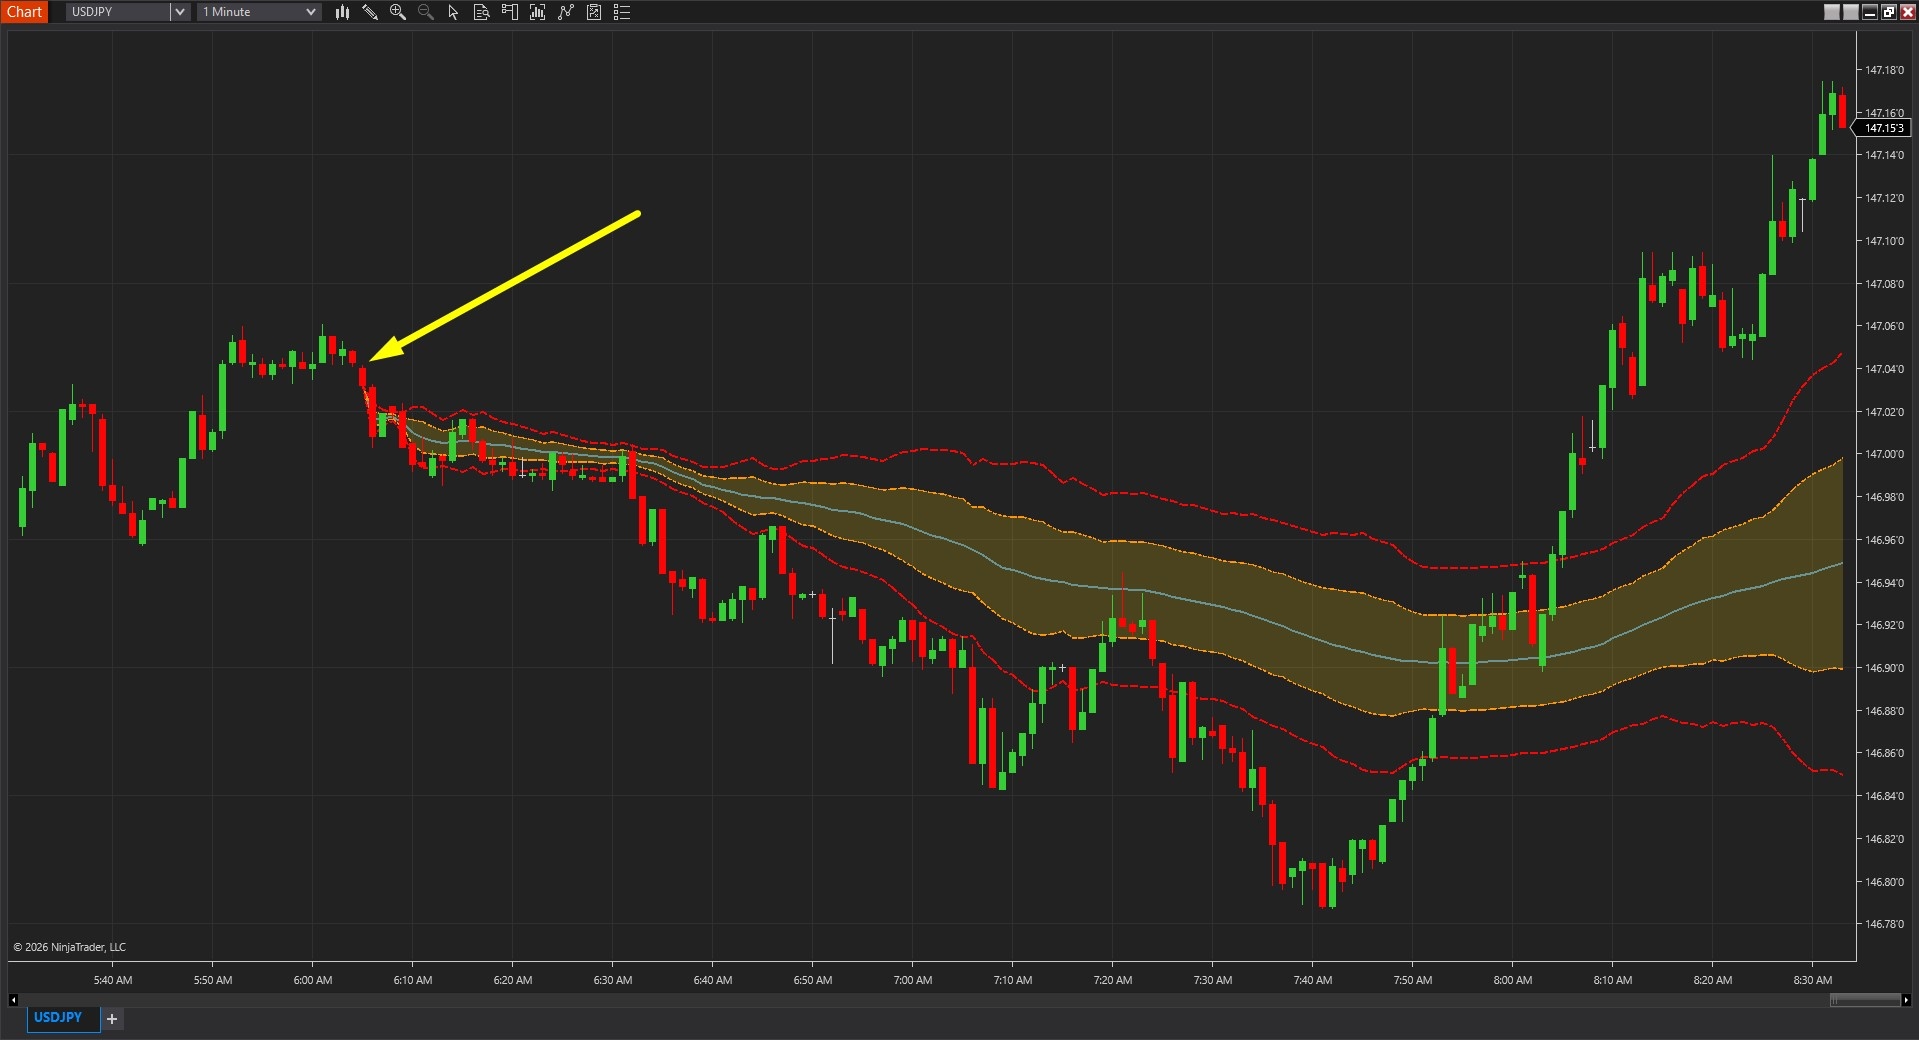
As shown in Image 1 (pointed by a yellow arrow), traders place Anchor A at a significant chart moment—session start, news event, breakout point, or trend initiation. Unlike traditional indicators that recalculate across entire history, Purpose Edge Bands anchors from this specific point forward, establishing context-relevant fair value relative to the chosen reference. Once the anchor is placed, the tool immediately plots the equilibrium core line extending forward (pointed by white arrows), representing the dynamic fair value centre around which price oscillates.
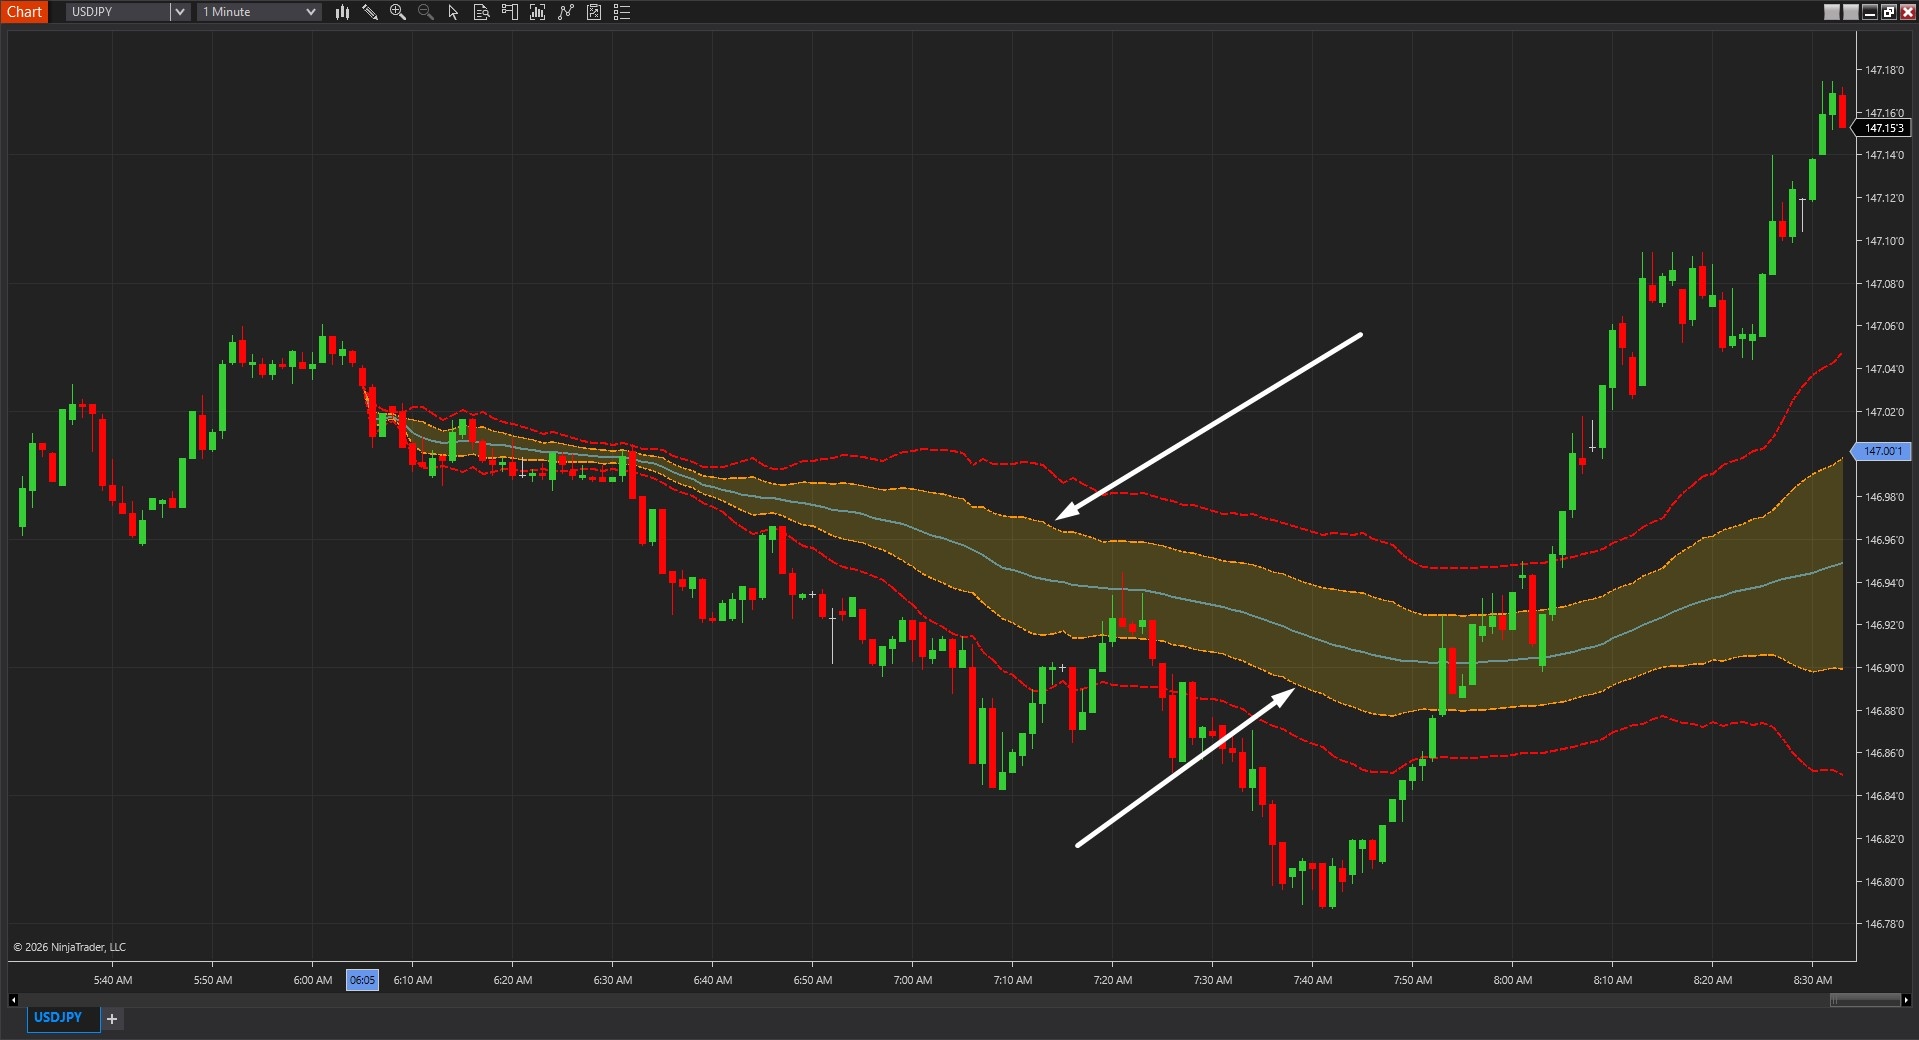
The tool goes beyond simple moving average channels by incorporating MAD-based volatility measurement that provides robustness against outliers. In Image 2 (pointed by white arrows), the inner bands appear at distances determined by the K1 multiplier applied to MAD calculations—these bands create the "working zone" around fair value where normal price oscillation occurs. Price touching inner bands suggests stretched conditions relative to equilibrium but not extreme moves. The outer bands (pointed by yellow arrows) appear at greater distances determined by the K2 multiplier, marking volatility extremes where price has travelled significantly beyond normal dispersion and may exhaust or transition into breakout expansion.
The visual framework's critical advantage lies in MAD's resistance to sharp spikes. Traditional standard deviation-based bands (like Bollinger Bands) widen dramatically when single large candles appear, distorting the entire framework and reducing its relevance. Purpose Edge Bands using MAD methodology remains stable during such events—one outlier spike doesn't artificially expand the bands, maintaining consistent structure that reflects typical dispersion rather than being skewed by anomalies. This stability ensures the bands remain actionable reference points even in volatile, news-driven markets.
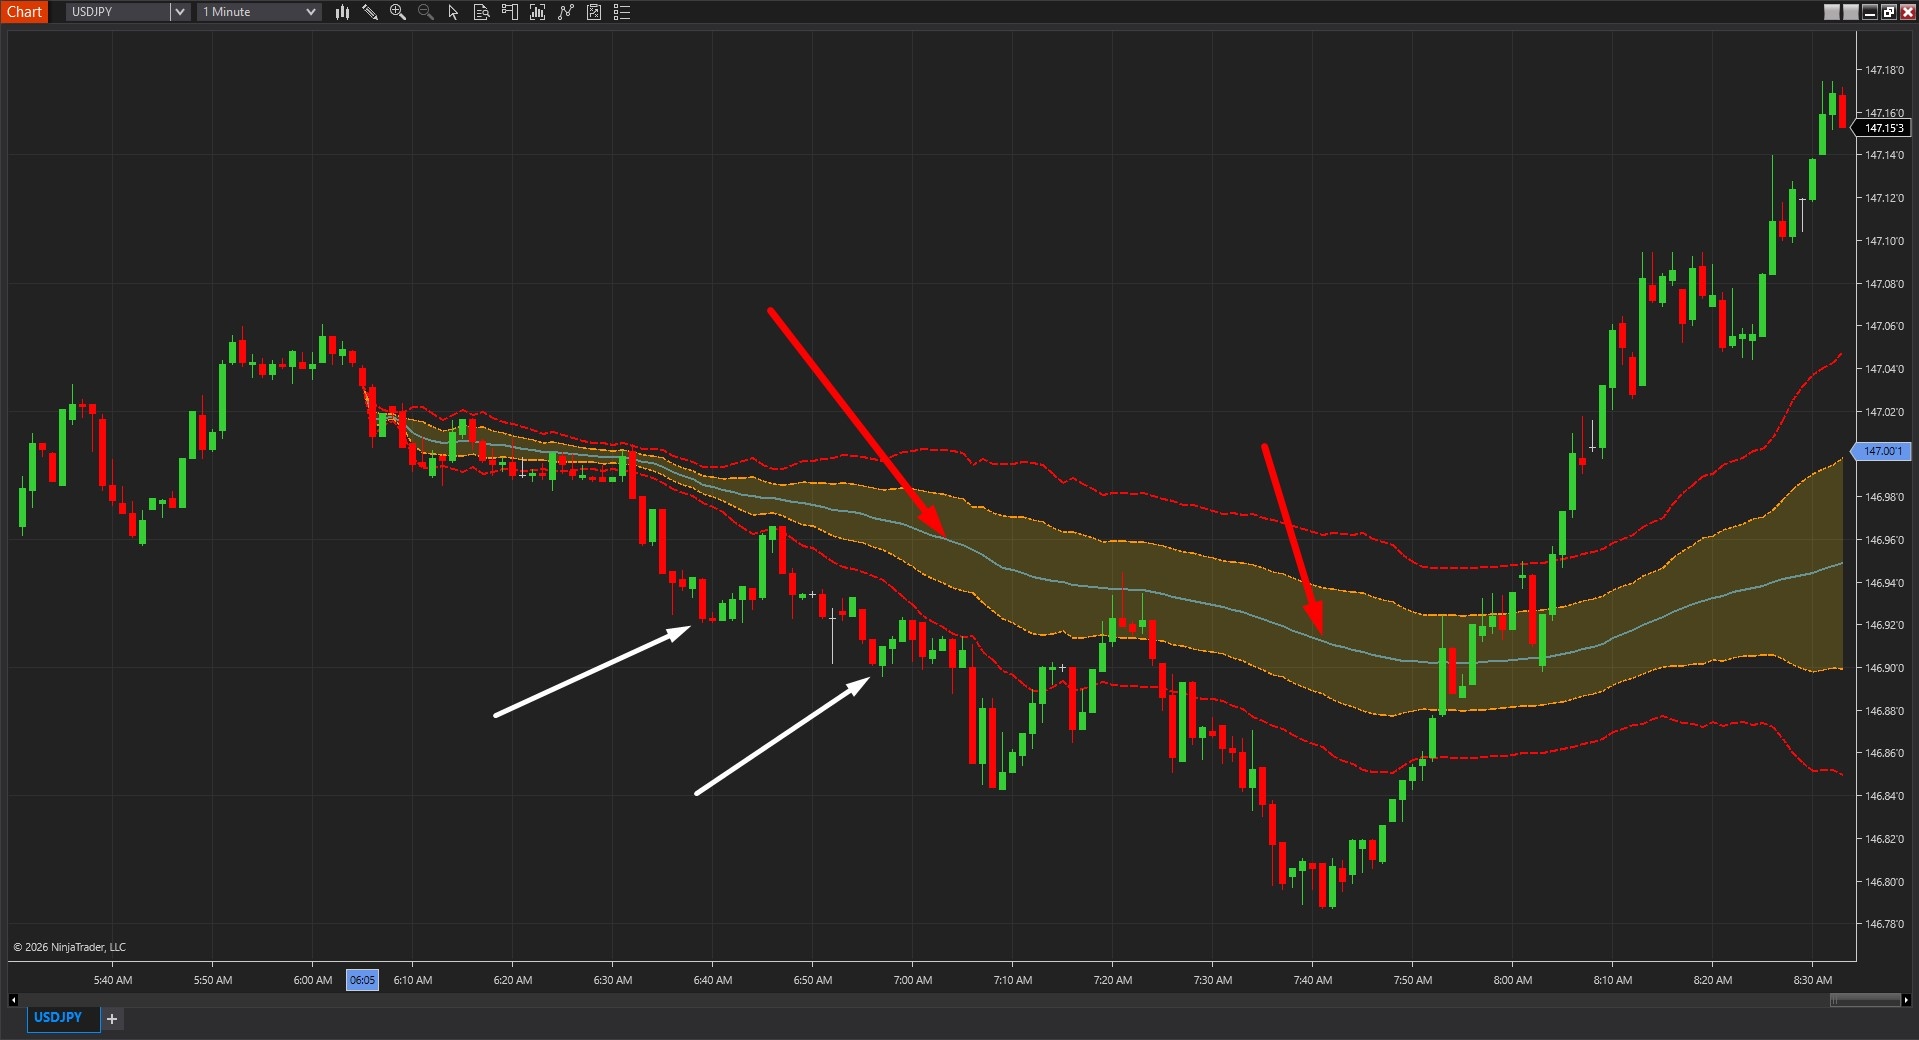
The equilibrium core line serves as the primary fair value reference, illustrated in Image 3 (pointed by red arrows). When price consistently gravitates back toward the core line—oscillating above and below with regular crossovers—the market demonstrates rotational behaviour. This equilibrium-seeking action suggests mean reversion strategies become appropriate, with trades taken at band extremes targeting returns to core. When price holds persistently on one side of the core without returning (pointed by white arrows)—remaining above for extended periods or below for sustained duration—the market exhibits directional expansion. This persistent deviation suggests trend-following approaches become favourable rather than counter-trend reversals.
The core line's anchored nature provides context-specific fair value rather than arbitrary rolling averages. Fair value relative to the overnight session start differs meaningfully from fair value relative to a post-Fed announcement move—Purpose Edge Bands allows traders to define which reference point matters for their current analysis, creating relevant structure rather than generic calculations that ignore market context.
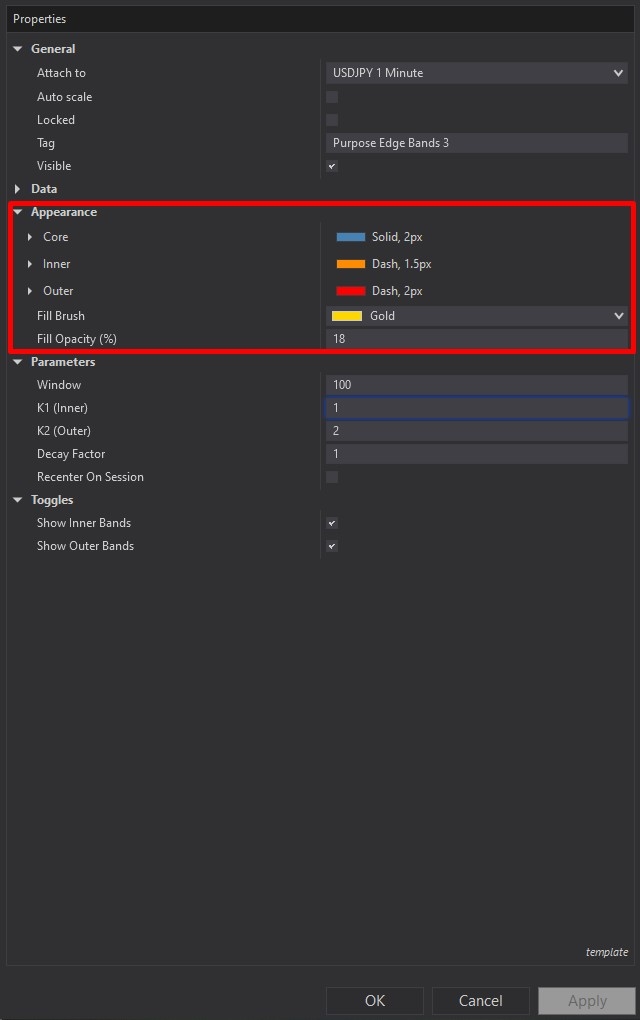
Purpose Edge Bands offers comprehensive customisation through its settings panel. The Appearance section, highlighted by a red rectangle in Image 4, controls visual presentation of all band elements. The Core parameter customises the equilibrium line appearance including colour, thickness, and dash style options. Traders seeking prominent fair value reference often increase thickness for immediate visibility, whilst those preferring subtle structure might use dashed styling with moderate thickness that provides reference without dominating the chart.
The Inner parameter controls the inner band styling—many traders employ lighter colours or dashed lines reflecting that inner bands represent the working zone rather than extreme boundaries. This visual distinction helps instantly differentiate between normal stretch (inner band touches) and significant deviation (outer band approaches). The Outer parameter determines outer band styling, with most traders using bold, solid lines in contrasting colours ensuring these extreme markers are instantly recognisable during rapid price action.
The Fill Brush setting establishes the colour used between inner bands, creating a shaded "fair value zone" that visualises the equilibrium region. The Fill Opacity parameter controls transparency of this shading—higher opacity values create prominent visual zones emphasising the fair value area, lower opacity maintains price action visibility whilst providing subtle zone identification. This balance allows traders to adapt visual emphasis based on personal preference and chart complexity.
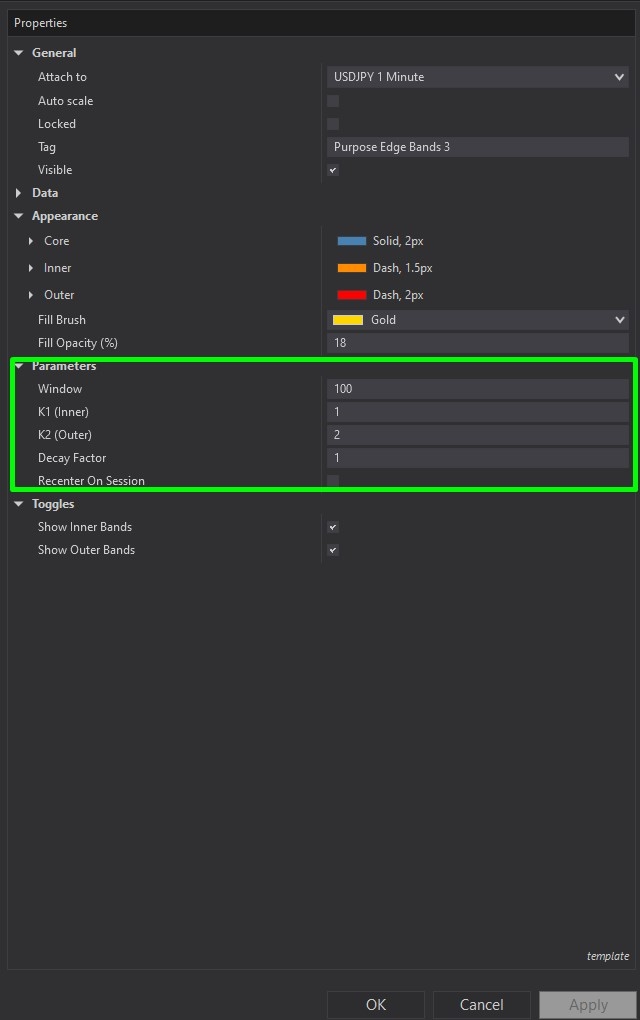
The Parameters section, illustrated in Image 5 (highlighted by a green rectangle), controls fundamental calculation logic. The Window parameter defines the rolling sample size used for MAD computation—higher window values (e.g., 50, 100 bars) create smoother, slower-changing bands that respond gradually to volatility shifts, appropriate for swing trading approaches valuing stability. Lower window values (e.g., 20, 30 bars) produce more responsive bands that quickly adapt to recent volatility changes, suitable for day trading and scalping where current conditions matter more than longer-term averages.
The K1 Inner parameter sets the multiplier determining inner band distance from the equilibrium core. Higher K1 values (e.g., 2.0, 2.5) widen the inner zone creating more generous working areas where price oscillates normally before being considered stretched. Lower K1 values (e.g., 1.0, 1.5) tighten the inner zone producing more frequent interactions, appropriate for lower timeframes or strategies requiring sensitive stretch detection. This multiplier directly affects how often price reaches "stretched" status relative to fair value.
The K2 Outer parameter controls outer band distance through multiplication of MAD measurements. Higher K2 values (e.g., 3.5, 4.0) push outer bands further from equilibrium, reserving extreme classification for truly significant deviations appropriate when seeking high-conviction exhaustion or breakout signals. Lower K2 values (e.g., 2.5, 3.0) bring outer bands closer, triggering extreme status more frequently and suitable for volatile instruments where large moves occur regularly.
The Decay Factor parameter controls equilibrium calculation weighting—at a value of 1.0, the equilibrium maintains stable reference giving equal weight to all bars from anchor forward. Lowering the decay factor (e.g., 0.95, 0.90) increases weighting of recent bars, causing the equilibrium to adapt faster to current price behaviour. This adjustment affects whether the core line represents consistent fair value from anchor start or continuously evolving fair value that follows recent price.
The Recenter On Session toggle, when enabled, causes the tool to re-anchor relative to the latest session boundary rather than maintaining the original manually placed anchor. This session-aware behaviour makes the equilibrium more context-driven for the current trading session, automatically adjusting fair value reference as new sessions begin. When disabled, the tool maintains the original anchor point regardless of session changes, preserving continuity of fair value reference across multiple sessions.
The Toggles subsection provides display controls. Show Inner Bands toggles inner rail visibility—disabling this creates cleaner presentation showing only core equilibrium and outer extremes, useful for traders focusing exclusively on major deviations rather than intermediate stretch. Show Outer Bands controls outer rail visibility—disabling displays only core and inner bands, appropriate for pure mean reversion approaches that don't utilise extreme boundary reference.
With full NinjaScript source code included, advanced users can modify the MAD calculation methodology to incorporate weighted MAD or alternative robust dispersion metrics, adjust the equilibrium calculation to implement exponentially weighted moving equilibrium or volume-weighted fair value, alter the K1 and K2 application logic to use asymmetric multipliers for upper versus lower bands, integrate additional anchor types such as volume profile-based anchoring or VWAP-relative positioning, create automated strategy frameworks that adjust position sizing based on distance from core equilibrium, or build sophisticated alert systems that distinguish between inner band stretch versus outer band extremes without restrictions.
If you have questions about Purpose Edge Bands, refer to the comprehensive video tutorial above for detailed guidance.
Secure payment via PayPal
By downloading, you agree with our Terms & Conditions

