Click to play video
Tutorial with Source Code
Please Register for FREE account or Login to purchase this source code.
By downloading, you agree with our Terms & Conditions
The Range Pulse Boxes is a drawing tool developed for NinjaTrader 8 and 8.1. It specialises in identifying market contraction phases and projecting expansion forecasts by scanning price action for tight, quiet periods where true range compression occurs, automatically highlighting these contraction pulses with visual boxes, and projecting forward-looking forecast zones that estimate the next likely range expansion in both size and direction based on recent expansion behaviour patterns. When you purchase the Range Pulse Boxes from Rize Capital, you receive the complete NinjaScript source code, providing total freedom to modify the contraction detection algorithms, customise the expansion forecast methodology and visual appearance parameters, or integrate the compression-expansion cycle logic into your own trading frameworks with no restrictions whatsoever. For a detailed overview, check out our video tutorial above.
See how the Range Pulse Boxes - NinjaTrader 8 Drawing Tool looks in action with these screenshots
Learn how to use the Range Pulse Boxes - NinjaTrader 8 Drawing Tool
The Range Pulse Boxes Drawing Tool for NinjaTrader 8 specialises in compression-expansion cycle identification by analysing true range percentile behaviour across defined price windows, automatically detecting contraction phases where candle ranges fall below low percentile thresholds indicating market compression, and projecting forecast boxes forward that estimate subsequent expansion magnitude and direction based on statistical analysis of recent high-percentile expansion moves. The core functionality revolves around percentile-based contraction filtering combined with expansion modelling that transforms raw volatility cycles into structured visual frameworks showing where energy accumulates and where it likely releases.
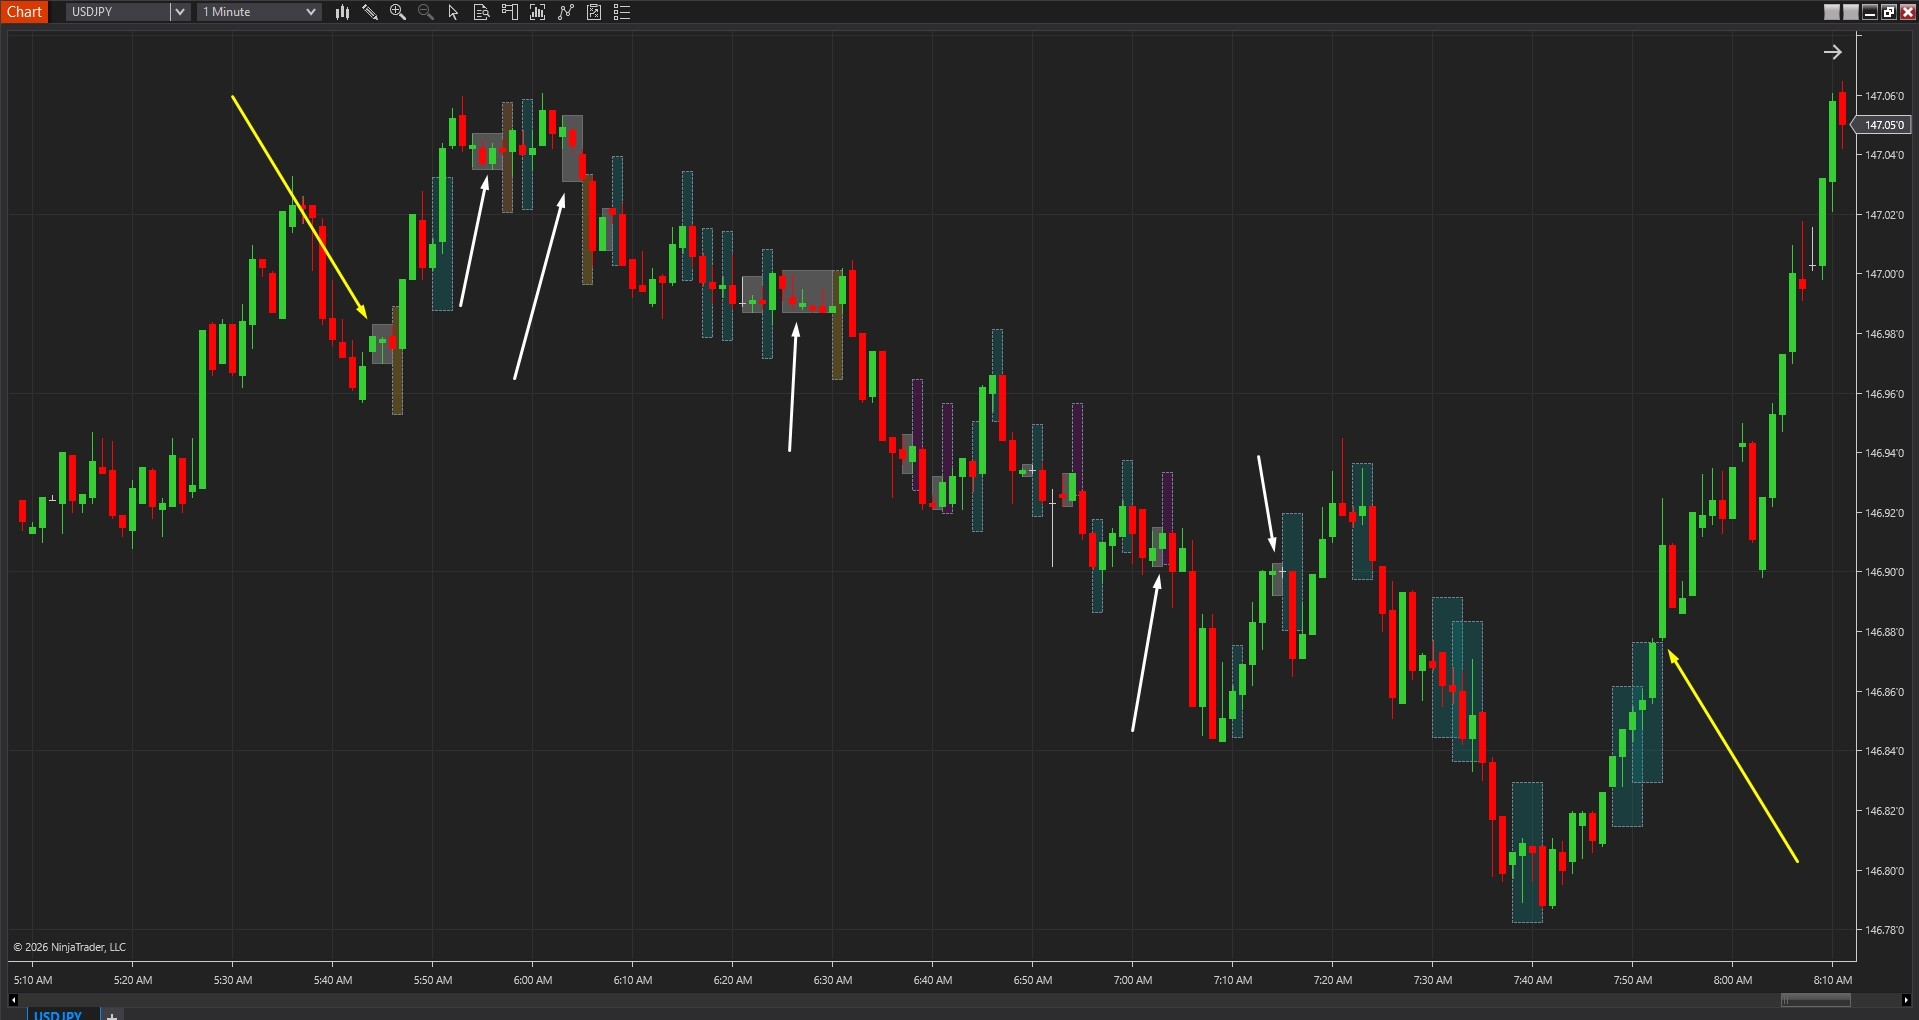
As shown in Image 1 (pointed by yellow arrows), traders place Anchor A at the beginning of the analysis window and Anchor B at the end, defining the specific period for contraction-expansion scanning. The tool immediately analyses true range behaviour across this window, identifying phases where consecutive candles demonstrate compressed ranges falling below the TR Low Percentile threshold. These contraction phases appear as light grey boxes (pointed by white arrows) marking quiet periods where the market tightens, consolidates, and potentially builds energy for subsequent expansion moves.
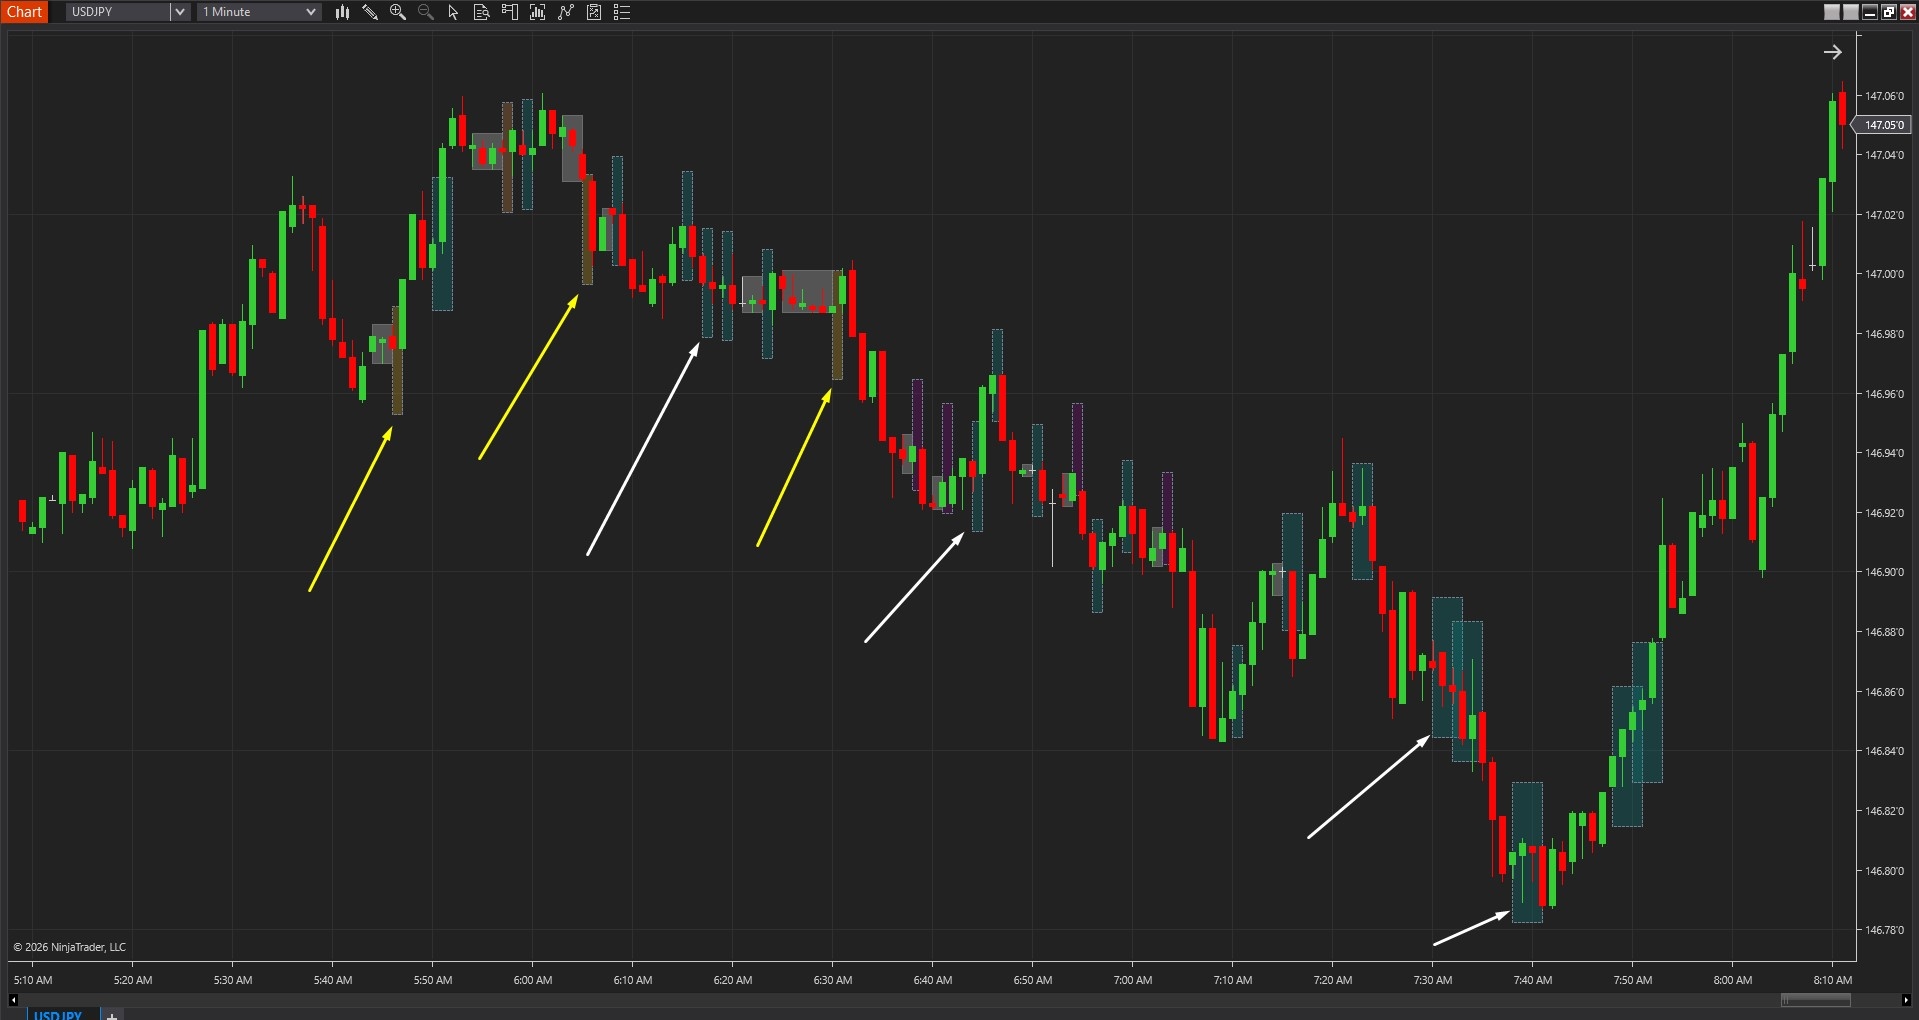
The tool goes beyond simple range identification by projecting forward-looking forecast boxes that estimate the next expansion characteristics. In Image 2 (pointed by white arrows), teal-coloured forecast boxes extending from contraction zones represent upside expansion projections—the tool expects the next volatility pulse to move upward based on analysis of recent expansion behaviour and directional drift during compression. Brown-toned forecast boxes (pointed by yellow arrows) indicate downside expansion projections, suggesting the next pulse will likely move lower. The forecast box dimensions represent both expected range (height) and expected duration (width) derived from recent expansion statistics.
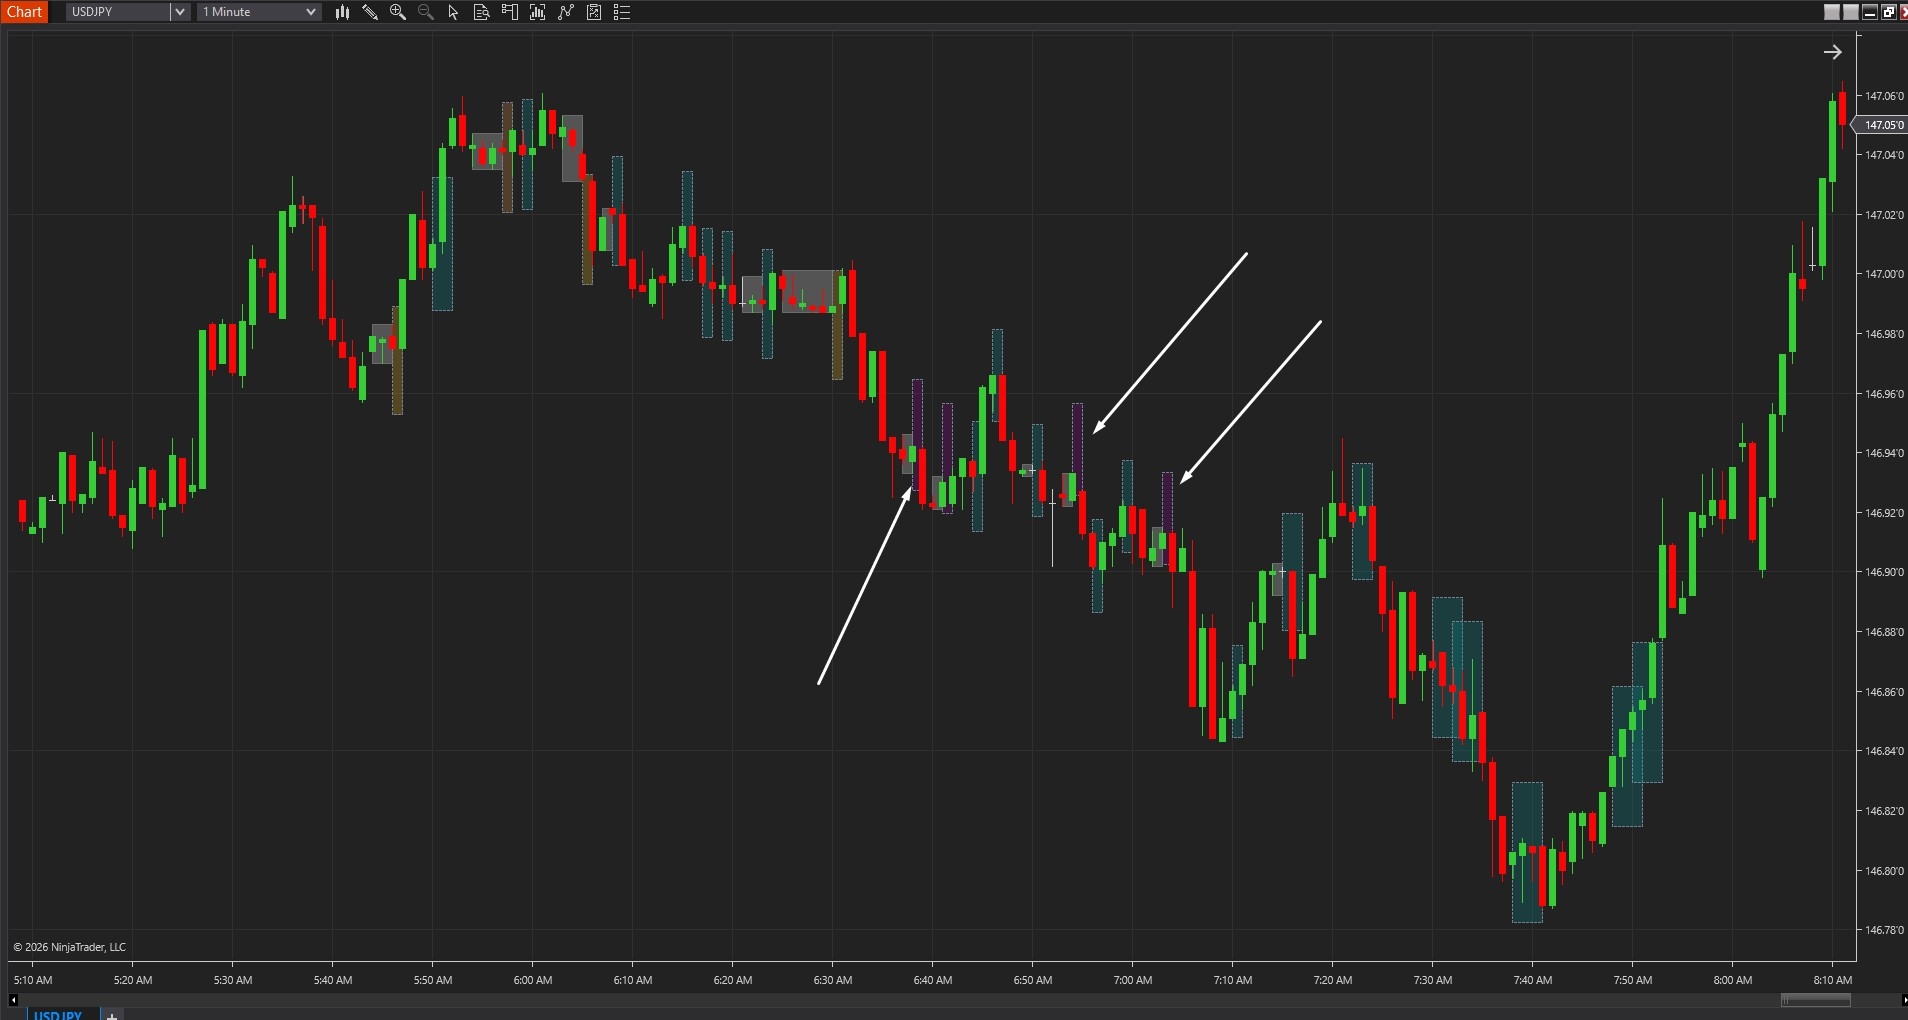
The visual framework includes directional bias indication through contraction box colouring when meaningful drift occurs during compression. As shown in Image 3 (pointed by white arrows), purple-tinted contraction boxes signal bullish drift—price gradually trending higher within the compression phase, suggesting upward pressure building during the coil. Golden-tinted contraction boxes indicate bearish drift—downward bias developing within compression, suggesting selling pressure accumulating. Neutral grey contraction boxes show balanced compression without significant directional drift, indicating the expansion could break either direction based purely on breakout momentum.
One of Range Pulse Boxes' most powerful features involves dynamic anchor adjustment for real-time analysis. Unlike static indicators, traders can click and drag Anchor A or Anchor B at any time to resize the scan window—moving Anchor B forward to include newly formed bars causes immediate recalculation of contraction detection and forecast projection. This dynamic capability allows continuous structure updates as the market evolves.
During live trading sessions, traders reposition anchors to focus exclusively on current session behaviour, the most recent impulse leg, or developing range structures. When new contraction phases form, extending Anchor B captures them immediately, generating fresh forecast boxes that reflect latest compression-expansion patterns. This real-time adaptability ensures the tool remains relevant to current market conditions rather than displaying outdated analysis based on stale anchor positions.
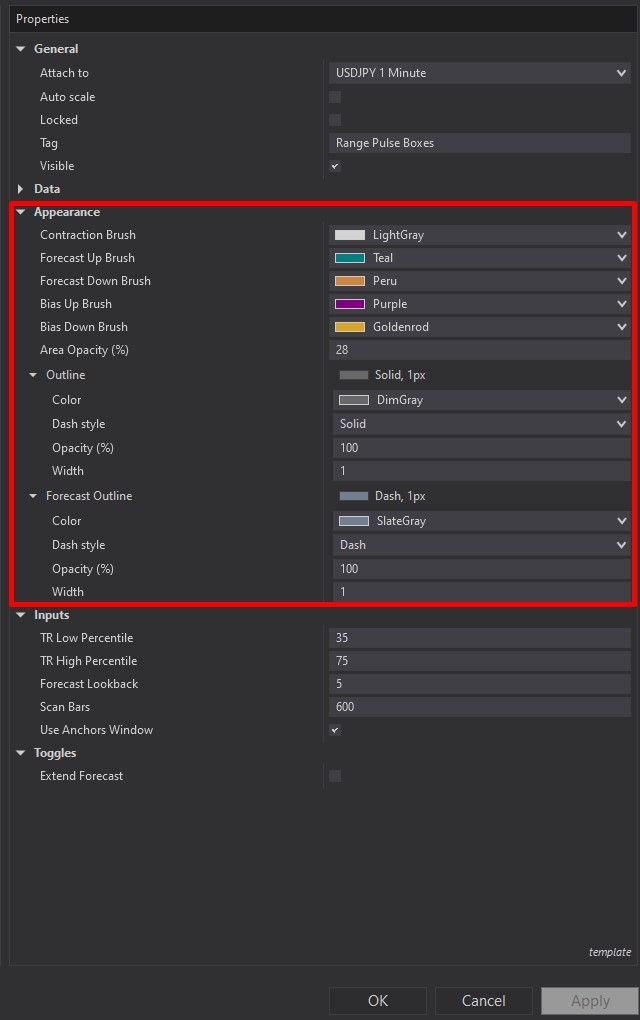
Range Pulse Boxes offers comprehensive customisation through its settings panel. The Appearance section, highlighted by a red rectangle in Image 4, controls visual presentation of all box elements. The Contraction Brush parameter (default light grey) determines the fill colour for contraction pulse boxes representing quiet compression phases—traders can adjust this to match chart themes whilst maintaining clear differentiation from price action and forecast zones.
The Forecast Up Brush setting (default teal) controls forecast box colour when expansion is projected upward, typically using bullish colours to communicate expected upside movement. The Forecast Down Brush parameter (default Peru/brown) determines colouring for downside expansion projections, conventionally employing bearish tones. The Bias Up Brush (default purple) highlights contraction boxes when meaningful upward drift occurs during compression, whilst the Bias Down Brush (default golden) identifies downward-drifting compression phases.
The Area Opacity Percent parameter (default 28%) controls transparency for all filled zones—lower opacity values maintain price candle visibility whilst providing subtle structure indication, higher opacity creates more prominent visual emphasis on compression and forecast areas. The Outline setting controls contraction box border styling with default solid, 1-pixel borders, whilst the Forecast Outline parameter uses dashed, 1-pixel borders by default, visually separating projected ranges from confirmed contraction structures.
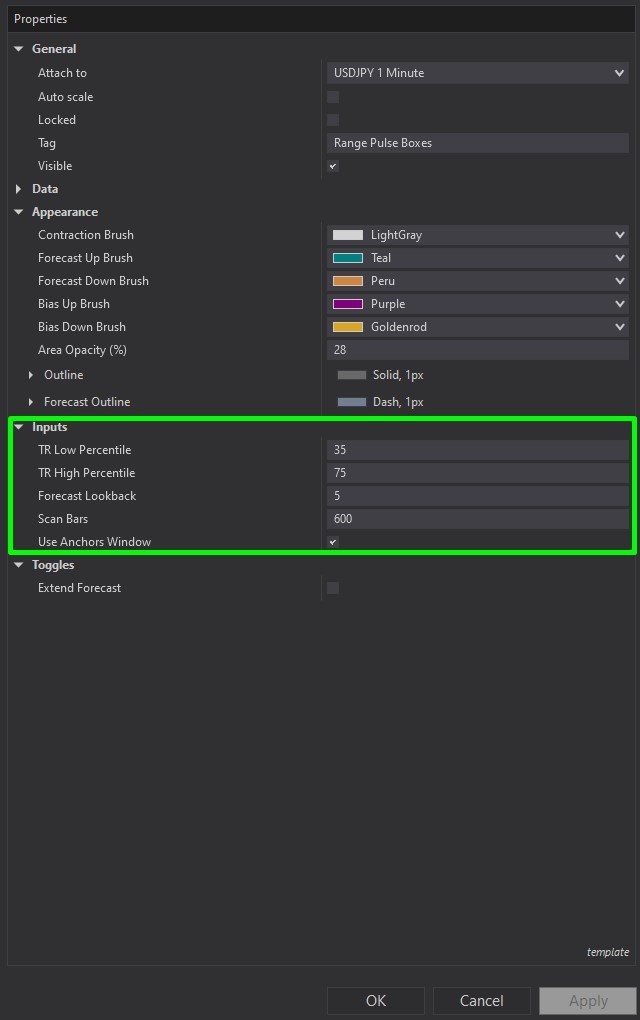
The Inputs section, illustrated in Image 5 (highlighted by a green rectangle), controls fundamental detection and projection logic. The TR Low Percentile parameter (default 35) defines what qualifies as contraction—this percentile threshold establishes the true range level below which candles are considered "quiet" or compressed. Lower values (e.g., 20, 25) require tighter compression creating more selective contraction detection that identifies only the most extreme quiet periods. Higher values (e.g., 40, 50) allow broader quiet periods to qualify as contraction, generating more frequent but potentially less significant compression identifications.
The TR High Percentile parameter (default 75) defines what qualifies as expansion when constructing the forecast model—this threshold determines which historical moves are considered "expansion" samples used for projection calculations. Higher values (e.g., 80, 85) create more aggressive expansion references using only the largest historical moves for forecasting, producing wider, more ambitious forecast boxes. Lower values (e.g., 65, 70) include more moderate expansion moves in the sample set, generating more conservative forecast projections.
The Forecast Lookback parameter (default 5) determines how many recent expansion samples are analysed to estimate projected range size and duration. Smaller values (e.g., 2, 3) create highly responsive forecasts that react quickly to the most recent expansion behaviour, appropriate for fast-changing markets or lower timeframes. Larger values (e.g., 8, 10) smooth forecast calculations by incorporating more historical expansion data, producing more stable projections less affected by individual outlier moves.
The Scan Bars parameter (default 600) defines the historical depth analysed when anchors are not manually placed—the tool automatically scans this many bars backward to detect contraction-expansion cycles. Higher values provide comprehensive historical analysis capturing longer-term compression-expansion patterns, whilst lower values focus on recent behaviour with faster processing.
The Use Anchors Window toggle, when enabled (default), restricts analysis exclusively to the area between Anchor A and Anchor B, allowing focused examination of specific periods such as current sessions, particular swing legs, or notable volatility cycles. When disabled, the tool scans the full lookback period defined by Scan Bars regardless of anchor positioning, providing continuous detection across visible chart history.
The Extend Forecast toggle, when enabled, causes forecast boxes to extend to the right edge of the chart rather than terminating at their calculated duration endpoints. This creates persistent visual reference for projected expansion targets throughout the session. When disabled (default), forecast boxes display only their calculated duration, providing precise time-and-price projections that traders can measure against actual price development.
With full NinjaScript source code included, advanced users can modify the percentile calculation methodology to implement weighted percentiles favouring recent data, adjust the expansion forecast algorithms to incorporate additional factors such as volume confirmation or momentum indicators, alter the directional drift detection to use alternative bias measures like VWAP deviation or order flow imbalance, integrate the compression detection into automated strategy entry filters that only allow trades during expansion phases, create alert systems that distinguish between contraction formations versus breakout confirmations, or build sophisticated position sizing frameworks that scale risk based on contraction tightness and forecast magnitude without restrictions.
The source code package includes comprehensive documentation with clear overview sections explaining compression-expansion cycle concepts, detailed percentile calculation logic revealing how true range thresholds identify contraction and expansion phases, complete forecast projection algorithms demonstrating how recent expansion statistics extrapolate forward, directional drift detection methodology showing bias determination during compression, and parameter interaction explanations clarifying how percentile thresholds, lookback periods, and scan depth combine. This transparency facilitates both understanding and practical customisation even for traders with intermediate NinjaScript experience.
The code architecture supports educational purposes—developers can study professional volatility cycle detection methodology, understand how percentile-based analysis provides adaptive thresholds across different volatility regimes, examine the statistical approach to expansion forecasting based on historical behaviour patterns, and learn best practices for creating dynamic tools that respond to anchor repositioning in real-time. This knowledge transfers beyond the specific tool, improving overall volatility analysis and breakout trading capabilities.
If you have questions about Range Pulse Boxes, refer to the comprehensive video tutorial above for detailed guidance.
Secure payment via PayPal
By downloading, you agree with our Terms & Conditions

