🎄 Christmas Sale — 25% OFF EverythingUse Code: RCXMAS25ALLEnds Dec 25, 2025
Rize Capital Logo
Home
Free IndicatorFree Resources
IndicatorStrategyTutorial with Source Code
Ninjascript Programming TrainingCustom Programming
Rize Capital Logo
Rize Capital Logo
Home
Ninjascript Programming TrainingCustom Programming
Sign inCreate account

Registered address

Registered in England and Wales.
Registration # 12039916
53 Rodney Crescent, Filton,
Bristol BS34 7AF
United Kingdom

PayPal Secured

Information

  • Home
  • About Us
  • Support
  • Membership
  • Partner Program
  • Blog
  • Feedback Submission
  • Contact us
  • Terms & Conditions
  • Privacy Policy
  • Return & Refund Policy
  • Disclaimer
  • Cookies
  • Sitemap

Follow us

X
Facebook
Youtube
Instagram
LinkedIn

Resources

ninjatrader affiliateRize Capital Datafeed

Risk Disclosure: An investor could potentially lose all or more than the initial investment. Risk capital is money that can be lost without jeopardizing ones' financial security or life style. Only risk capital should be used for trading and only those with sufficient risk capital should consider trading. Past performance is not necessarily indicative of future results.

Hypothetical Performance Disclosure: Hypothetical performance results have many inherent limitations, some of which are described below. No representation is being made that any account will or is likely to achieve profits or losses similar to those shown; in fact, there are frequently sharp differences between hypothetical performance results and the actual results subsequently achieved by any particular trading program. One of the limitations of hypothetical performance results is that they are generally prepared with the benefit of hindsight. In addition, hypothetical trading does not involve financial risk, and no hypothetical trading record can completely account for the impact of financial risk of actual trading. for example, the ability to withstand losses or to adhere to a particular trading program in spite of trading losses are material points which can also adversely affect actual trading results. There are numerous other factors related to the markets in general or to the implementation of any specific trading program which cannot be fully accounted for in the preparation of hypothetical performance results and all which can adversely affect trading results.

Testimonials: Testimonials appearing on this website may not be representative of other clients or customers and is not a guarantee of future performance or success.

Live Trade Room: This presentation is for educational purposes only and the opinions expressed are those of the presenter only. All trades presented should be considered hypothetical and should not be expected to be replicated in a live trading account.

Additional Disclosure: Rize Capital Ltd, also known as rizecap.com assumes no responsibility for your investment and trading results. Past performance does not guarantee future performance and Rize capital Ltd does not make any performance representations or guarantees. Any chart or trading demonstration produced by Rize capital Ltd representing trades and using any methods of indicators or strategies on rizecap.com website or in any advertisement, seminar, brochure, magazine or online demonstrations are to be considered hypothetical trades and investments for educational purposes only. No trading system can guarantee profits or loss. Hypothetical trading results can be unreliable.

© Copyright 2019 - 2025 Rize Capital Ltd

Simple EMA Indicator - NinjaTrader 8 Indicator

EMAIndicatorNinjaTrader 8+3

Click to play video

Simple EMA Indicator - NinjaTrader 8 Indicator Video Thumbnail

Simple EMA Indicator - NinjaTrader 8 Indicator

Tutorial with Source Code

FREE
Lifetime Access

Key Features

  • Complete source code
  • Instant download access

By downloading, you agree with our Terms & Conditions

The Simple EMA Indicator for NinjaTrader 8 is a free trend analysis indicator that combines dual Exponential Moving Averages with intuitive visual arrow signals. This helps identify momentum shifts and optimal entry/exit points across all market conditions. Provided by Rize Capital, the Simple EMA Indicator delivers precise trend change identification for day trading, swing trading, and position strategies, operating flawlessly on any timeframe and market instrument. Watch the video tutorial to learn how this streamlined EMA crossover system can transform your trend analysis approach. Lastly, you also get the full source code ownership to make any custom changes.

Gallery

See how the Simple EMA Indicator - NinjaTrader 8 Indicator looks in action with these screenshots

image1.png
1 / 4
Click to zoom
Image - 1

Simple EMA Indicator - NinjaTrader 8 Indicator Details

Learn how to use the Simple EMA Indicator - NinjaTrader 8 Indicator

98words
1min read
2sections
image1.png
Click to ZOOM
Image - 1
image2.png
Click to ZOOM
Image - 2

This indicator combines two Exponential Moving Averages (EMAs) with visual arrow signals to help traders identify potential trend changes and entry/exit points in the market.

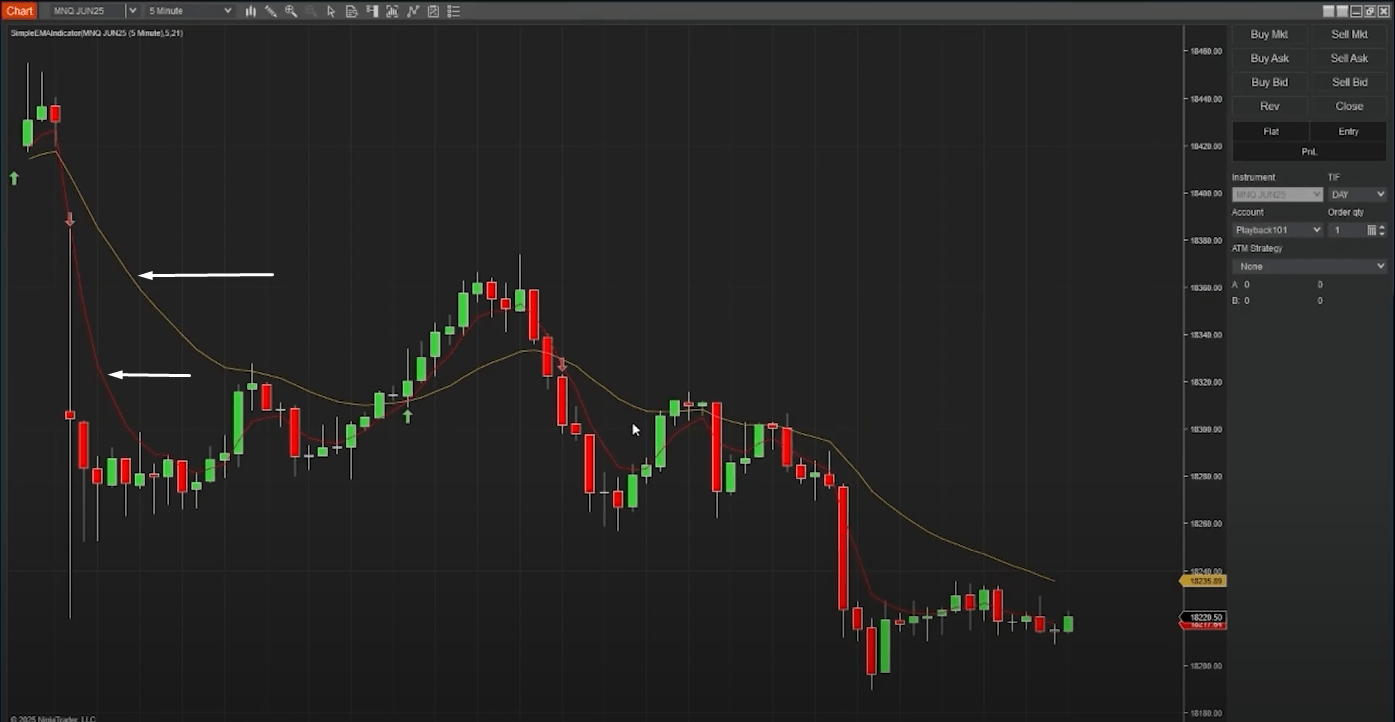
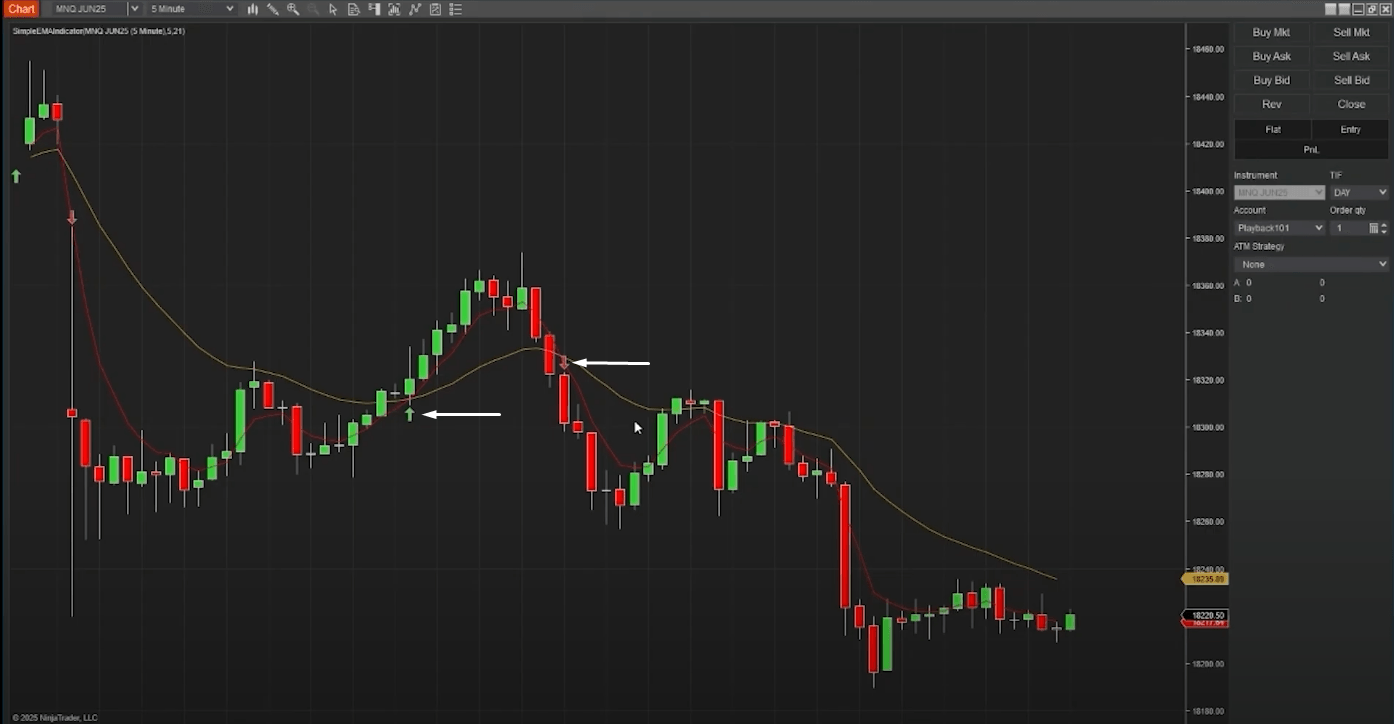
As pointed by white arrows in Image 1, the indicator plots two EMAs on the chart: a fast EMA (red line) and a slow EMA (golden rod/yellow line). When the fast EMA crosses above the slow EMA, indicating a potential bullish trend change, the indicator displays a lime green up arrow positioned below the low of the bar. Conversely, when the fast EMA crosses below the slow EMA, signalling a potential bearish trend change, it plots a crimson red down arrow above the high of the bar, as pointed by white arrows in Image 2.

The indicator is designed to work on the same panel as the price chart, overlaying the EMAs directly on the candlesticks or bars. The arrows are strategically positioned with a 5-tick offset from the bar's high or low to ensure clear visibility without cluttering the chart.

simpleema3.jpg
Click to ZOOM
Image - 3
simpleema4.jpg
Click to ZOOM
Image - 4

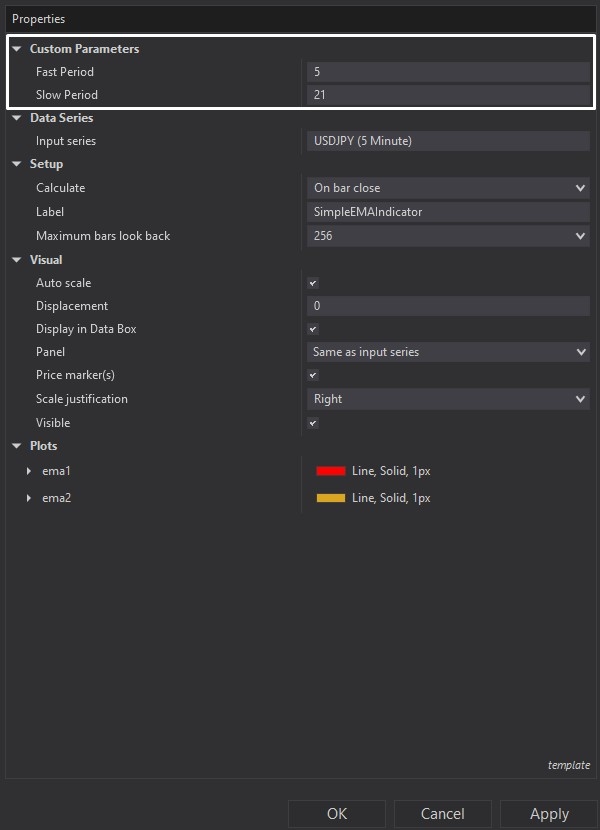
The indicator offers customisable parameters that can be adjusted to suit different trading strategies and market conditions. In Image 3, you can see the settings panel where traders can modify the Fast Period (default: 5) and Slow Period (default: 21). These parameters determine the sensitivity of the EMA crossover signals - shorter periods will generate more signals but may produce more false signals, while longer periods will produce fewer but potentially more reliable signals.

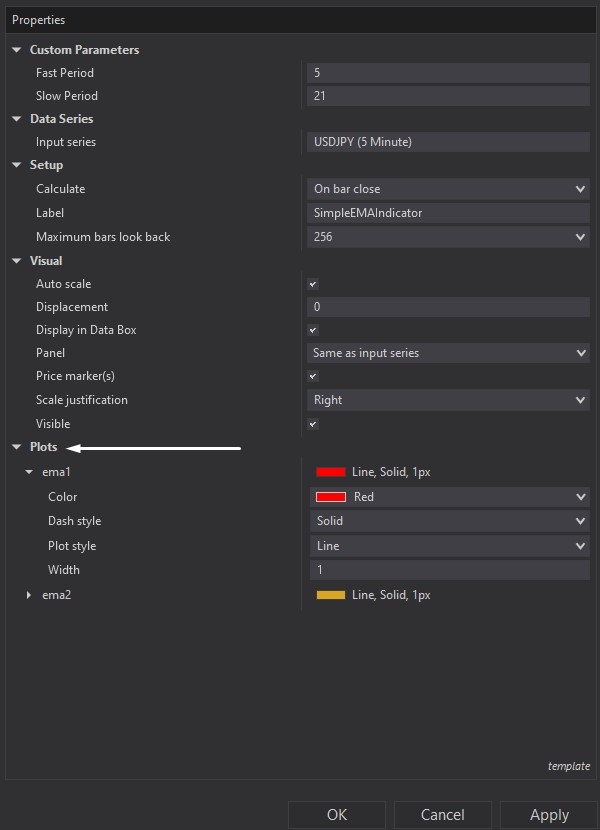
Image 4 shows the indicator's plot configuration options, where users can customise the appearance of both EMA lines, including colours and line styles.

The indicator works on any timeframe and market instrument supported by NinjaTrader 8. It's particularly effective for swing trading and trend-following strategies, helping traders identify momentum shifts in the market with clear visual confirmation through the colour-coded arrow system.

If you have any questions about the indicator's functionality or settings, please refer to the video tutorial above for a complete step-by-step guide on installation, customisation, and usage.

Get the Source Code

Free
Secure checkout required

No payment required

By downloading, you agree with our Terms & Conditions