Click to play video

Tutorial with Source Code
Please Register for FREE account or Login to purchase this source code.
By downloading, you agree with our Terms & Conditions
The StopHunt Sniper Pro is a sophisticated automated trading strategy developed for NinjaTrader 8 and 8.1. It specialises in capitalising on stop hunt liquidity events by detecting when price breaches key swing levels and snaps back towards the mean, automatically executing entries with multi-layered confirmation filters including volume spikes, candle body strength, and mean distance validation, whilst painting visual signals and displaying real-time profit and loss overlays directly on the chart. When you purchase the StopHunt Sniper Pro from Rize Capital, you receive the complete NinjaScript source code, providing total freedom to modify the detection algorithms, customise the entry execution logic and breakeven parameters, or integrate the strategy into your own automated trading systems with no restrictions whatsoever. For a detailed overview, check out our video tutorial above.
See how the StopHunt Sniper Pro - NinjaTrader 8 Strategy looks in action with these screenshots
Learn how to use the StopHunt Sniper Pro - NinjaTrader 8 Strategy
The StopHunt Sniper Pro Strategy for NinjaTrader 8 specialises in detecting liquidity sweep events where price temporarily breaches recent swing highs or lows to trigger stop losses before reversing back towards fair value, automatically executing mean reversion entries with comprehensive confirmation filters that validate volume spikes, candle body strength, and price distance from moving averages. The core functionality revolves around automated stop hunt detection combined with colour-coded visual feedback that provides real-time confirmation of trade execution and performance.
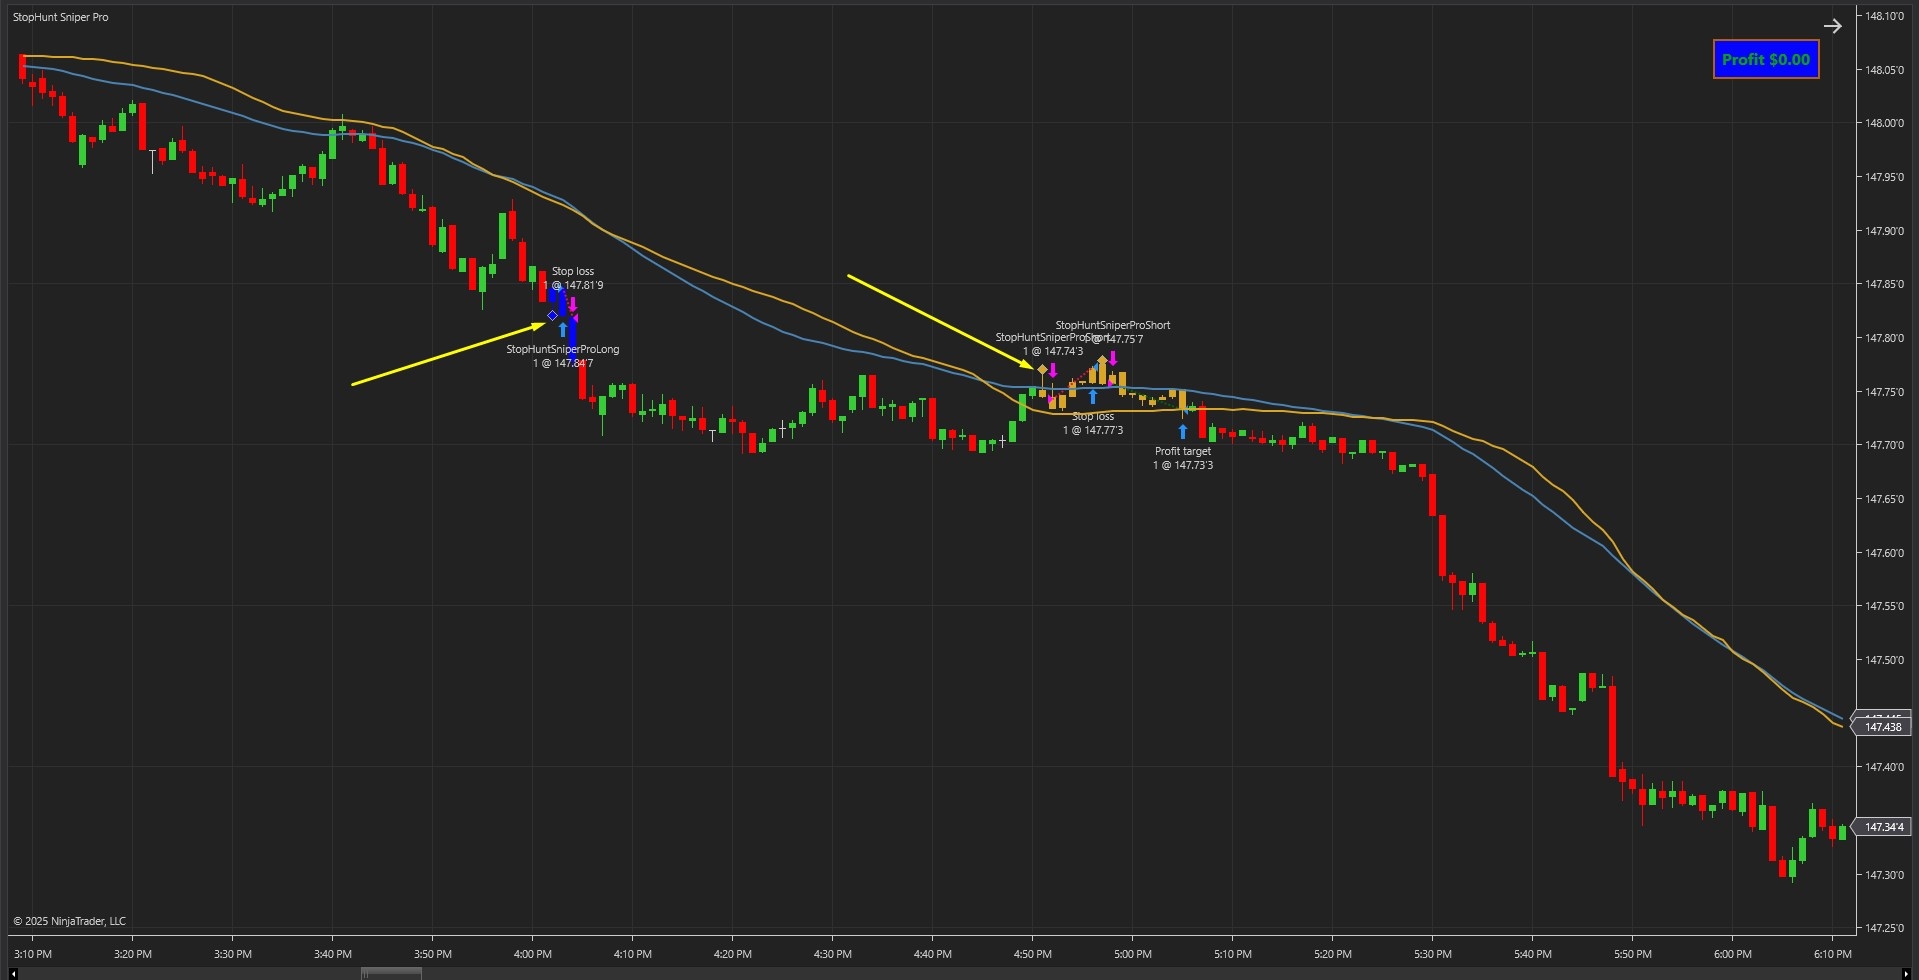
As shown in Image 1 (pointed by yellow arrows), diamond-shaped sweep markers appear when the strategy detects a liquidity event—moments where price pierces a significant swing level and closes back inside the range, suggesting trapped traders and potential reversal conditions. Blue painted bars represent active long positions triggered when a downside sweep occurs with proper confirmation, whilst golden rod painted bars indicate active short positions triggered by upside liquidity grabs.
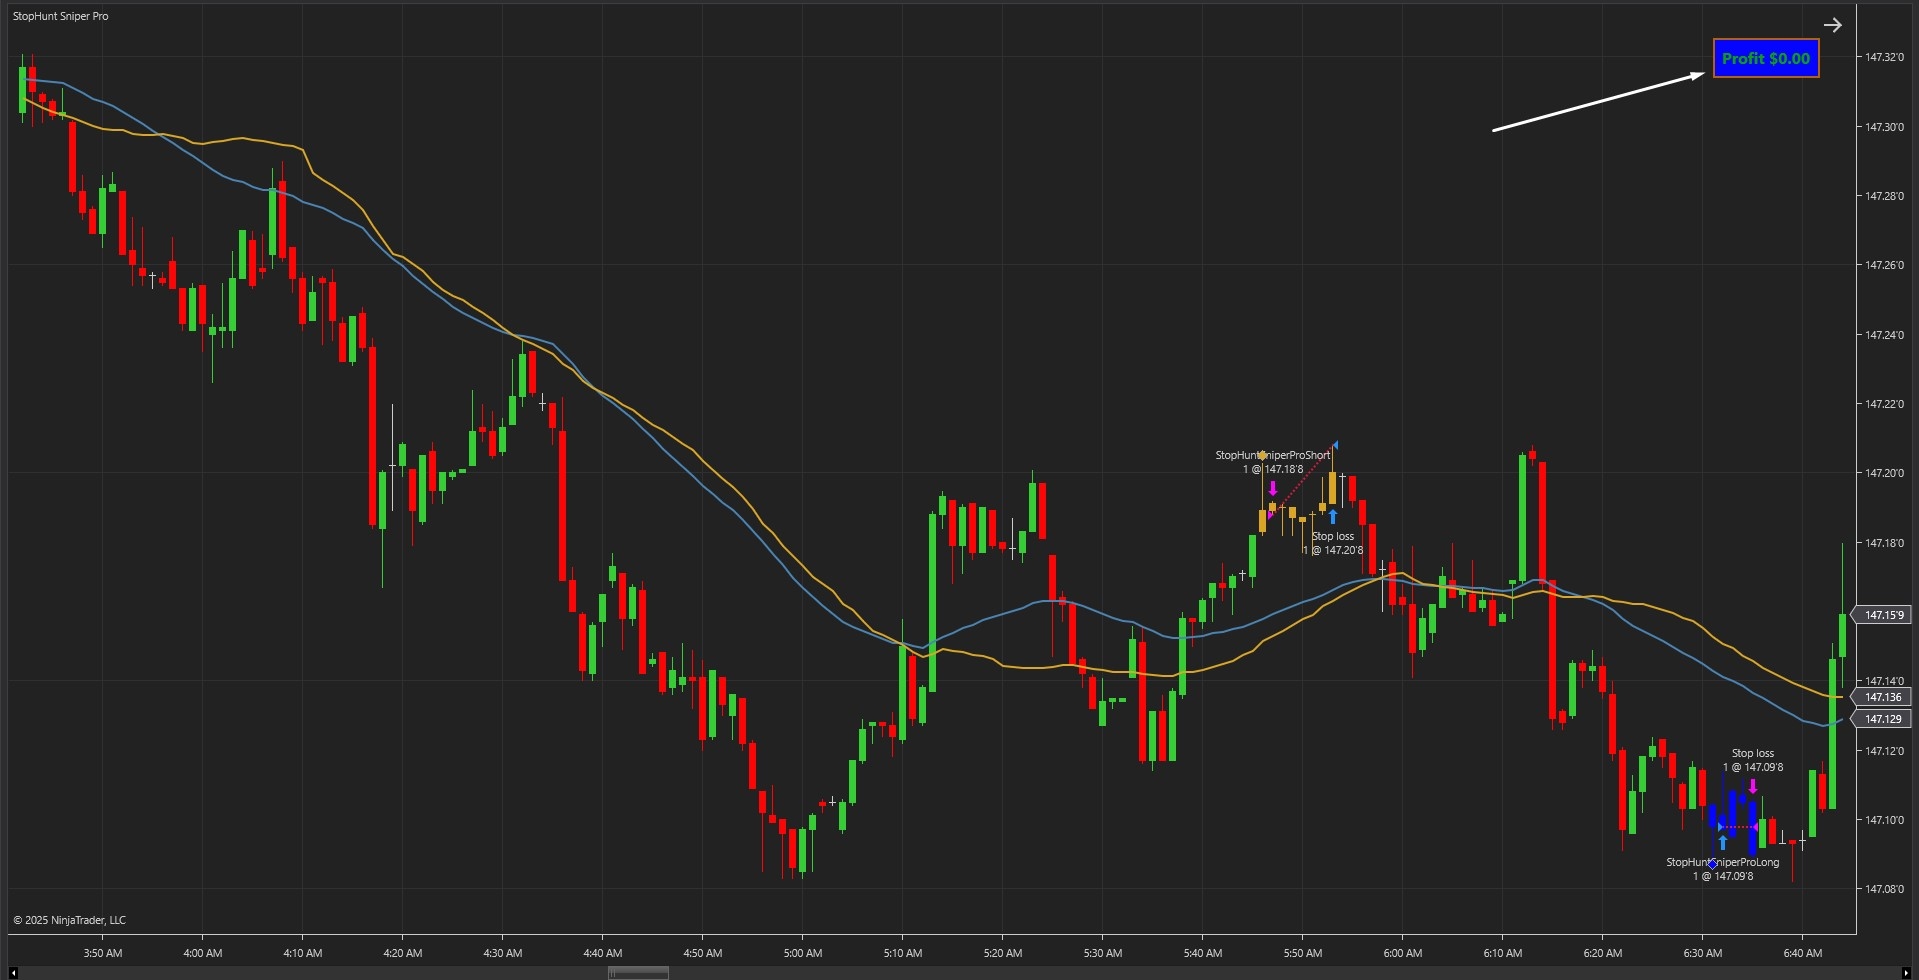
The strategy goes beyond simple sweep detection by implementing a multi-layered validation process. In Image 2 (pointed by white arrows), the live profit and loss overlay displays in real-time, showing current trade performance as positions develop. The strategy only executes when volume exceeds a specified multiple of the average (default 1.35x), the signal candle demonstrates sufficient body strength (minimum 55% body-to-range ratio), and price maintains adequate distance from the mean to avoid equilibrium entries. This statistical filtering eliminates low-quality setups and ensures traders only participate in high-probability liquidity reversals.
The visual framework automatically manages trade lifecycle—painted bars remain coloured throughout position duration, sweep markers provide historical reference points for pattern recognition, and the P&L panel updates tick-by-tick showing precise profit or loss values. This helps traders monitor strategy performance in real-time and study how price reacted at liquidity levels during backtesting.
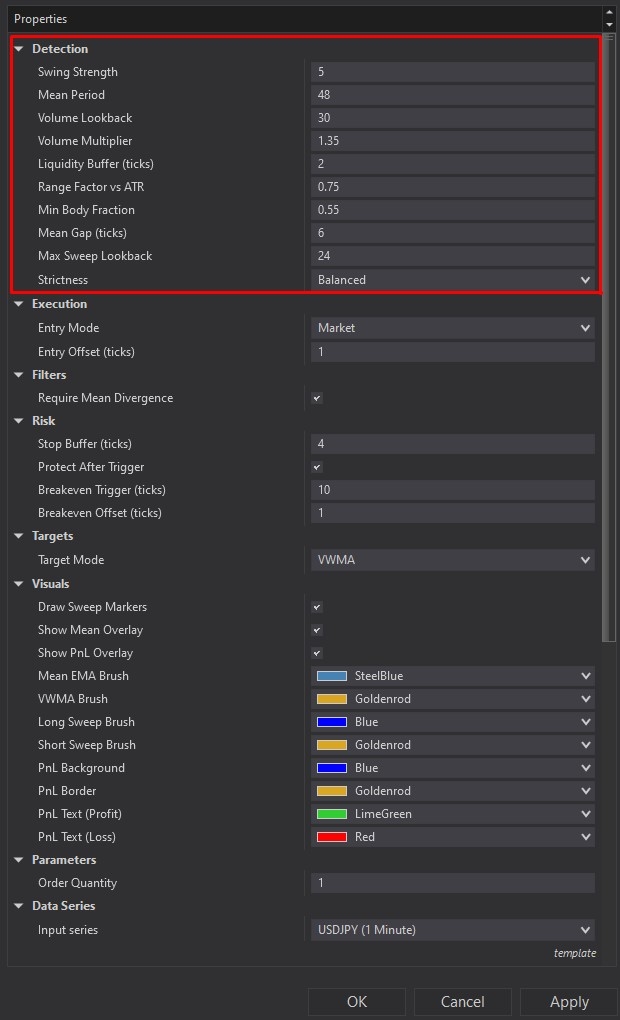

StopHunt Sniper Pro offers comprehensive customisation through its settings panel. The Detection section, highlighted by a red rectangle in Image 3, controls how the strategy identifies and validates liquidity sweeps. The Swing Strength parameter determines how significant a swing high or low must be to qualify as a valid liquidity level—higher values target stronger, more obvious swing points. The Mean Period setting (default value varies) controls the lookback window for EMA or VWMA mean calculation, establishing the baseline for mean reversion targets.
The Volume Lookback parameter defines how many bars are used to calculate average volume, whilst Volume Multiplier (default 1.35) sets the threshold that current volume must exceed for trade confirmation. The Liquidity Buffer Ticks adds cushioning above swing highs or below swing lows to confirm genuine sweeps rather than marginal breaches. The Range Factor Versus ATR ensures the signal candle demonstrates sufficient size relative to recent volatility, preventing reactions to weak price action.
Image 4 displays the Filters and Risk configuration options, highlighted by a yellow rectangle. The Minimum Body Fraction parameter (default 0.55) ensures signal candles possess solid bodies rather than just wicks—a 0.55 value requires at least 55% of the bar to be real body, filtering out indecisive price action. The Mean Gap Ticks setting enforces minimum distance between price and the mean before entry execution, adding edge by avoiding trades near equilibrium.
The Risk subsection provides comprehensive protection controls. Stop Buffer Ticks adds spacing beyond the sweep level for stop loss placement—more buffer provides breathing room but increases risk per trade. The Protect After Trigger option enables automatic breakeven functionality once positions move favourably. Breakeven Trigger Ticks defines the profit threshold (in ticks) required before moving the stop to breakeven, whilst Breakeven Offset Ticks allows traders to lock in small profits by positioning the stop slightly beyond entry price.
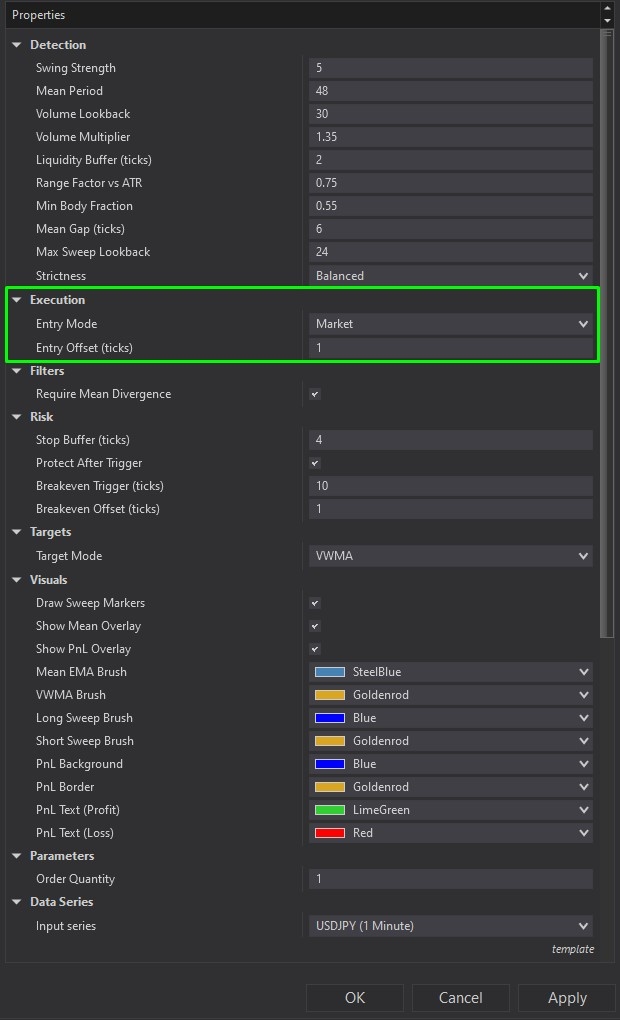
The Execution section, illustrated in Image 5 (highlighted by a green rectangle), defines order placement methodology. The Entry Mode parameter offers three options: Market orders for immediate execution, Limit orders for price control, and Stop orders for momentum-based entries. The Entry Offset Ticks parameter adds spacing between signal price and order placement, useful for reducing slippage or waiting for additional confirmation.
The Require Mean Divergence filter, when enabled, enforces that price must maintain minimum distance from the mean to qualify for entry—preventing trades that occur too close to fair value where edge diminishes. The Strictness preset selector offers Balanced (reliable baseline for most traders), Strict (fewer, more deliberate setups), Aggressive (increased signal frequency in volatile markets), or Custom (full manual control over all parameters).
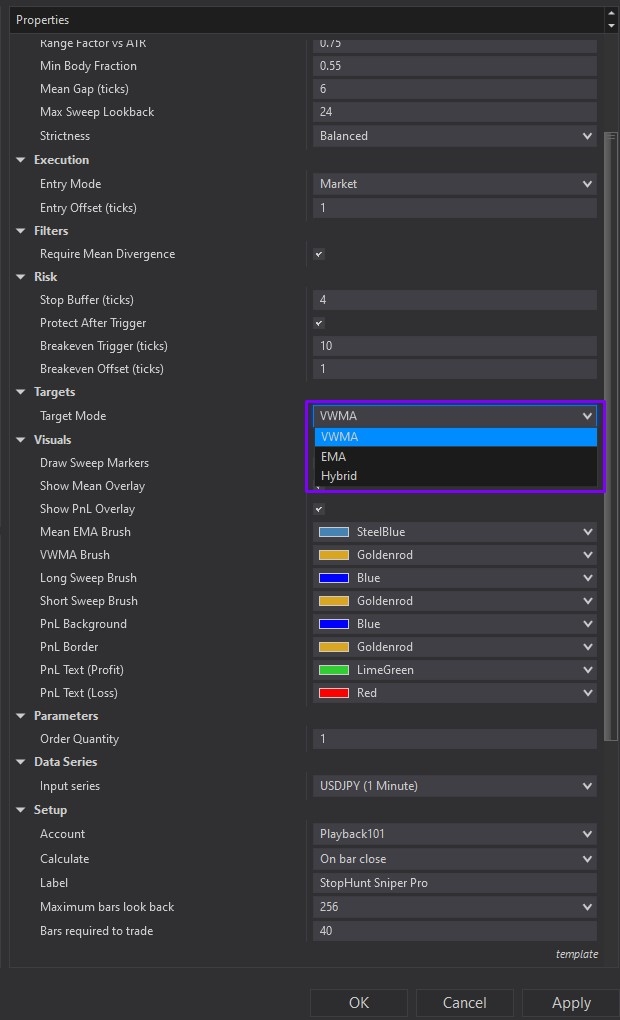
Image 6 (highlighted by a purple rectangle) reveals the Targets configuration, which controls profit-taking methodology. The Target Mode parameter offers three sophisticated options: VWMA (Volume Weighted Moving Average) places targets at the volume-weighted mean line for fast exits responsive to volume shifts—ideal for scalping high-volume markets. EMA (Exponential Moving Average) sets targets at the smoothed exponential average, providing more room to breathe and suiting trending environments. Hybrid calculates the average of both VWMA and EMA, delivering balanced middle-ground targeting that's less aggressive than pure VWMA but more dynamic than EMA alone.
The Visuals subsection allows complete customisation of on-chart display elements. Draw Sweep Markers toggles diamond icons at liquidity levels, Show Mean Overlay displays EMA or VWMA lines directly on the chart, and Show P&L Overlay enables the live profit and loss panel. Colour controls include Mean EMA Brush, Mean VWMA Brush for mean line appearance, Long Sweep Brush (default blue) and Short Sweep Brush (default golden rod) for painted bar colours during active positions, and comprehensive P&L panel customisation including background, border, text, profit, and loss colours.
With full NinjaScript source code included, advanced users can modify the code as they please. If you have questions about the strategy, refer to the comprehensive video tutorial above.
Secure payment via PayPal
By downloading, you agree with our Terms & Conditions

