Mega Sale 50% OFF All Products & Memberships | Limited time onlyUse code RCSALE50ALL
Click to play video
Tutorial with Source Code
Please Register for FREE account or Login to purchase this source code.
By downloading, you agree with our Terms & Conditions
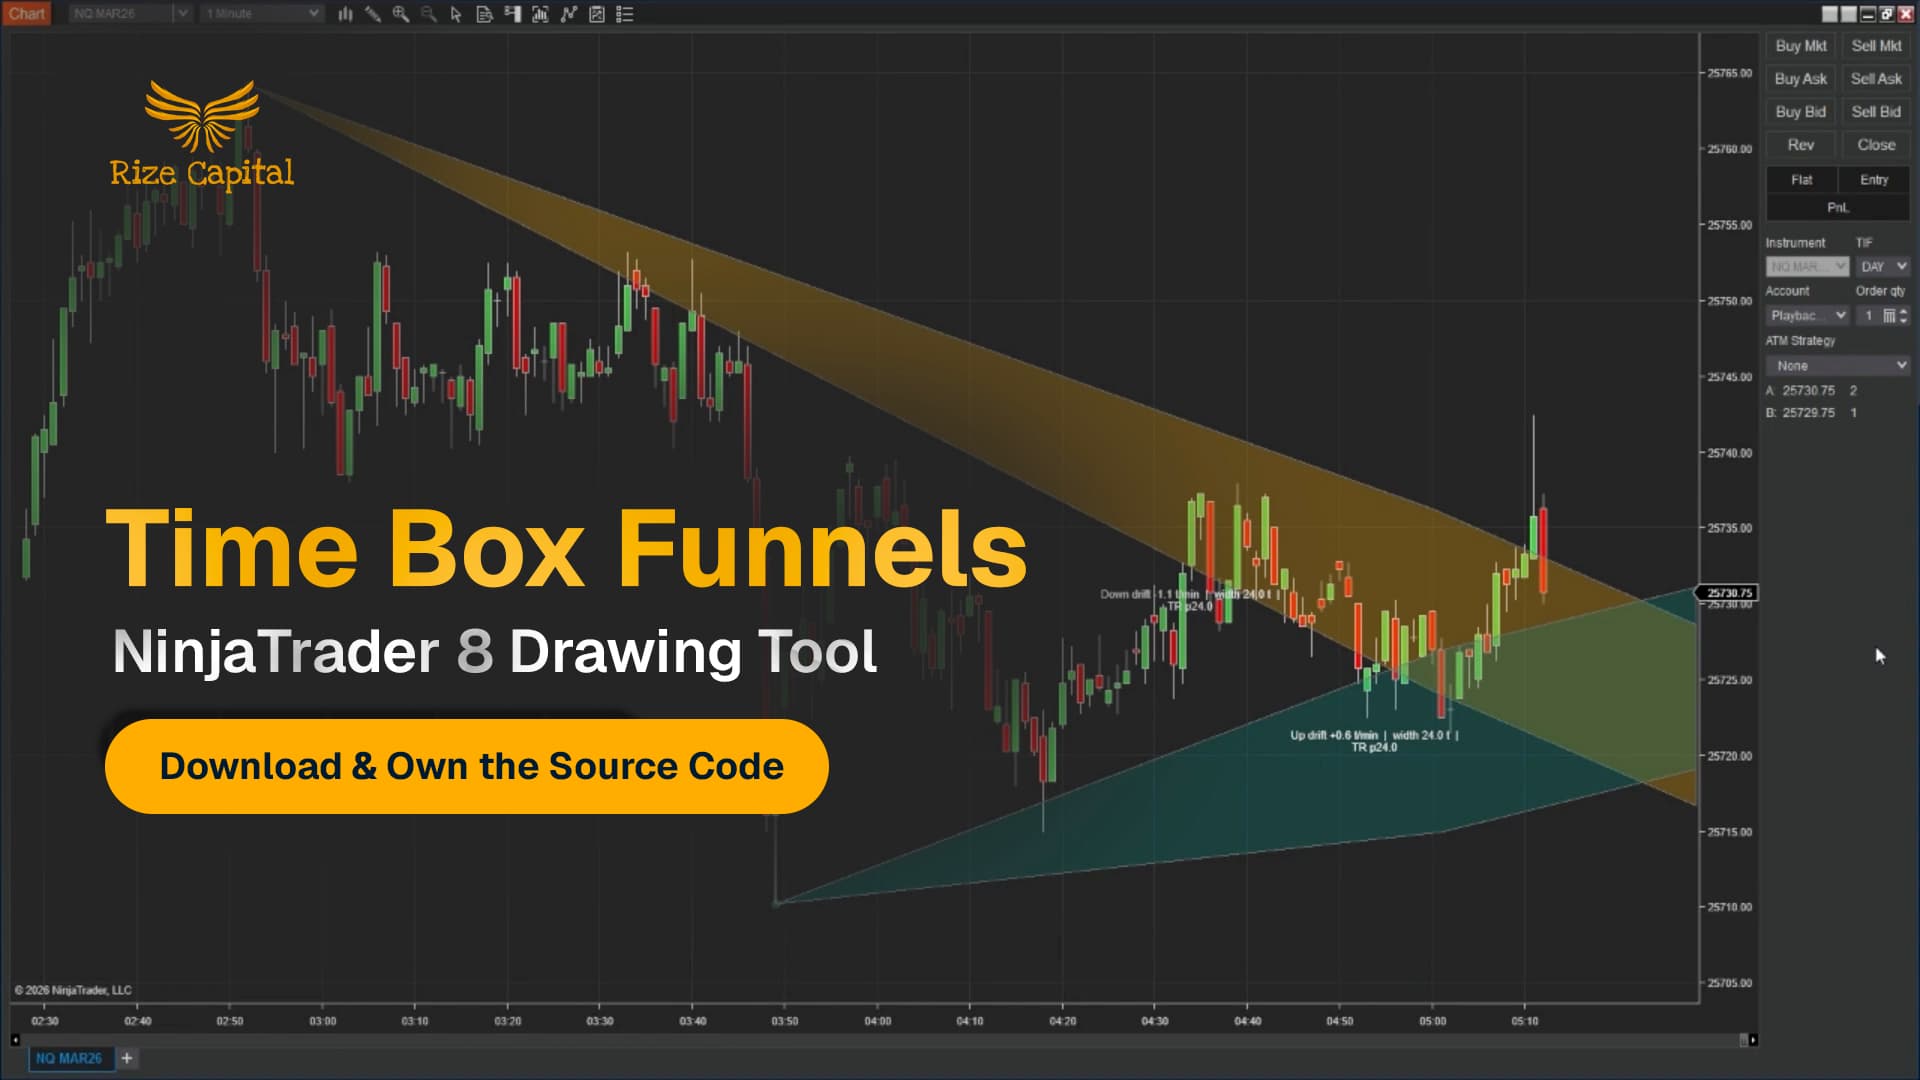
The Time Box Funnels is a sophisticated drawing tool developed for NinjaTrader 8 and 8.1. It specialises in transforming specific time windows into structured price expectation frameworks by measuring drift, volatility, and true range behaviour between two user-defined anchor points, automatically projecting forward-looking price funnels that provide clear upper and lower boundaries for expectation management, risk placement, and invalidation recognition. When you purchase the Time Box Funnels from Rize Capital, you receive the complete NinjaScript source code, providing total freedom to modify the calculation algorithms, customise the visual appearance and funnel width parameters, or integrate the time-based structure logic into your own trading frameworks with no restrictions whatsoever. For a detailed overview, check out our video tutorial.
See how the Time Box Funnels - NinjaTrader 8 Drawing Tool looks in action with these screenshots
Learn how to use the Time Box Funnels - NinjaTrader 8 Drawing Tool
The Time Box Funnels Drawing Tool for NinjaTrader 8 specialises in time-based price structure projection by measuring directional drift, volatility width, and true range characteristics during a user-defined measurement window between two anchor points, automatically calculating and projecting forward-looking price funnels that establish expected upper and lower boundaries for subsequent price behaviour. The core functionality revolves around statistical measurement combined with visual boundary projection that provides traders with objective expectation frameworks, clear risk reference points, and definitive invalidation signals.
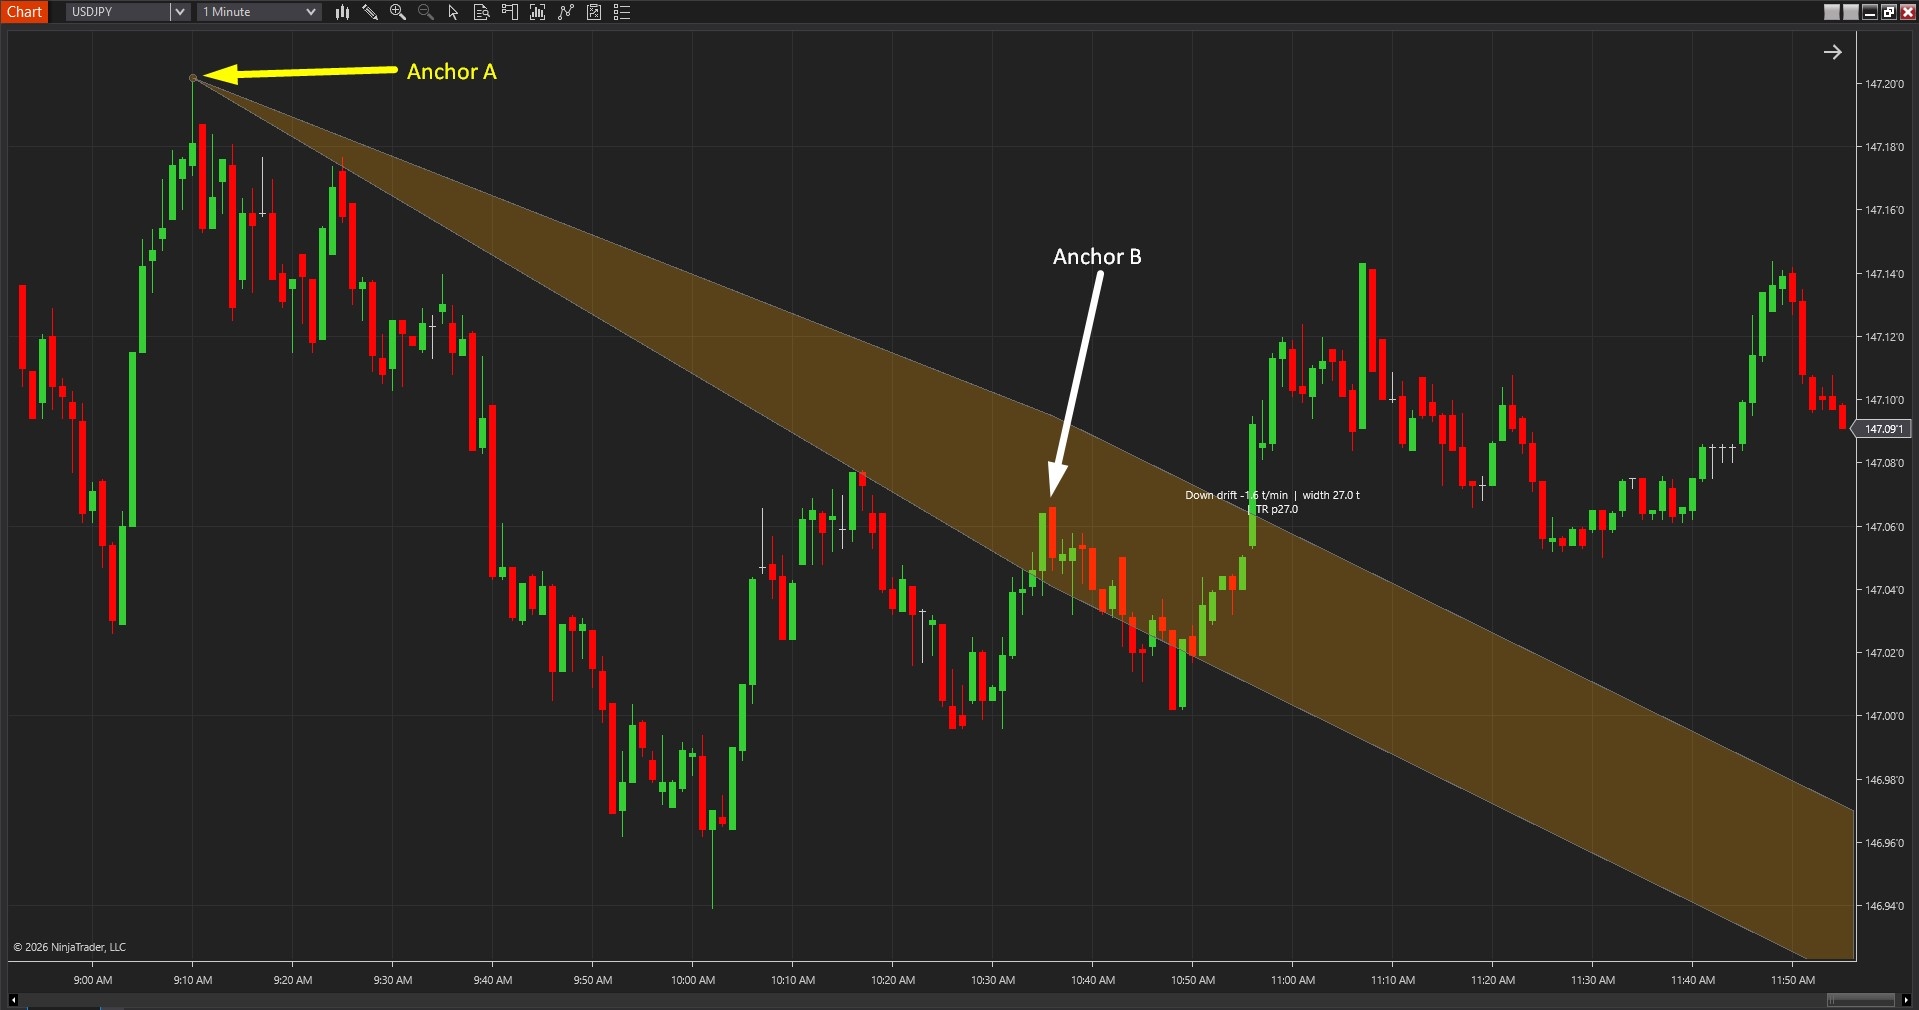
As shown in Image 1 (pointed by yellow arrows), traders place Anchor A at the beginning of the time window they wish to analyse—typically the start of a specific session, the beginning of a move, or the opening of a consolidation period. Anchor B is then placed at the end of the measurement window (pointed by white arrows), establishing the timeframe from which the tool will derive drift and volatility characteristics. Once both anchors are positioned, the funnel automatically projects forward beyond Anchor B, creating upper and lower boundary lines that represent expected price behaviour based on measured historical patterns.
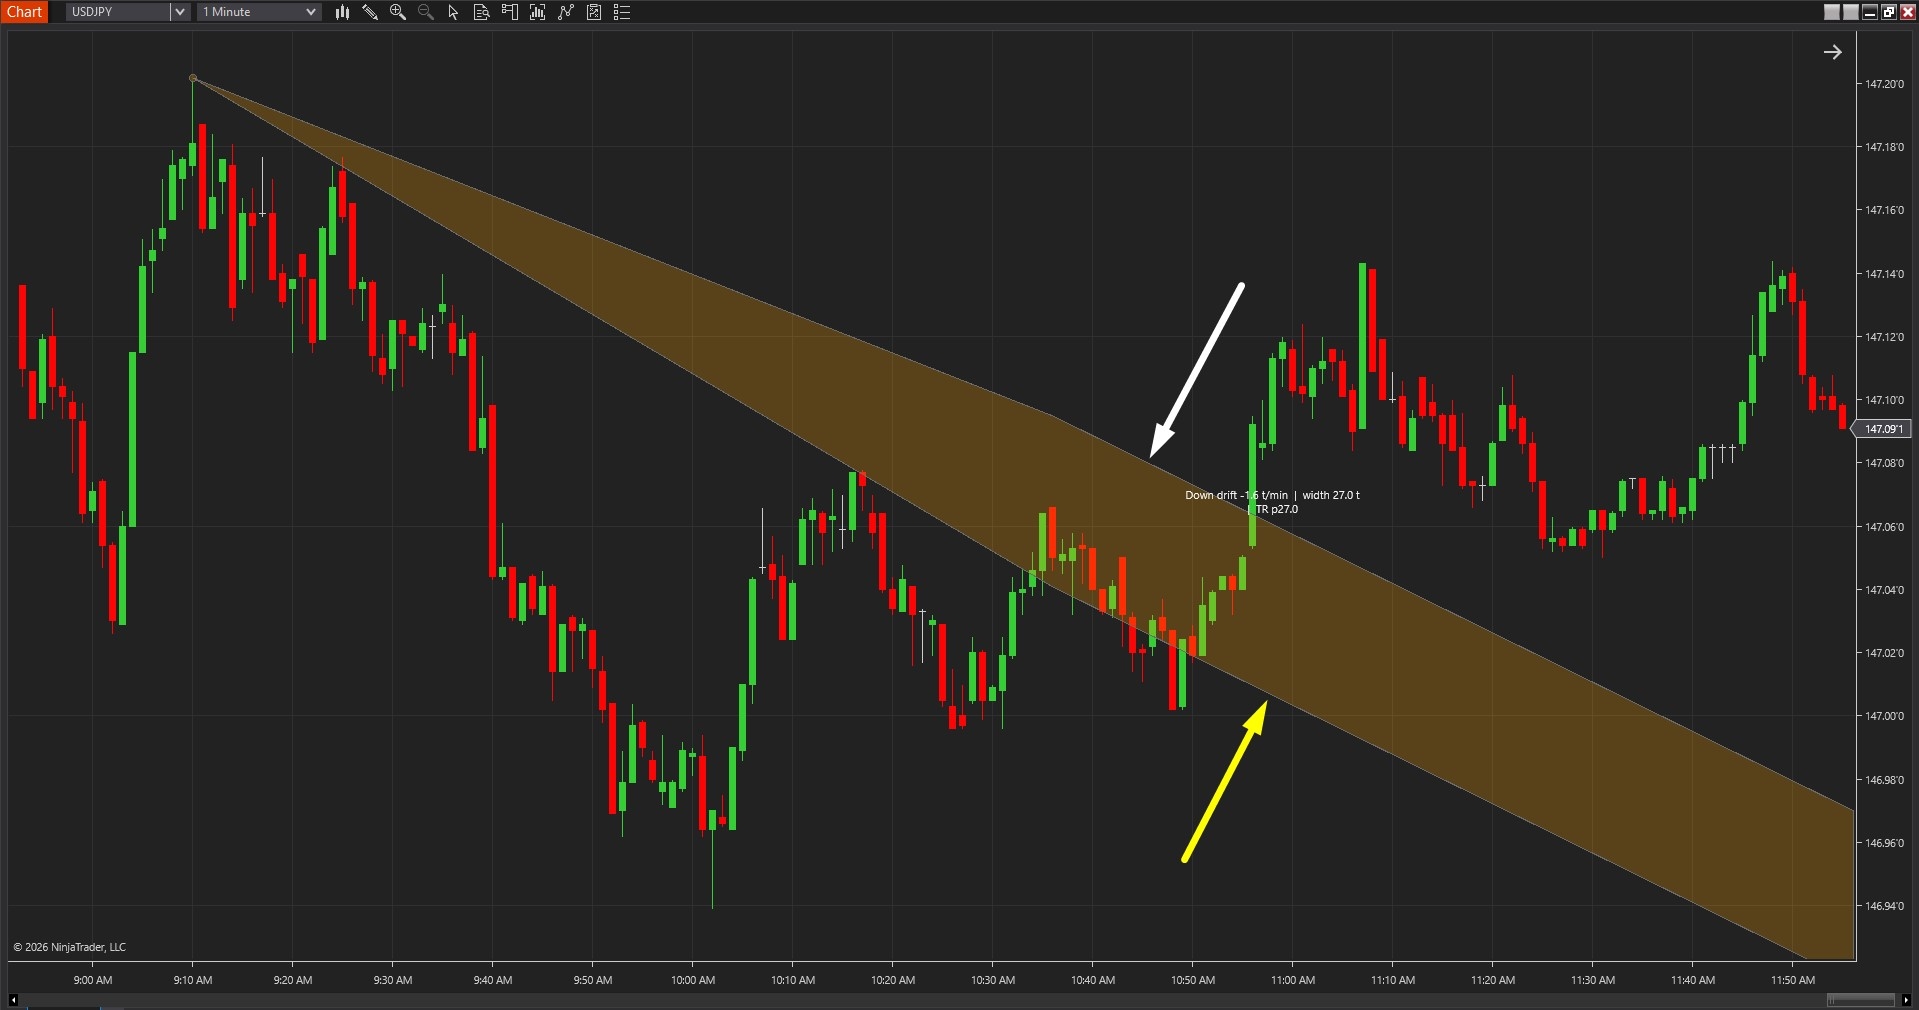
The tool goes beyond simple channel drawing by incorporating three critical statistical measurements into the projection. In Image 2 (pointed by white arrows), the upper funnel boundary marks the expected upper price limit based on measured drift direction and ATR-adjusted volatility width, whilst the lower funnel boundary (pointed by yellow arrows) establishes the expected lower price limit. The funnel width automatically adapts to market volatility—wider funnels form during high-volatility periods providing generous expectation boundaries, whilst narrower funnels emerge during low-volatility conditions creating tighter structural frameworks.
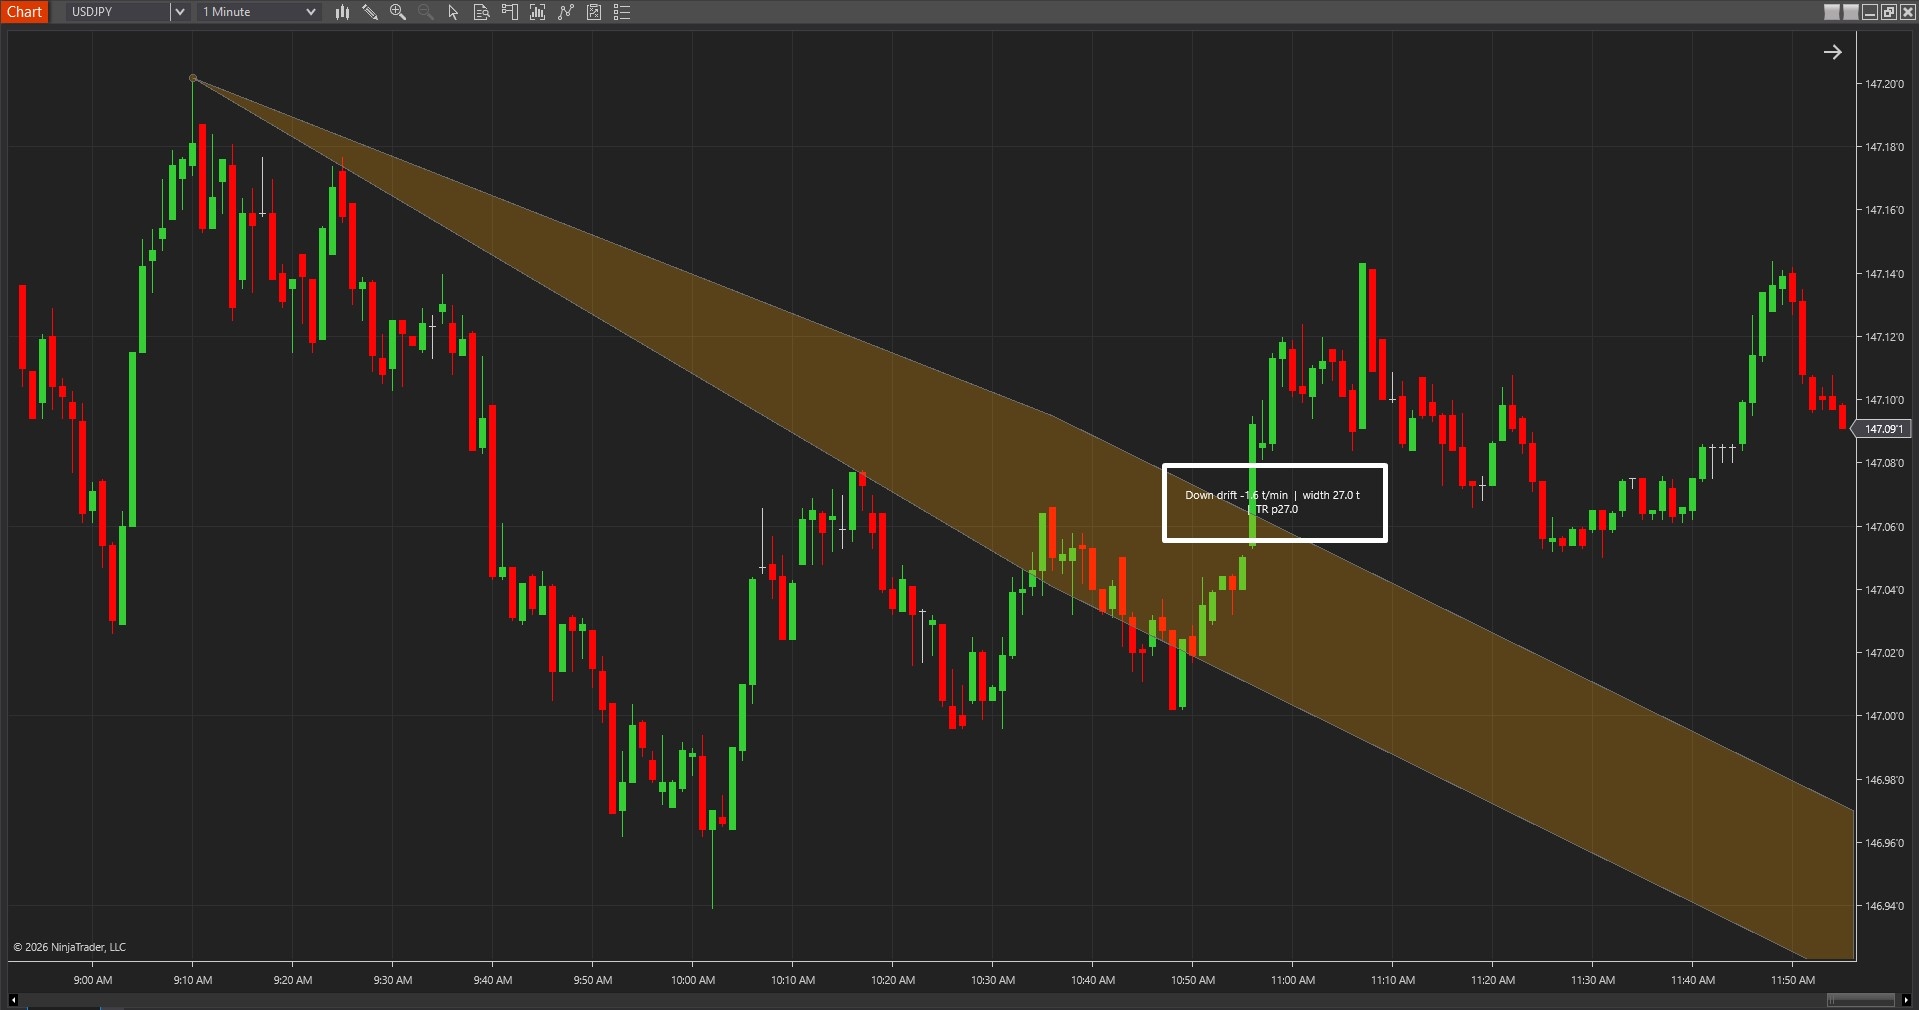
The visual framework includes comprehensive labelling that explains the mathematical foundation of each funnel projection. As shown in Image 3 (with a white rectangle), the label displays three key metrics: Drift (e.g., "Down Drift -1.1 tick per minute") reveals the average directional movement during the measurement window—down drift indicates price was declining, up drift shows rising price action, and the tick-per-minute value quantifies the slope intensity. Width (e.g., "24 ticks") communicates the funnel's total range from upper to lower boundary, directly reflecting volatility conditions—larger width values suggest higher volatility requiring wider expectation boundaries. True Range (TR) displays the typical price movement during the measurement window, providing context for how active the market was when the funnel calculations were performed.
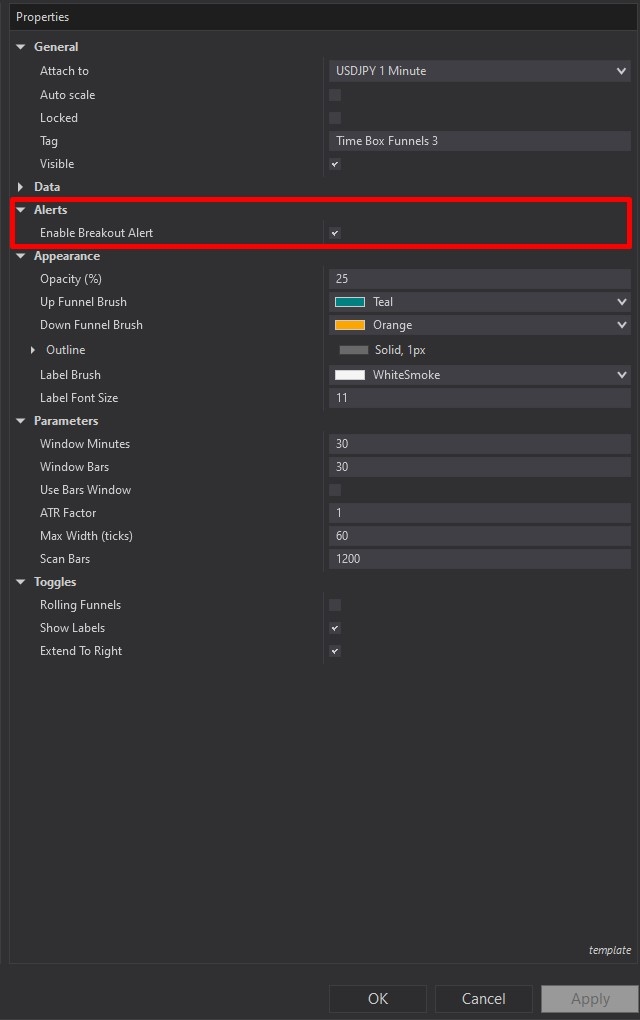
Time Box Funnels offers comprehensive customisation through its settings panel. The Alerts section, highlighted by a red rectangle in Image 4, controls notification functionality. The Enable Breakout Alert parameter, when activated, triggers audible and visual alerts when price closes outside the funnel boundaries—either above the upper boundary or below the lower boundary. This breakout detection provides immediate notification of expectation invalidation, helping traders recognise when measured behaviour has fundamentally changed and the original framework no longer applies. Alerts focus attention on meaningful structure breaks rather than temporary boundary tests that close back inside the funnel.
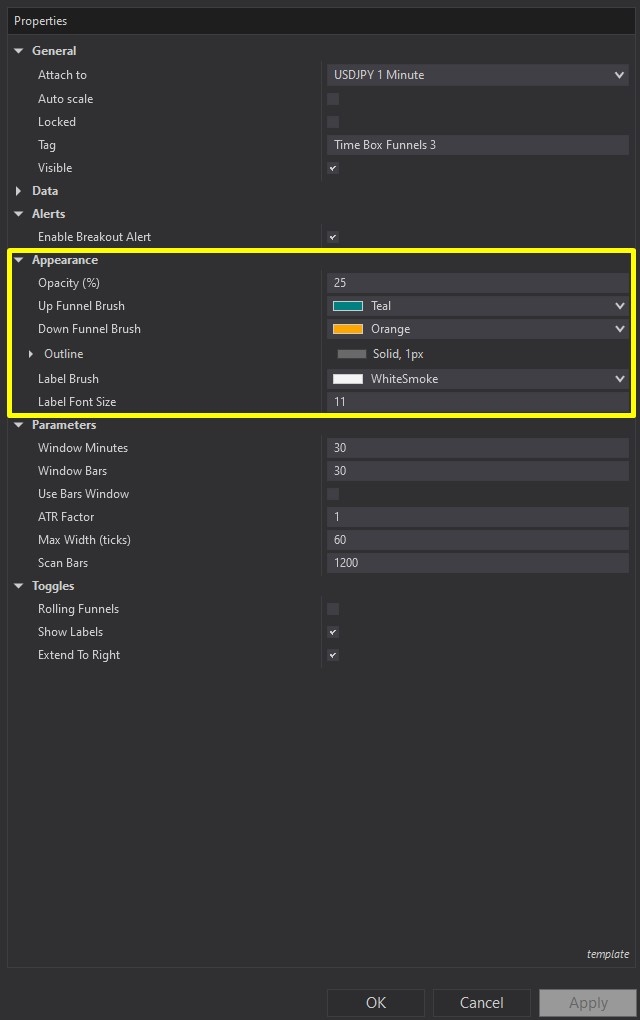
Image 5 displays the Appearance configuration options, highlighted by a yellow rectangle. The Opacity parameter controls funnel fill transparency, with lower values creating subtler, less intrusive chart overlays that maintain price action visibility, whilst higher values produce more prominent funnels for increased visual emphasis. The Up Funnel Brush setting determines the colour scheme when drift direction is upward, typically using bullish colours (greens, blues) to communicate positive directional bias. The Down Funnel Brush controls colouring when drift is downward, conventionally employing bearish colours (reds, oranges) to signal negative directional expectation.
The Outline parameter customises the funnel boundary line style, including colour, thickness, and dash pattern options—solid lines provide clear continuous boundaries, whilst dashed patterns create more subtle visual separation. The Label Brush setting controls the text colour for drift, width, and true range information displays, ensuring readability against various chart backgrounds. The Label Font Size parameter adjusts text scale, accommodating different monitor sizes, viewing distances, and personal preference whilst maintaining information clarity.
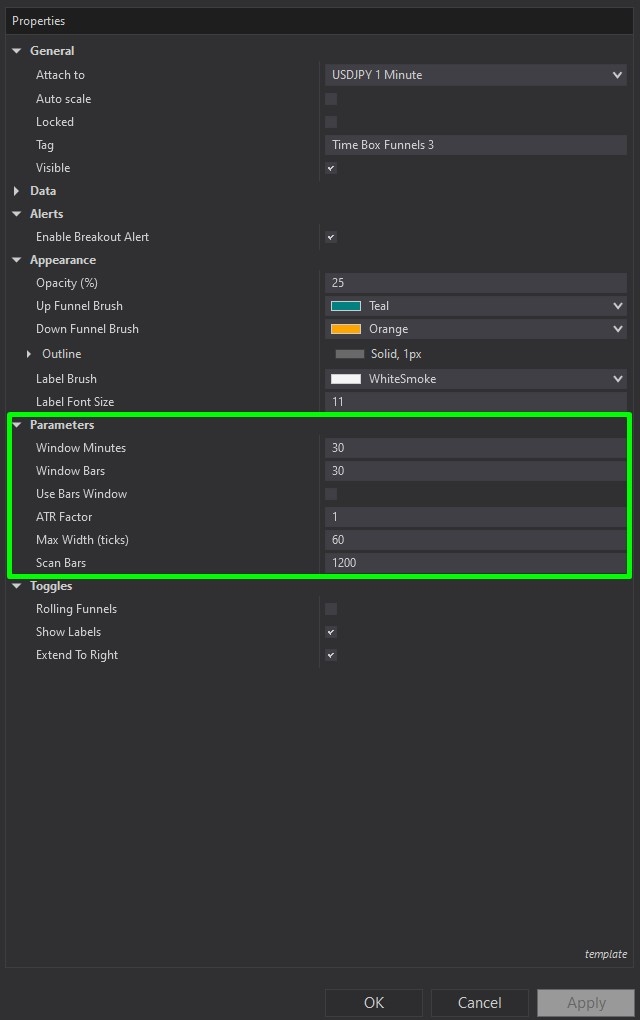
The Parameters section, illustrated in Image 6 (highlighted by a green rectangle), controls the core calculation logic. The Window Minutes parameter defines the measurement window length in time units—setting this to 30 means the tool analyses the 30-minute period between Anchor A and Anchor B, regardless of how many bars printed. The Window Bars parameter offers an alternative measurement approach, defining the window length by bar count rather than elapsed time—useful for instruments with irregular bar formation or when bar-count patterns matter more than time duration.
The Use Bars Window toggle determines which measurement method applies: when disabled (default), Window Minutes controls the analysis period; when enabled, Window Bars takes precedence. This flexibility allows traders to adapt the tool to different analysis frameworks—time-based for session structure analysis, bar-based for pattern-specific measurements.
The ATR Factor parameter critically influences funnel width calculation by controlling how volatility affects boundary placement. Higher ATR factor values (e.g., 2.0, 2.5) create wider, more conservative funnels that accommodate larger price swings and reduce premature breakout signals, appropriate for volatile instruments or when seeking high-conviction invalidation signals. Lower ATR factor values (e.g., 1.0, 1.5) produce tighter funnels with closer boundaries, suitable for low-volatility instruments or when trading strategies require precise expectation frameworks.
The Max Width in Ticks parameter establishes an absolute ceiling on funnel width expansion, preventing distortion during extreme volatility events where ATR-based calculations might produce unrealistically wide boundaries. This limit ensures funnels remain practically useful even when volatility spikes dramatically—for example, setting max width to 50 ticks ensures no funnel exceeds that range regardless of measured volatility.
The Scan Bars parameter defines the historical lookback depth available for calculations, determining how much past data the tool can access when computing drift, volatility, and true range statistics. Higher values provide more comprehensive historical context but increase computational load, whilst lower values limit analysis to recent behaviour patterns with faster processing.
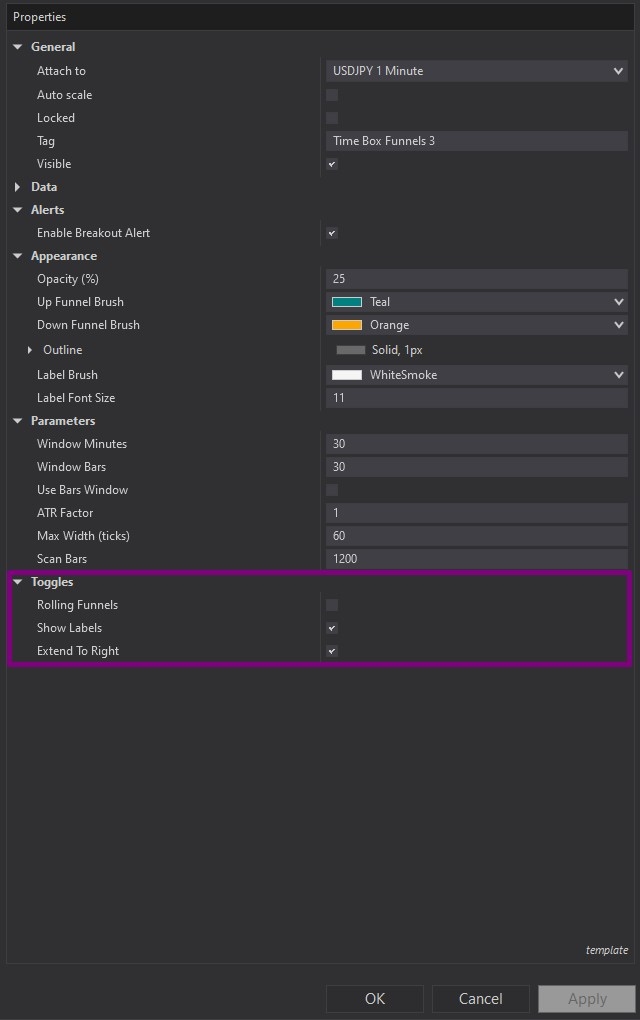
Image 7 (highlighted by a purple rectangle) toggle options. The Toggles subsection provides behavioural customisation options. The Rolling Funnels parameter, when enabled, causes the funnel to update continuously as new bars form—the measurement window "rolls forward", maintaining constant time/bar length whilst incorporating the latest price action. This creates dynamic, evolving expectation frameworks that adapt in real-time. When disabled, funnels remain static after initial projection based solely on the original Anchor A to Anchor B measurement window.
The Show Labels toggle controls visibility of the drift, width, and true range information text—enabling this displays the mathematical foundation for each funnel, whilst disabling it creates cleaner charts when traders already understand the projection basis. The Extend to Right parameter determines whether funnel boundaries project indefinitely forward or terminate at a specific point, affecting visual chart presentation and long-term expectation framing.
If you have questions about optimal measurement window selection for different trading sessions, combining Time Box Funnels with other technical analysis tools, interpreting drift and width metrics across various market conditions, or building automated strategies that reference funnel boundaries for systematic risk management, refer to the comprehensive video tutorial above for detailed guidance on maximising the Time Box Funnels' effectiveness in your expectation-based trading approach.
Secure payment via PayPal
By downloading, you agree with our Terms & Conditions

