Click to play video

Tutorial with Source Code
Please Register for FREE account or Login to purchase this source code.
By downloading, you agree with our Terms & Conditions
Trend Harmony Oscillator is a multi-timeframe alignment indicator designed for NinjaTrader 8 and 8.1. It answers one critical trading question: is your current move aligned with the bigger trend, or are you about to get chopped up? The indicator compares short-term momentum on your trading chart against the direction of a higher timeframe trend, then displays this relationship as a clean oscillator below price. When readings push strongly positive above the bullish threshold, short-term and higher timeframe trends align upward—favouring long setups. When readings drop strongly negative below the bearish threshold, alignment turns bearish—favouring short setups. When the oscillator hovers near zero, timeframes disagree or show weakness—suggesting caution or staying out entirely. When you buy Trend Harmony Oscillator from Rize Capital, you receive the full NinjaScript source code. You're not locked into a black box—you can review the logic, modify calculations, adjust visual settings, or integrate it into your own strategies without restrictions. For a complete walkthrough, watch our video tutorial above.
See how the Trend Harmony Oscillator - NinjaTrader 8 Indicator looks in action with these screenshots
Learn how to use the Trend Harmony Oscillator - NinjaTrader 8 Indicator
Trend Harmony Oscillator for NinjaTrader 8 helps traders avoid getting caught in moves that go against the larger trend. The core problem it solves is simple: you see momentum on your 1-minute chart, but is that momentum fighting against a 5-minute downtrend? If so, your long setup probably fails quickly. This indicator does the timeframe comparison work for you, displaying the relationship in one clean panel.
The tool works by measuring two things: momentum direction on your current timeframe, and trend slope on a higher timeframe (determined by a multiplier you set). It then combines these measurements into a normalised oscillator that oscillates between positive and negative values. Positive means alignment favours longs. Negative means alignment favours shorts. Near zero means mixed or weak conditions.
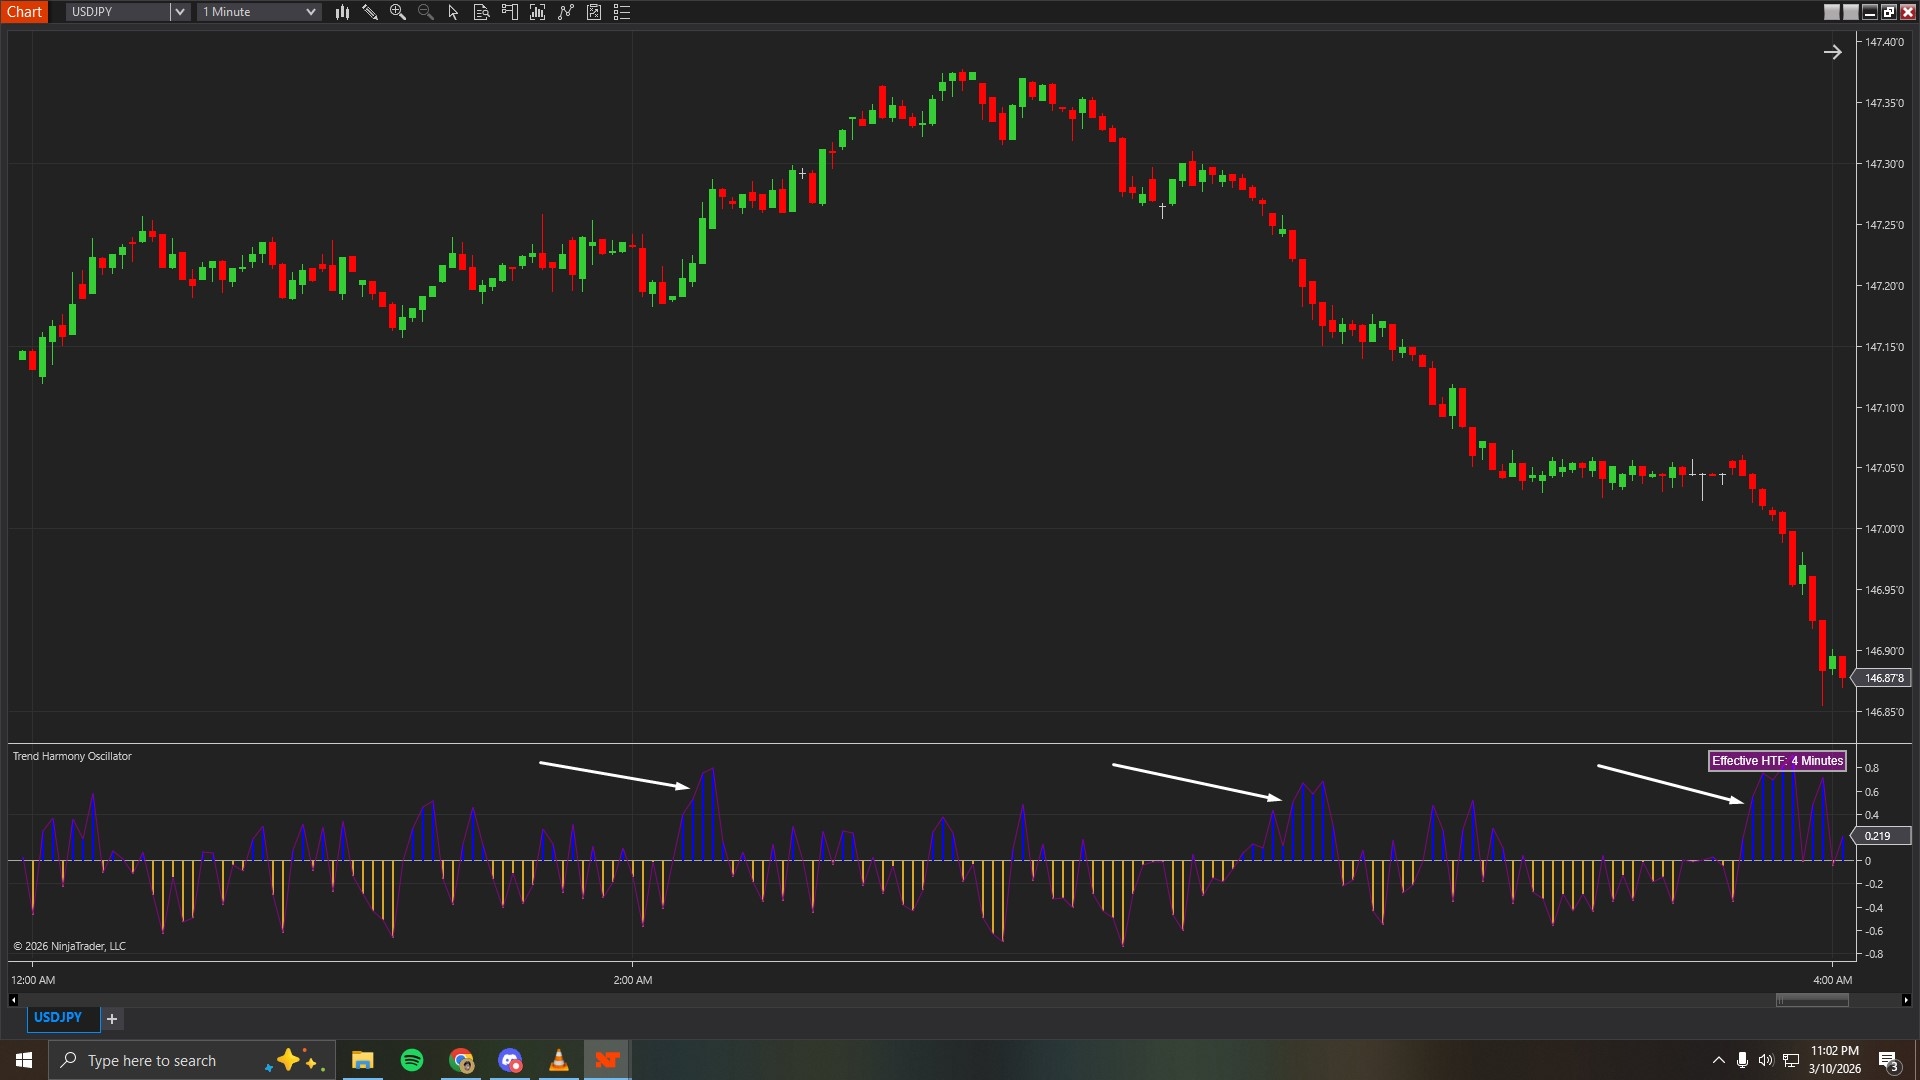
In Image 1 (marked with white arrows), the histogram bars push clearly above the zero line and approach or exceed the upper threshold (the bullish boundary line). This visual pattern tells you that short-term momentum on your trading chart is moving in the same direction as the higher timeframe trend—both are bullish. When you see this pattern, long setups gain support from the bigger picture. Price moves upward with the wind at your back rather than fighting against it.
The taller the green bars climb above the upper threshold, the stronger the alignment becomes. This isn't just "technically bullish"—it's showing genuine agreement between timeframes, which typically leads to better follow-through on long trades.
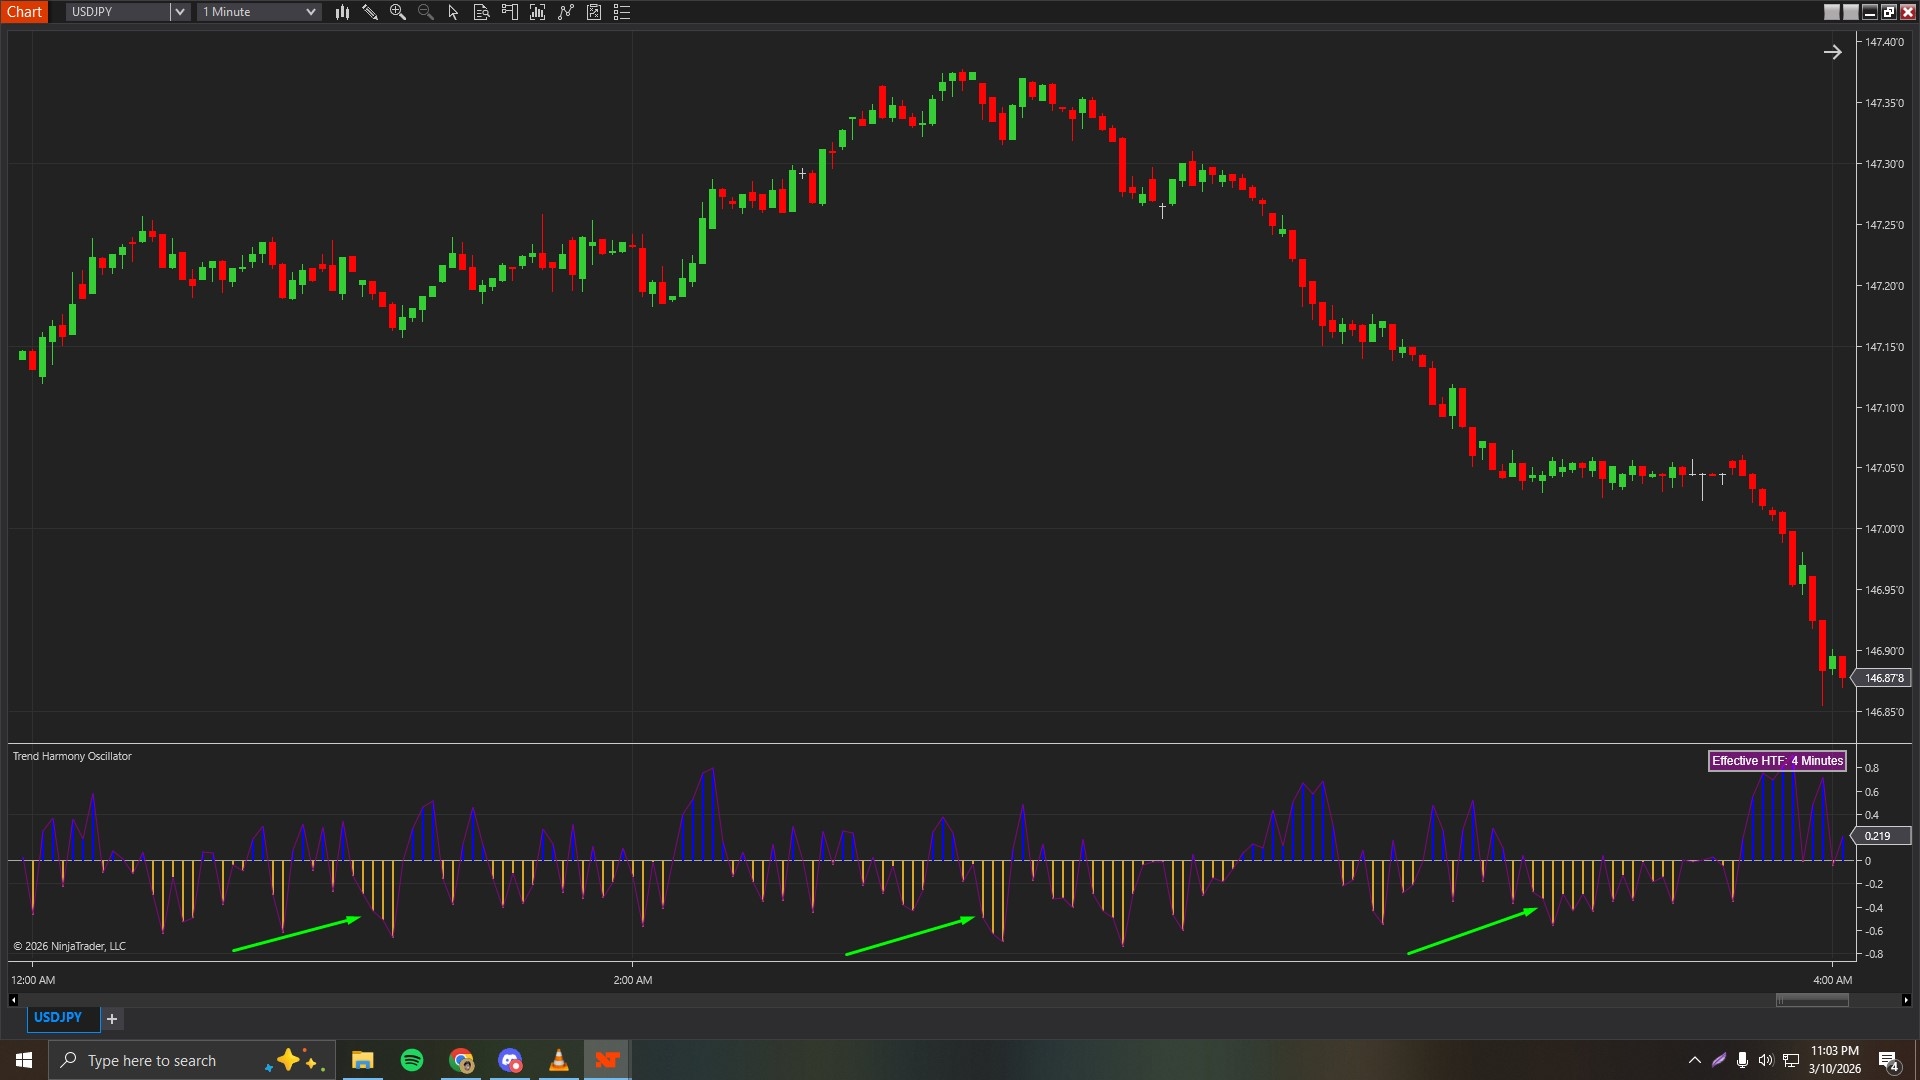
Image 2 (marked with green arrows) shows the opposite scenario. The histogram bars drop below zero and push toward or past the lower threshold (the bearish boundary line). This indicates that short-term momentum and higher timeframe trend both point downward—bearish alignment. In this environment, short setups make more sense because you're trading with the larger flow rather than against it.
When red bars extend deeply below the lower threshold, bearish alignment strengthens. This warns you that long setups—even if they look appealing on your trading timeframe—face headwinds from the bigger trend.
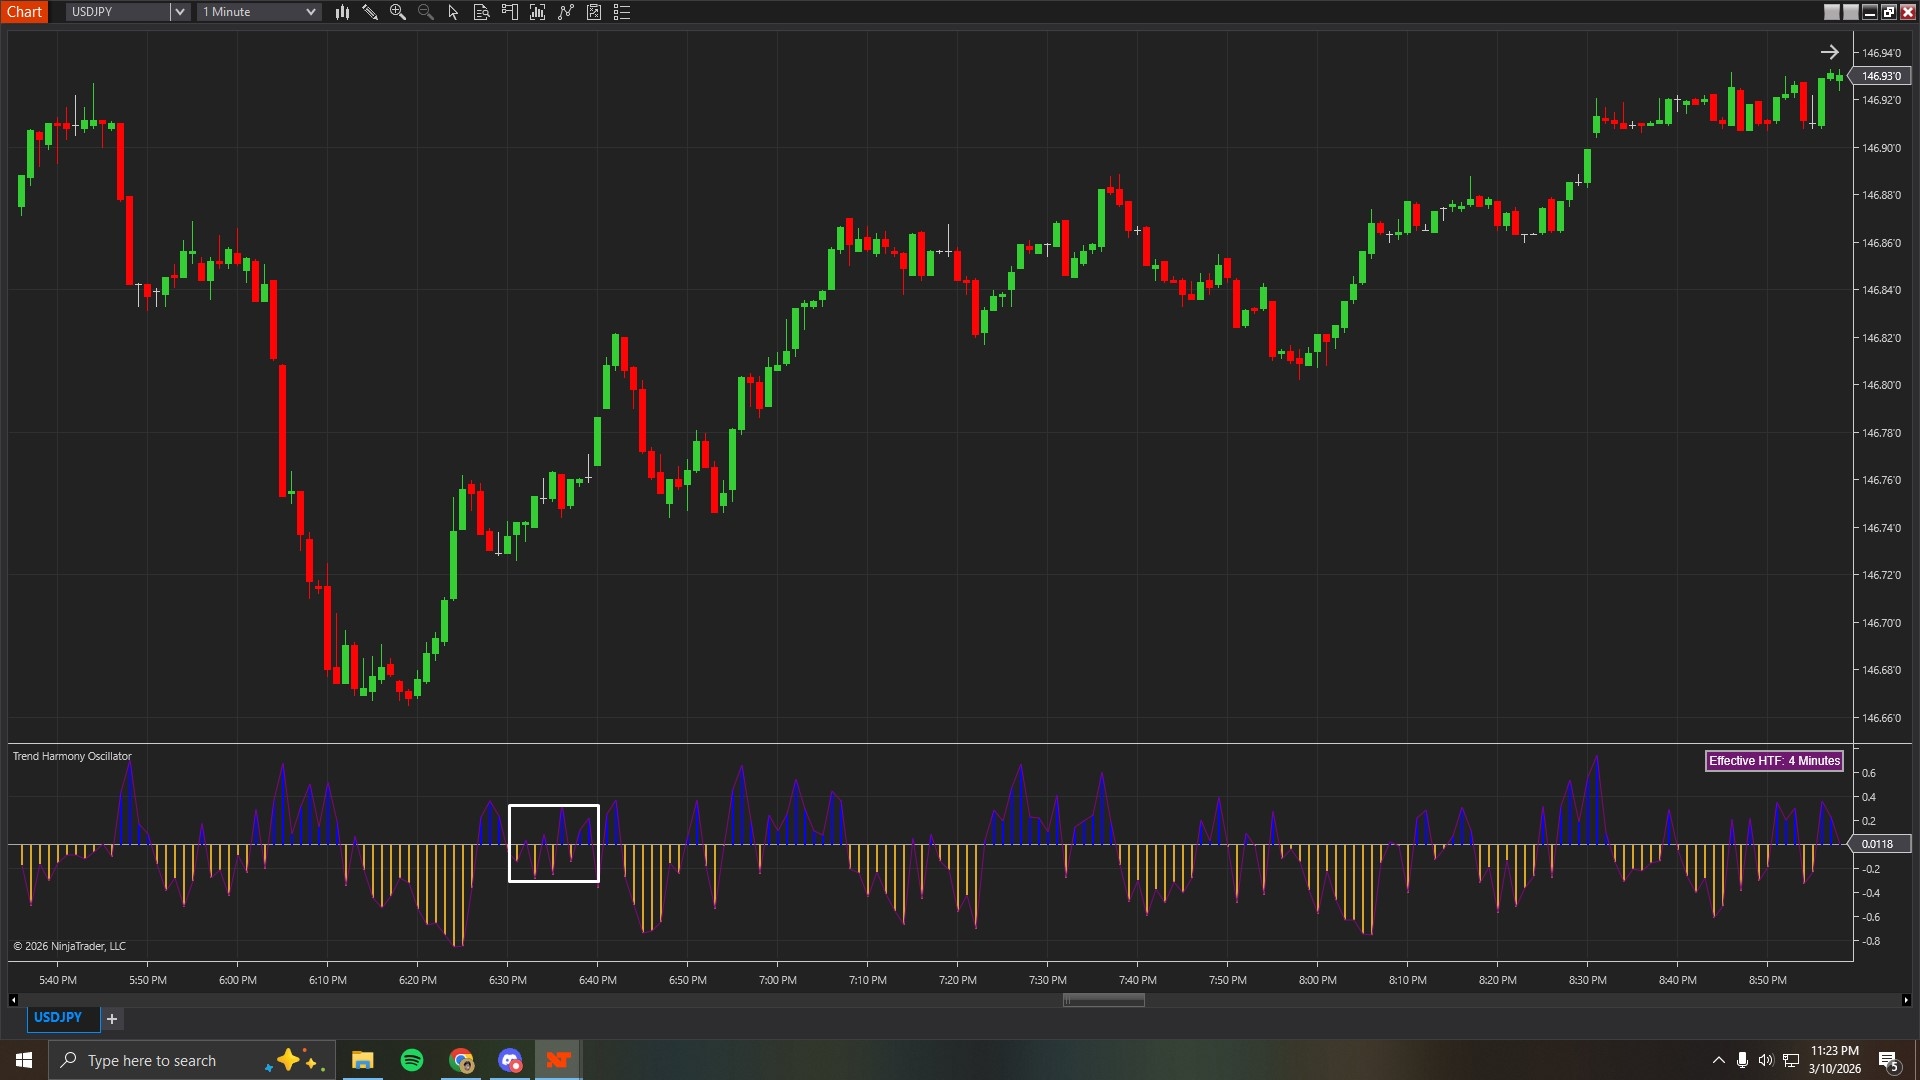
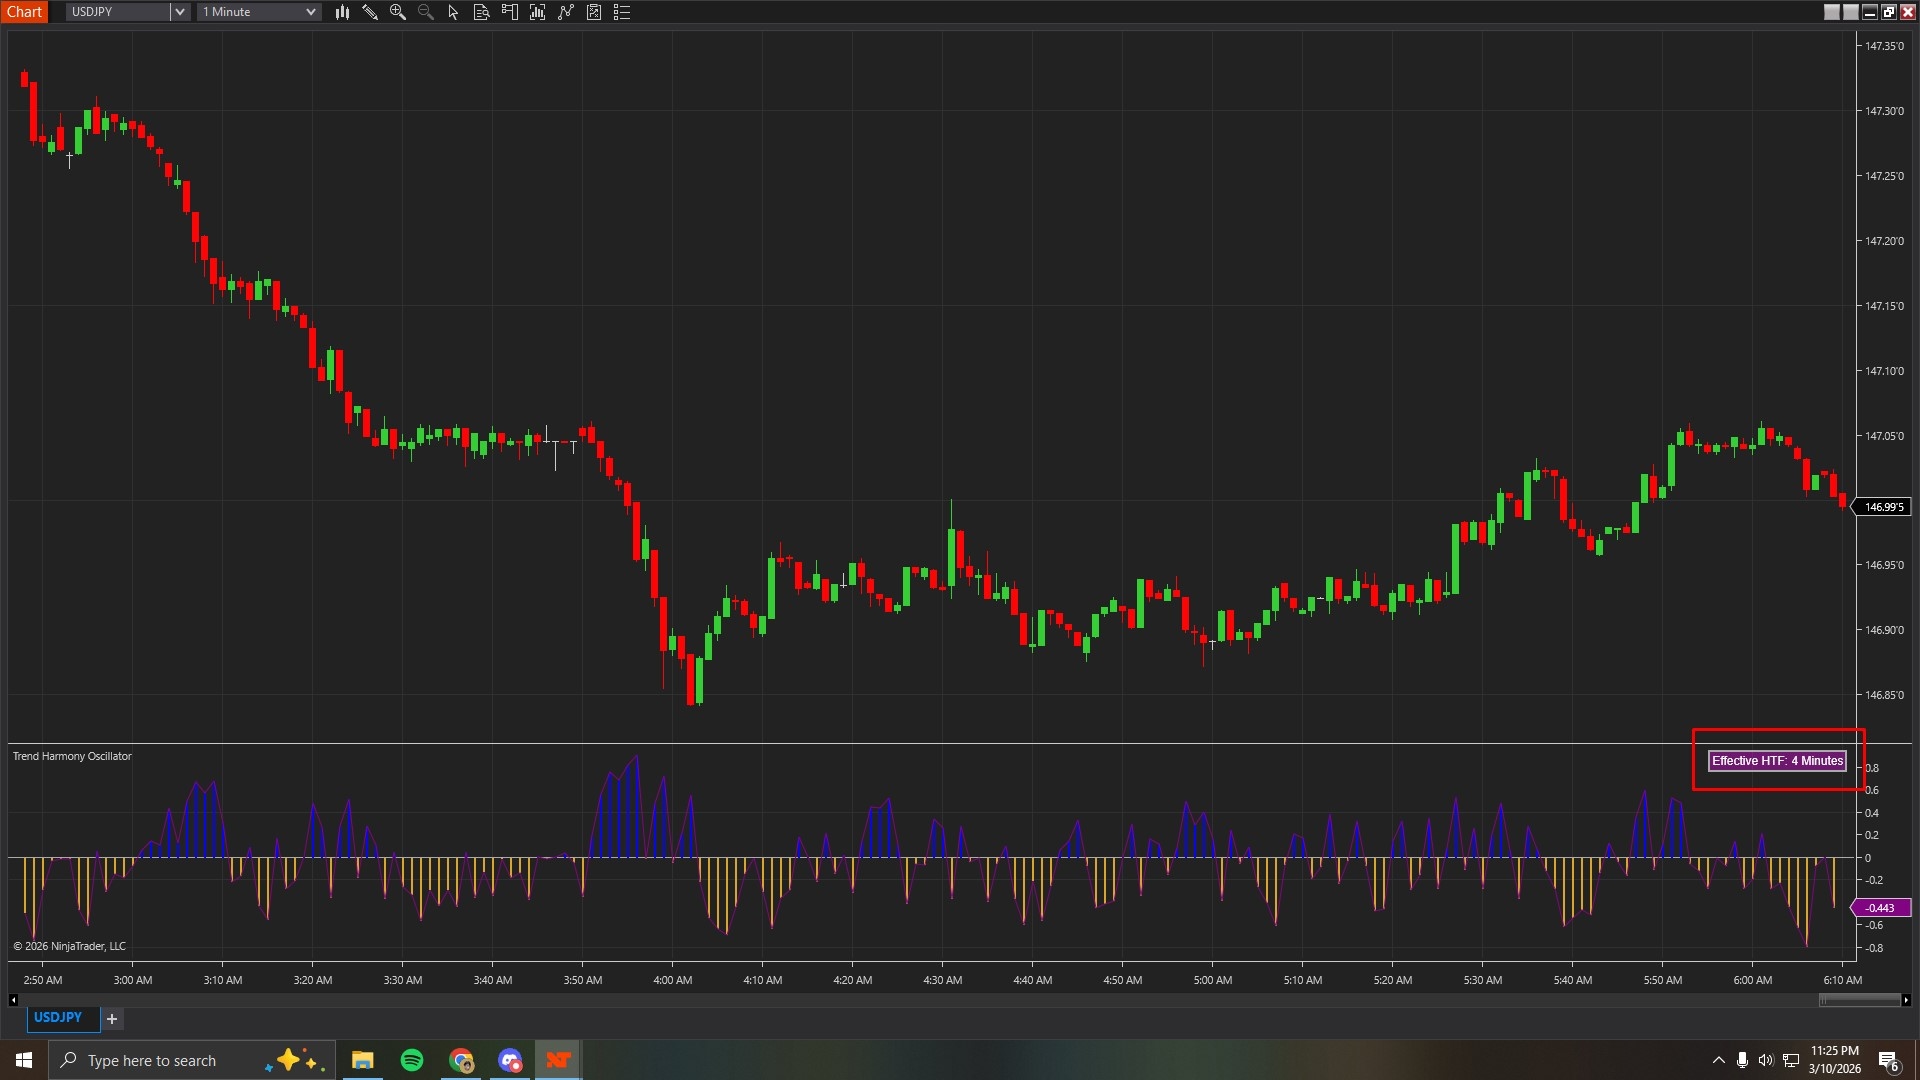
Image 3 (indicated by a white rectangle) displays perhaps the most important pattern: the oscillator hovering around zero, bouncing slightly above and below without committing to either threshold. This neutral zone indicates disagreement or weakness between your trading timeframe and the higher timeframe.
This is where many traders get chopped up. Price still moves—sometimes aggressively—but without clear directional alignment between timeframes, moves lack conviction and reverse unpredictably. When you see this neutral pattern, the best decision is often to reduce position size, increase selectivity for entries, or stay out entirely until stronger alignment appears.
Image 4 (highlighted by a red rectangle) shows the label that appears in the top-right corner of the indicator panel. This label displays "4x" or "5x" or whatever multiplier you've configured, telling you exactly what higher timeframe the indicator is using for comparison.
This transparency matters. If you're trading a 1-minute chart with a 5x multiplier, you're seeing alignment against an effective 5-minute trend. If you switch to a 5-minute chart with the same 5x multiplier, you're now measuring against a 25-minute trend. The label updates automatically so you always know your reference timeframe.
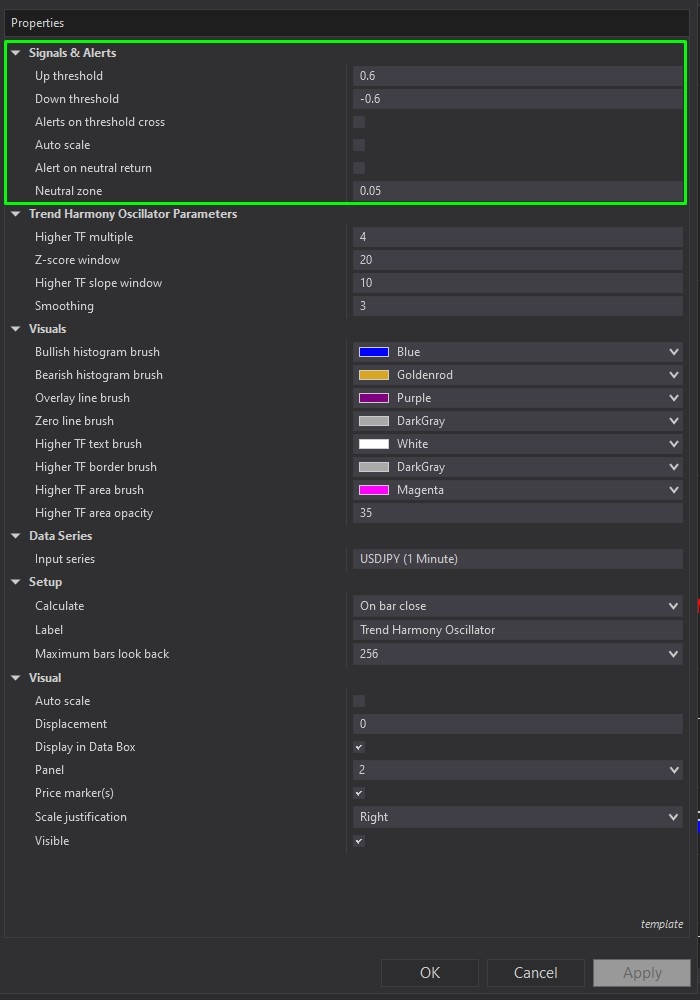
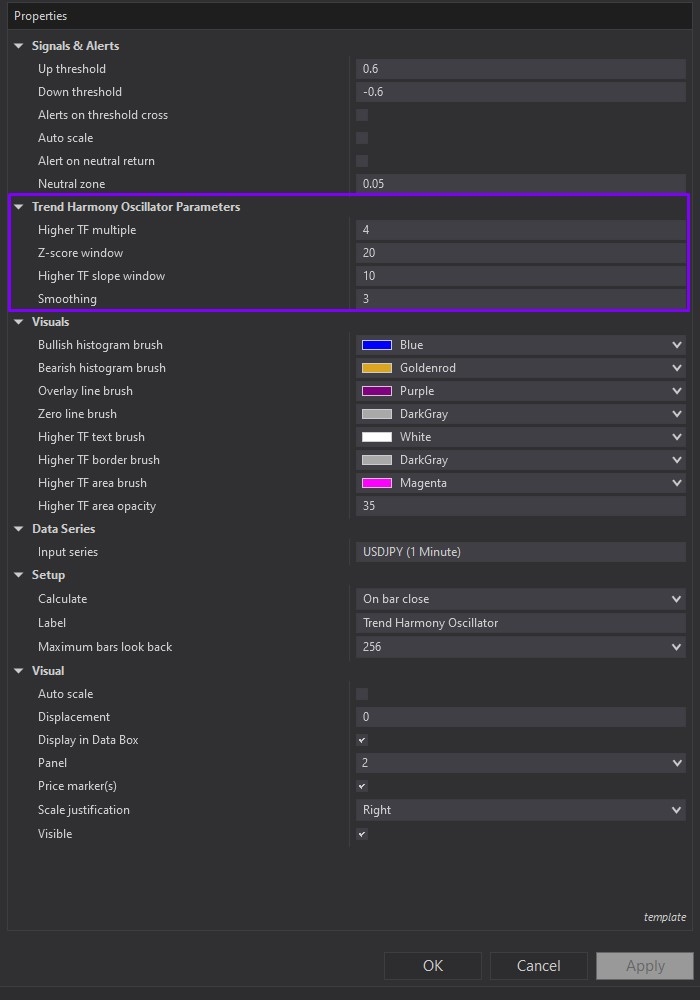
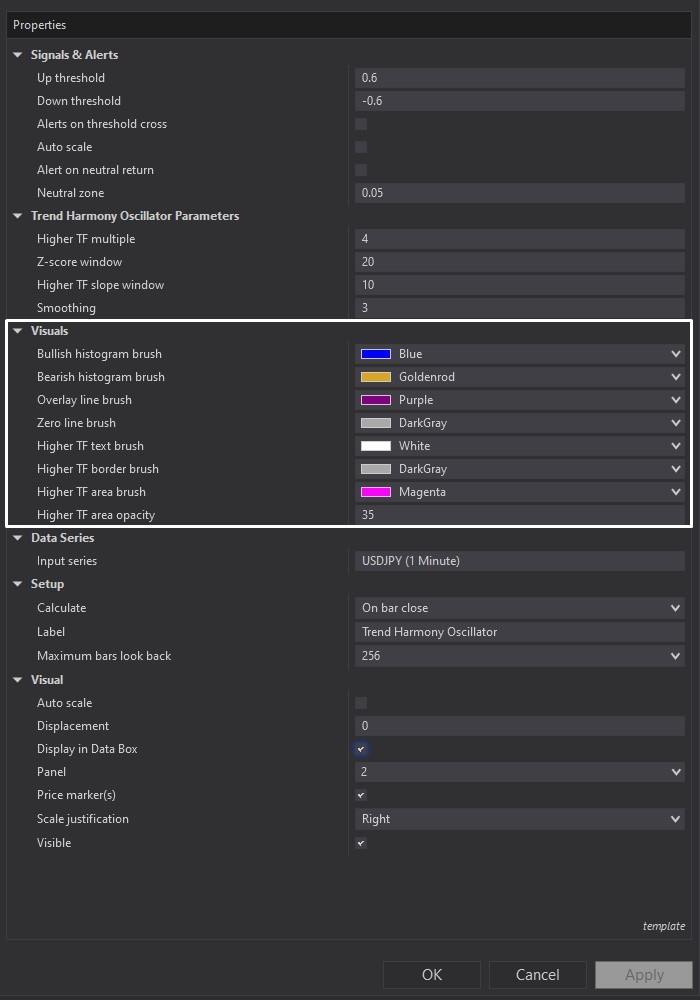
Image 5 (marked by the green rectangle) shows the Signals and Alerts section in the settings panel. The "Up Threshold" parameter (default 0.6) defines where bullish alignment becomes strong enough to matter. When the oscillator crosses above this level, conditions favour long setups. You can increase this value if you want more selective entries requiring very strong alignment, or decrease it for earlier signals.
The "Down Threshold" (default -0.6) works identically but for bearish conditions. When the oscillator drops below this level, conditions favour short setups.
"Alerts on Threshold Cross" toggles notifications when the oscillator crosses these boundaries—useful if you monitor multiple charts and want to be alerted when strong alignment appears.
"Auto Scale" controls whether the indicator panel automatically resizes to fit the oscillator values, keeping everything readable regardless of oscillator range.
"Alert on Neutral Return" triggers notifications when the oscillator moves back toward zero after showing strong alignment—warning that the quality of the current trend environment is deteriorating.
"Neutral Zone" (default 0.05) defines how close to zero the oscillator must get before being considered truly neutral. Tightening this zone makes neutral classification stricter.
Image 6 (highlighted by the purple rectangle) contains the core calculation controls. "Higher Timeframe Multiple" (default 4) determines how much larger the confirmation timeframe is compared to your chart. On a 1-minute chart with a 4x multiplier, you're measuring against an effective 4-minute trend. Increase this value to focus more on bigger trends. Decrease it for faster, more responsive alignment readings.
"Z-Score Window" (default 20) controls how much recent price movement gets used to normalize momentum readings. Smaller values make the oscillator react quickly to recent changes. Larger values produce smoother, more stable readings.
"Higher TF Slope Window" (default 10) determines how the higher timeframe trend direction gets calculated. Smaller windows react faster to trend changes. Larger windows create more stable trend measurements that don't flip direction on minor retracements.
"Smoothing" (default 3) applies light smoothing to the final oscillator output. Higher smoothing values create cleaner, more stable signals. Lower values make the indicator react more immediately to price changes.
Image 7 (marked with white boxes) displays the Visual section where you control appearance. "Bullish Histogram Brush" sets the colour for positive bars (typically green). "Bearish Histogram Brush" sets the colour for negative bars (typically red). "Overlay Line Brush" controls the smooth line drawn over the histogram to help visualise oscillator movement.
"Zero Line Brush" changes the centre reference line colour—the boundary between bullish and bearish territory. "Higher TF Text Brush" controls the label text colour. "Higher TF Border Brush" and "Higher TF Area Brush" control the label's border and background colours. "Higher TF Area Opacity" adjusts label background transparency.
These controls ensure the indicator remains readable on any chart colour scheme, whether you use dark mode, light mode, or custom themes.
When you download Trend Harmony Oscillator from rizecap.com, you receive the complete NinjaScript .cs source file. The code includes detailed comments explaining how momentum gets measured, how higher timeframe slope is calculated, how normalisation works, and how the final oscillator value gets computed.
If you understand programming, you can modify the calculations—perhaps using different momentum measures, alternative trend detection methods, or custom normalisation approaches. For developers building systematic strategies, the oscillator calculation can be extracted and used as a filter condition: only allow long trades when oscillator > upper threshold, only allow short trades when oscillator < lower threshold.
Even if you're not a programmer, having the source code provides transparency. You're not relying on a mysterious black box calculation. You can verify exactly how the indicator works, which builds confidence in the signals it produces.
For questions about optimal multiplier settings for different trading styles, understanding when neutral zones resolve into trends, or integrating the Trend Harmony Oscillator with your existing indicators and strategies, watch the complete video tutorial above. It demonstrates the indicator across various market conditions and explains exactly how to interpret what you're seeing.
Secure payment via PayPal
By downloading, you agree with our Terms & Conditions

