Range Market Scalping Strategy
This is a fully automated trading strategy developed for NinjaTrader 8.0.x.x and 8.1.x.x versions. It works with any instrument in any financial market. This pro-level strategy is developed focusing on the range bound market, i.e. when the market is moving sideways. The majority of the time, most of the instruments in financial markets move sideways, and this automated strategy will place automated entry and profit targets as per your own settings. It has 3 different types of Stop Loss settings for you to choose from. Since not every instrument in the market has the same volatility, you can choose your Stop Loss from ATR Stop Loss, Swing High & Low Stop Loss, and Fixed Distance Stop Loss. If you can choose the correct Stop Loss for your trading, you will find this strategy amazing. This strategy can be configured to limit trade placement for individual day and time ranges to find the best possible trade opportunities. When you watch the video tutorial, you should be able to learn more about how to effectively use this strategy on charts and restrict your trading sessions with trading time ranges. One of the other amazing features of this automated strategy is that if you close the chart or platform for any reason, when you restart the platform and open the chart with this strategy keeping the same settings on, it will re-calculate open positions and will resume following your settings as if therewas no interruption. You just need to find the right settings and combinations for your trading style. Why don’t you watch the video tutorial and try this strategy for FREE for 1st month and test it yourself.
Watch the video tutorial
Click to play video
Range Market Scalping Strategy
STRATEGY
Please Register for FREE account or Login to subscribe to this strategy.
Key Features
- 1st month FREE TRIAL
- Access to all future updates
- 24/7 update and technical support
- Cancel subscription anytime
By subscribing, you agree with our Terms & Conditions
Gallery
See how the Range Market Scalping Strategy looks in action with these screenshots
Strategy Details
Learn how to use the Range Market Scalping Strategy to improve your trading
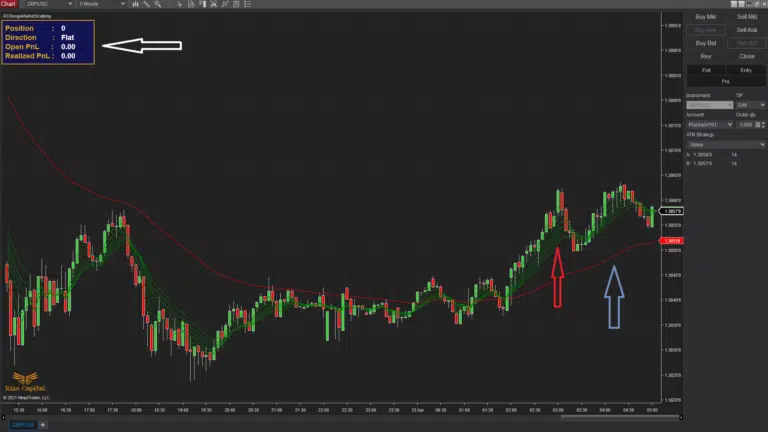
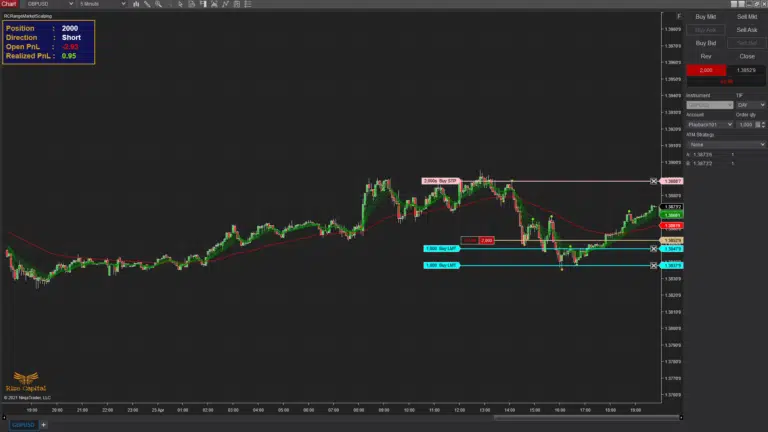
When enabling the Range Market Scalping strategy on a NinjaTrader 8 chart, the following elements are plotted (Image 1):
- A Base EMA line (red, indicated by a blue upward arrow).
- Multiple EMA lines in varying colours (dependent on settings, marked with a red upward arrow).
- An info panel at the top-left corner (highlighted by a white left arrow) displays strategy details.
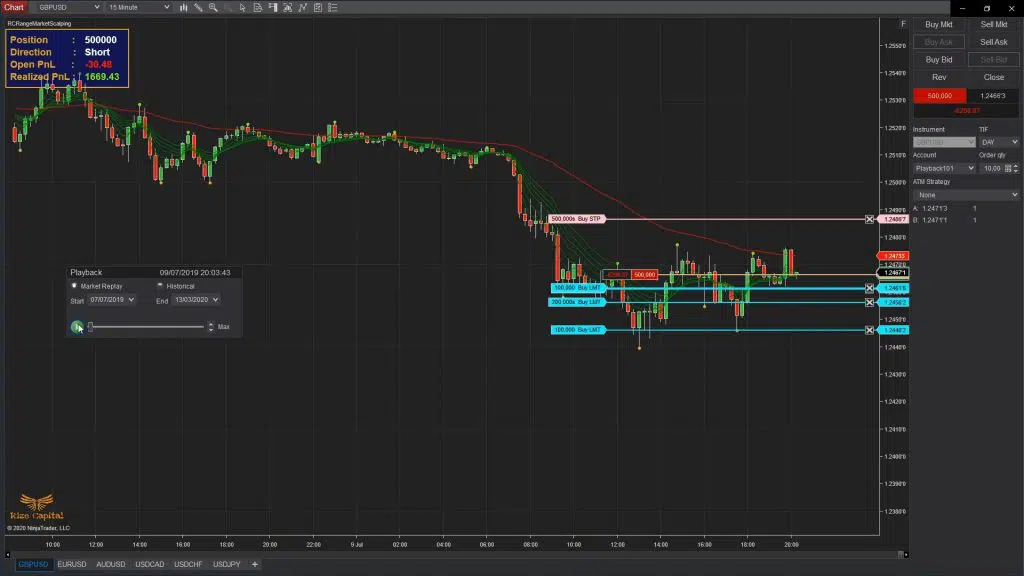
Depending on your settings, which will be discussed below, it will enter positions using multiple entries as long as the market is ranging. The subsequent entry prices are determined by the ‘Re-Entry Offset’ parameter. Specifically, if the price moves away from the previous entry by the defined tick distance (in either direction), a new position of the preset quantity is opened in the current trend direction. Exits follow 3 predefined methods (detailed below). A daily stop-loss limit can be set via the parameter highlighted in lime green (Image 7). If the day’s loss exceeds this limit, new entries are blocked, but existing positions continue to exit. The limit resets the next trading day.
The info panel (top-left) shows the current position size, direction (Long/Short), open P/L, and realised P/L.
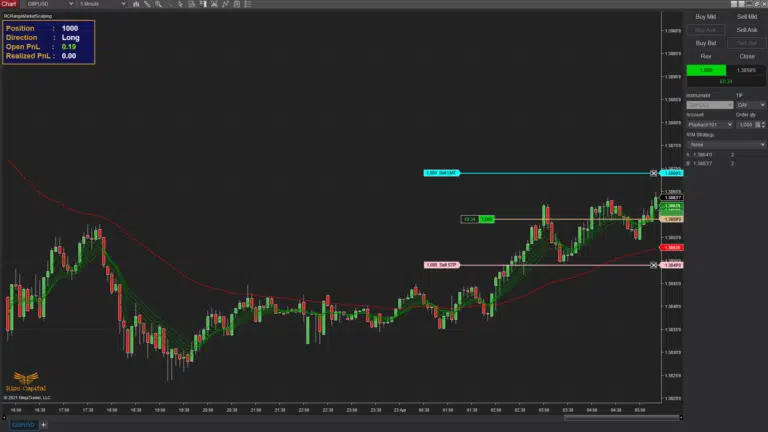
If you select the ‘StopLoss’ option as ‘StopLossDistance’ (Image 8, white rectangle and left arrow), strategy positions will exit via fixed stop-loss and profit targets (Image 2). The stop-loss distance from entry is defined by the ‘StopLossDistance’ parameter (lime green rectangle, Image 7). Profit target distance is determined by the ‘Re-Entry Offset’ values. It means, if you have chosen ‘Re-Entry Offset’ 50 ticks and selected ‘TargetRatio’ 2, then the Profit target will be placed at 100 ticks away from the entry price.
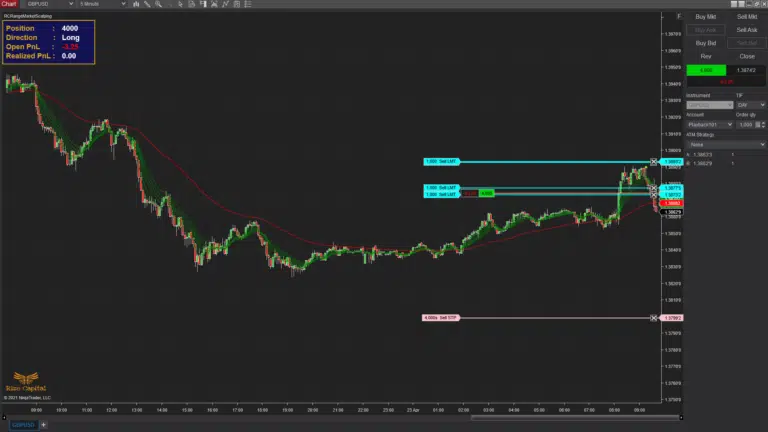
If you select ‘StopLoss’ as ‘ATRStopLoss’ (highlighted within the white rectangle in Image 8), the stop-loss to exit positions is placed based on the ATR value. You can control the ATR calculation period via the ‘ATRPeriod’ parameter (shown within the lime green rectangle in Image 7). By default, the stop-loss is set at 1× ATR value from the entry. To increase this distance, input a higher value in ‘ATRMultiplier’, which multiplies the ATR value to set the stop-loss relative to the entry price. This setup resembles Image 3. Since the ATR value remains fixed, the stop-loss distance stays constant even with multiple entries. Profit targets are determined by the previously discussed ‘Re-Entry Offset’ and ‘TargetRatio’.
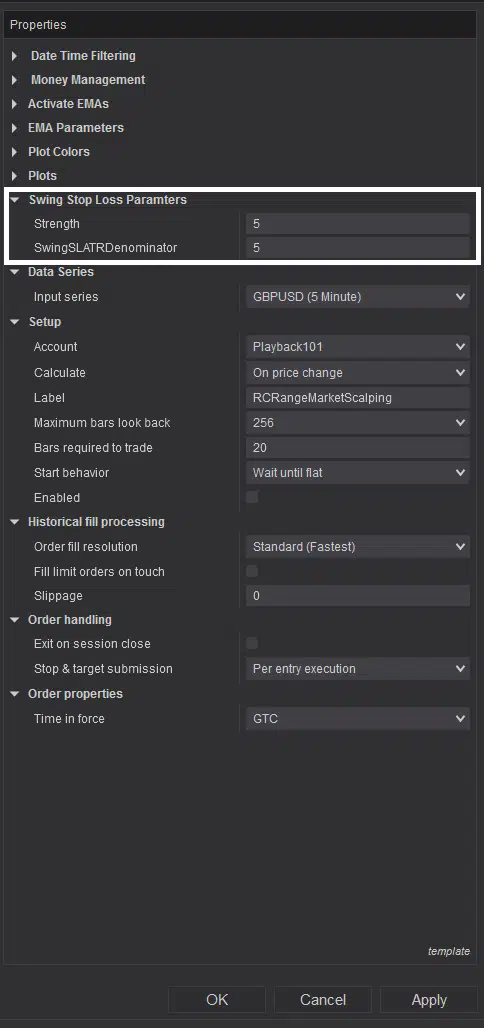
If you select ‘StopLoss’ as ‘SwingStopLoss’, both stop-loss and profit targets will be placed automatically based on recent swings and the ATR value upon strategy entry. Now, you can select the strength to be used to calculate the swings by inputting a value in the parameter ‘Strength’ (within the white rectangle in Image 12). The stop-loss distance is calculated as ATR value ÷ ‘SwingSLATRdenominator’, relative to the latest swing high/low (aligned with entry direction). Configure ‘SwingSLATRdenominator’ via its parameter (also in Image 12; white rectangle). If no swings exist initially, the stop-loss defaults to 1 ATR value from the entry. Once swings form, the stop-loss adjusts dynamically to the latest swings. Note: Swings plotted with dots must be above/below the ‘Base EMA’s current value (depending on entry direction) to trigger automatic stop-loss adjustments.
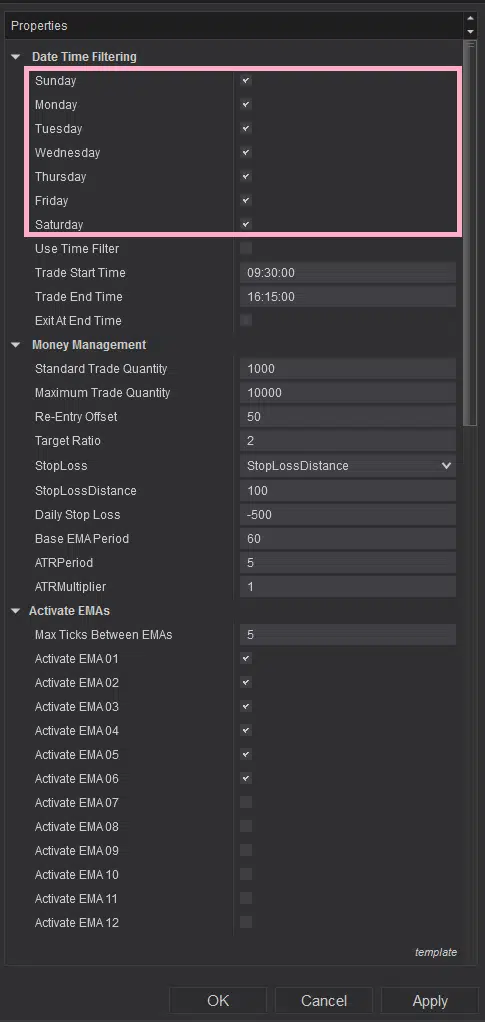
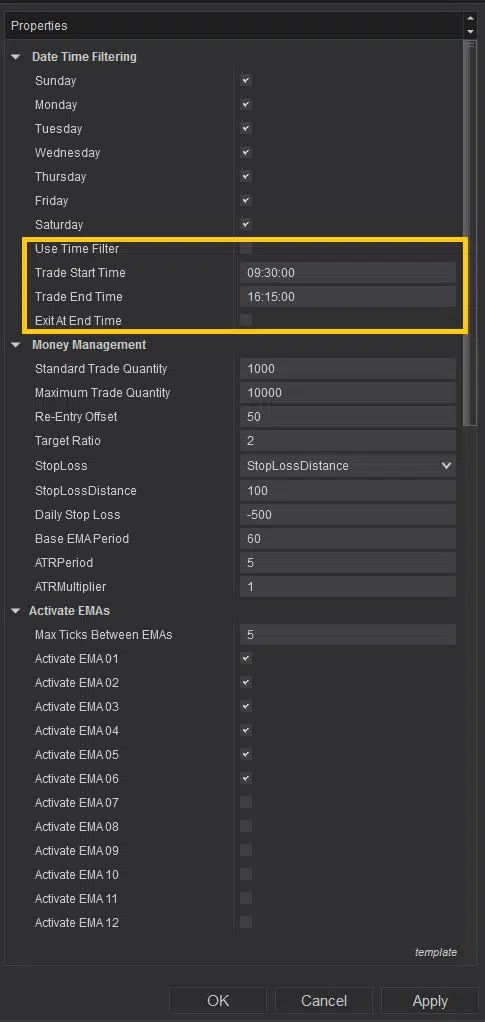
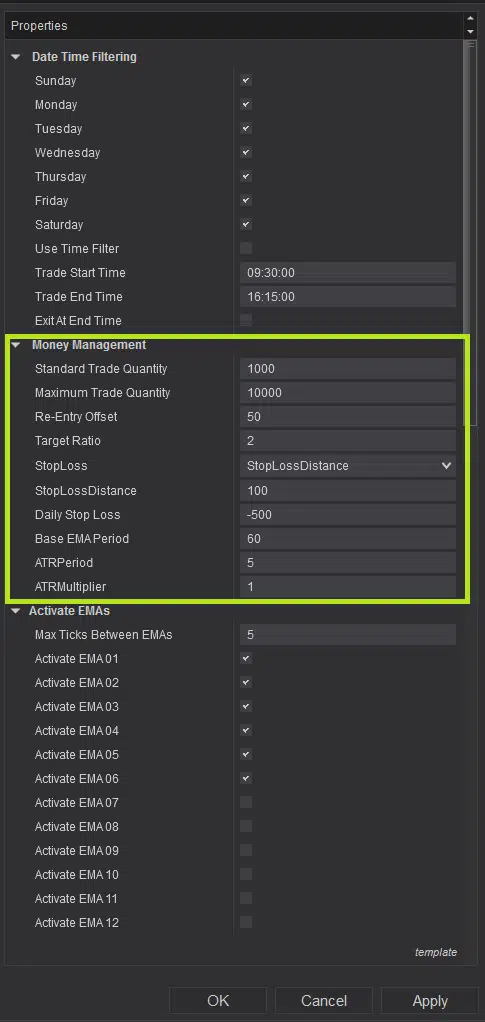
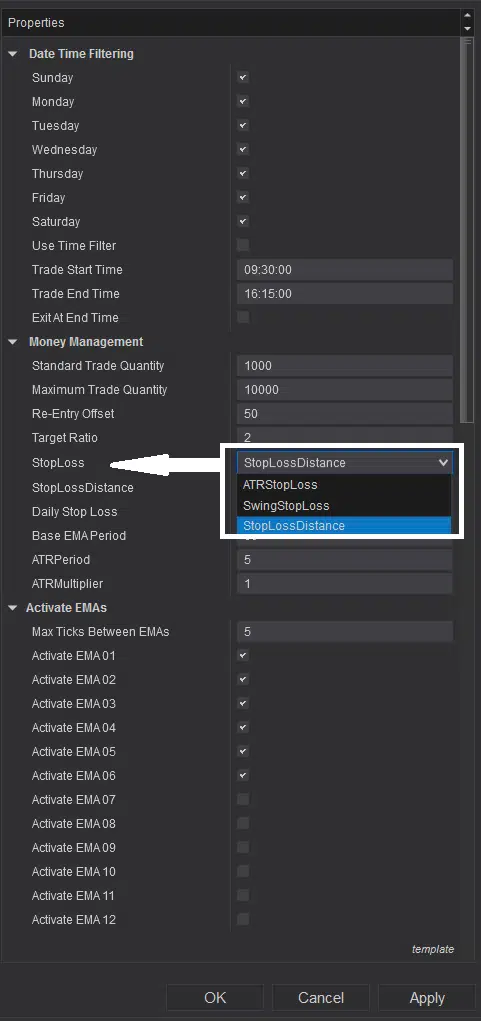
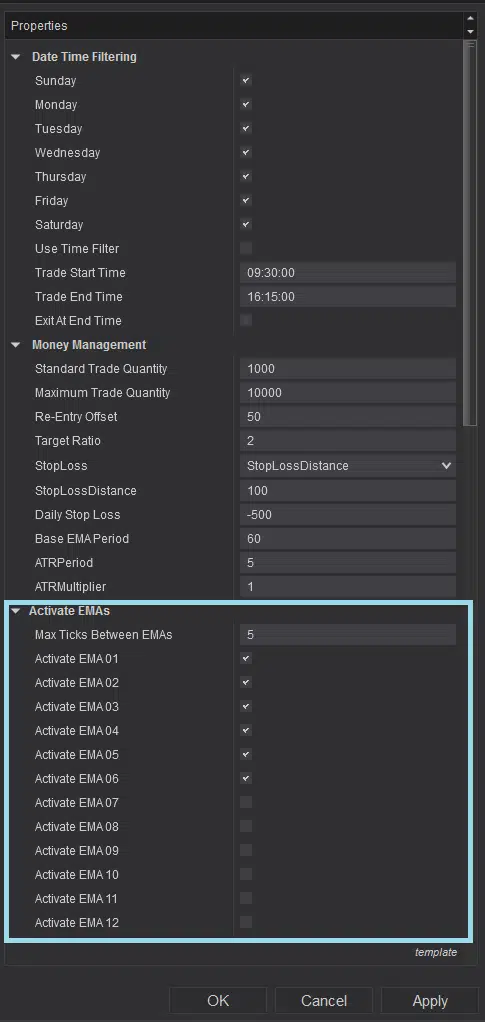
To select specific days for strategy entries, check the boxes beside individual days in the settings (highlighted by a pink rectangle in Image 5). To filter entries within the same day by time range, adjust the settings in the highlighted yellow rectangle in Image 6. Ensure you check the ‘Use Time Filter’ box to activate the time filter. To force exits regardless of stop-loss or profit targets at the end of the selected time range, enable the ‘Exit At End Time’ parameter (yellow rectangle, Image 6). The trade quantity per entry is set via ‘Standard Trade Quantity’, while risk management is controlled by ‘Maximum Trade Quantity’ (both within the lime-green rectangle in Image 7). Once the maximum quantity is reached, no new positions will be entered until existing ones are reduced through exits.
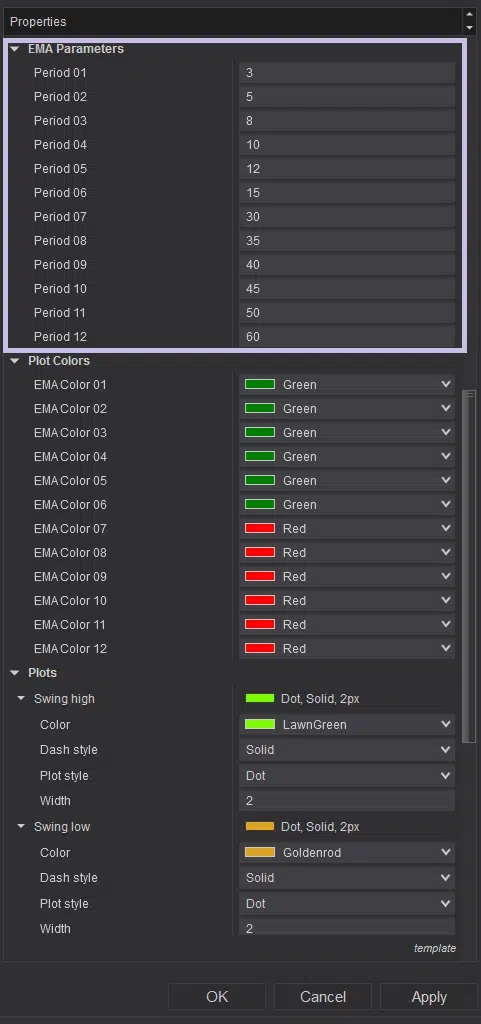
12 EMAs are used to determine whether the market is ranging; you can select how many to use for this analysis by checking the boxes beside each EMA (highlighted by a light blue rectangle in Image 9). Define the ‘Max Ticks Between EMAs’ parameter to set the maximum spread between EMAs you prefer before the market is classified as ranging. Adjust the periods for these EMAs via the section highlighted by a purple rectangle in Image 10.
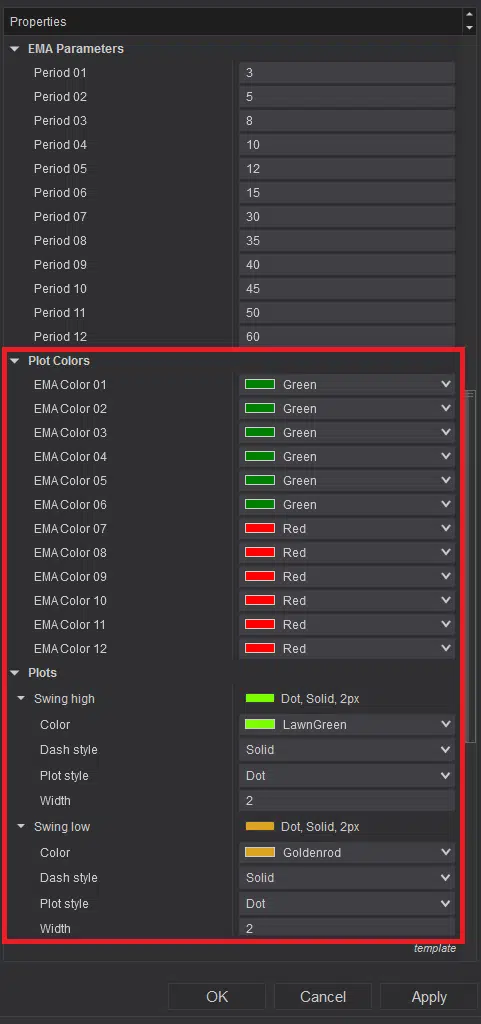
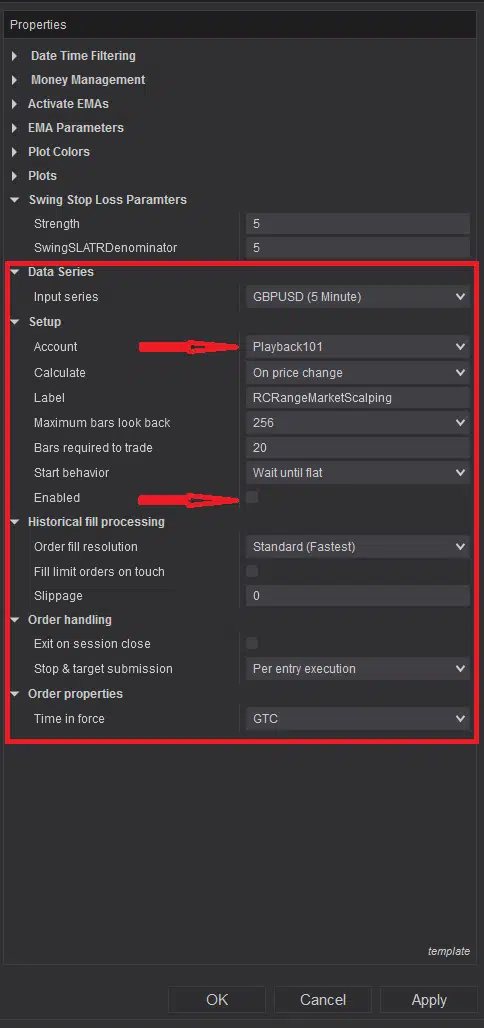
You can customise the EMA line colours by changing colours beside each of them from the settings highlighted by the red rectangle in Image 11. You can also customise the swing high and low plots, which are also highlighted within the same rectangle. It is highly recommended not to change any default settings which are highlighted within the red rectangle in Image 13, except the ‘Account’ and ‘Enabled’ options highlighted by a red right arrow, for proper functioning of this strategy.
If you still have further query on how this strategy works, please watch the video tutorial above in this page.
Version History
See how the Range Market Scalping Strategy has evolved over time
Version 5.3.0.1
- Auto upgrade bug fixed.
- Separate version for NinjaTrader 8.1.x.x is published.
Version 5.2.0.1
- This can be used on any instrument.
- Can be used for both Long Term and Short Term trade entries.
- Script Optimized.
- Auto update and announcement added.