You PAY NOTHING for using this indicator. There is no minimum term, if you don’t like it – you can cancel your subscription any time you want.
Please Register for FREE account or Log in before you proceed. You need to be logged in before you can download and also provide the requested below information.
Watch the video to know more about
Zone Drawing - Free Indicator
FREE for Lifetime
Save money every month
Access to all future updates to this indicator
24/7 update and technical support
Cancel subscription anytime
Zone Drawing - Additional Features Subscription
Details of the ‘Additional Features’ can be found below in ‘Indicator Details’ section. To Learn more Click here
Additional Features with FREE version for only £9 /month.
Your subscription will be processed through Paypal
If you are already subscribed to this and want to unsubscribe, Please click here
Indicator Details:
Image - 1 (Click to ZOOM)
This amazing custom programmed FREE for LifeTime indicator offered by Rize Capital for traders and investors to use in NinjaTrader 8.0.x.x and 8.1.x.x platform. You can easily draw Demand/ Supply or Support/ Resistance zones or levels according to your needs with this indicator on your charts. And its completely FREE to use, therefore you don’t pay for using it. This very useful Zone Drawing indicator helps you to draw zones or levels in different time frames and all zones can be seen from other lower TF charts without changing the chart TF. We are going to provide more details below on how to use this indicator.
Image - 2 (Click to ZOOM)
Image - 3 (Click to ZOOM)
Image - 4 (Click to ZOOM)
Image - 5 (Click to ZOOM)
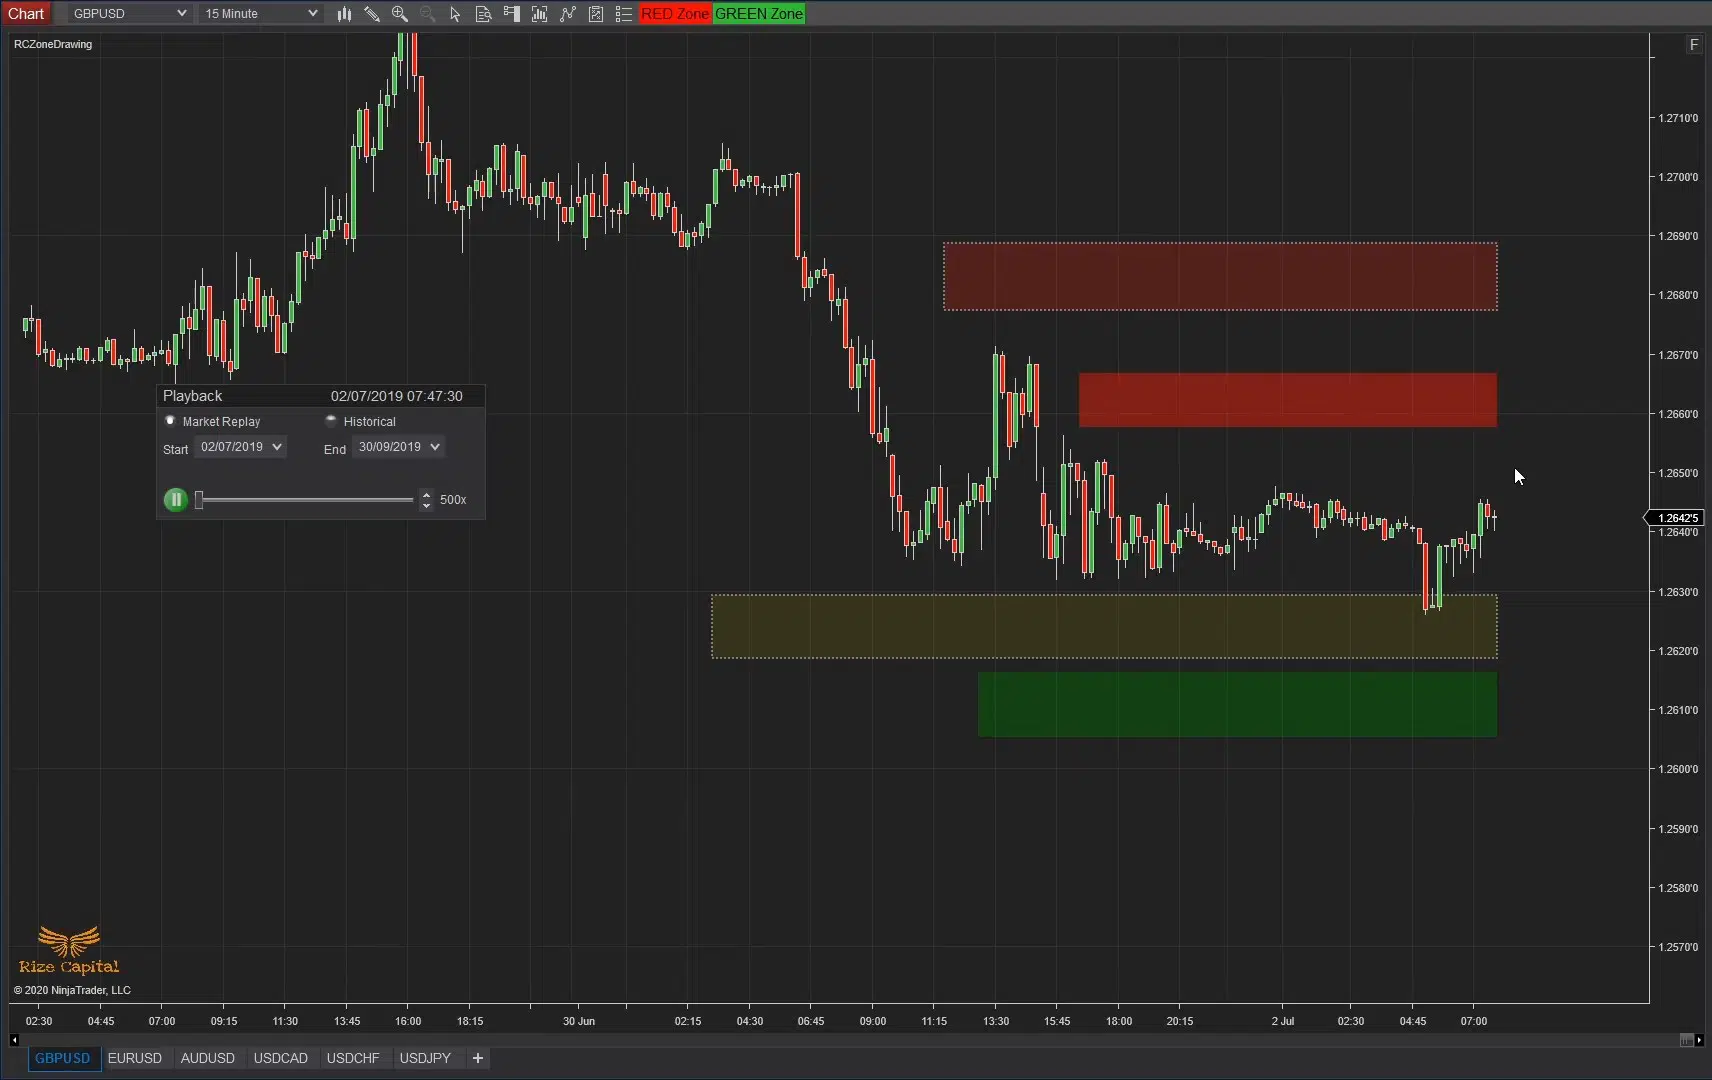
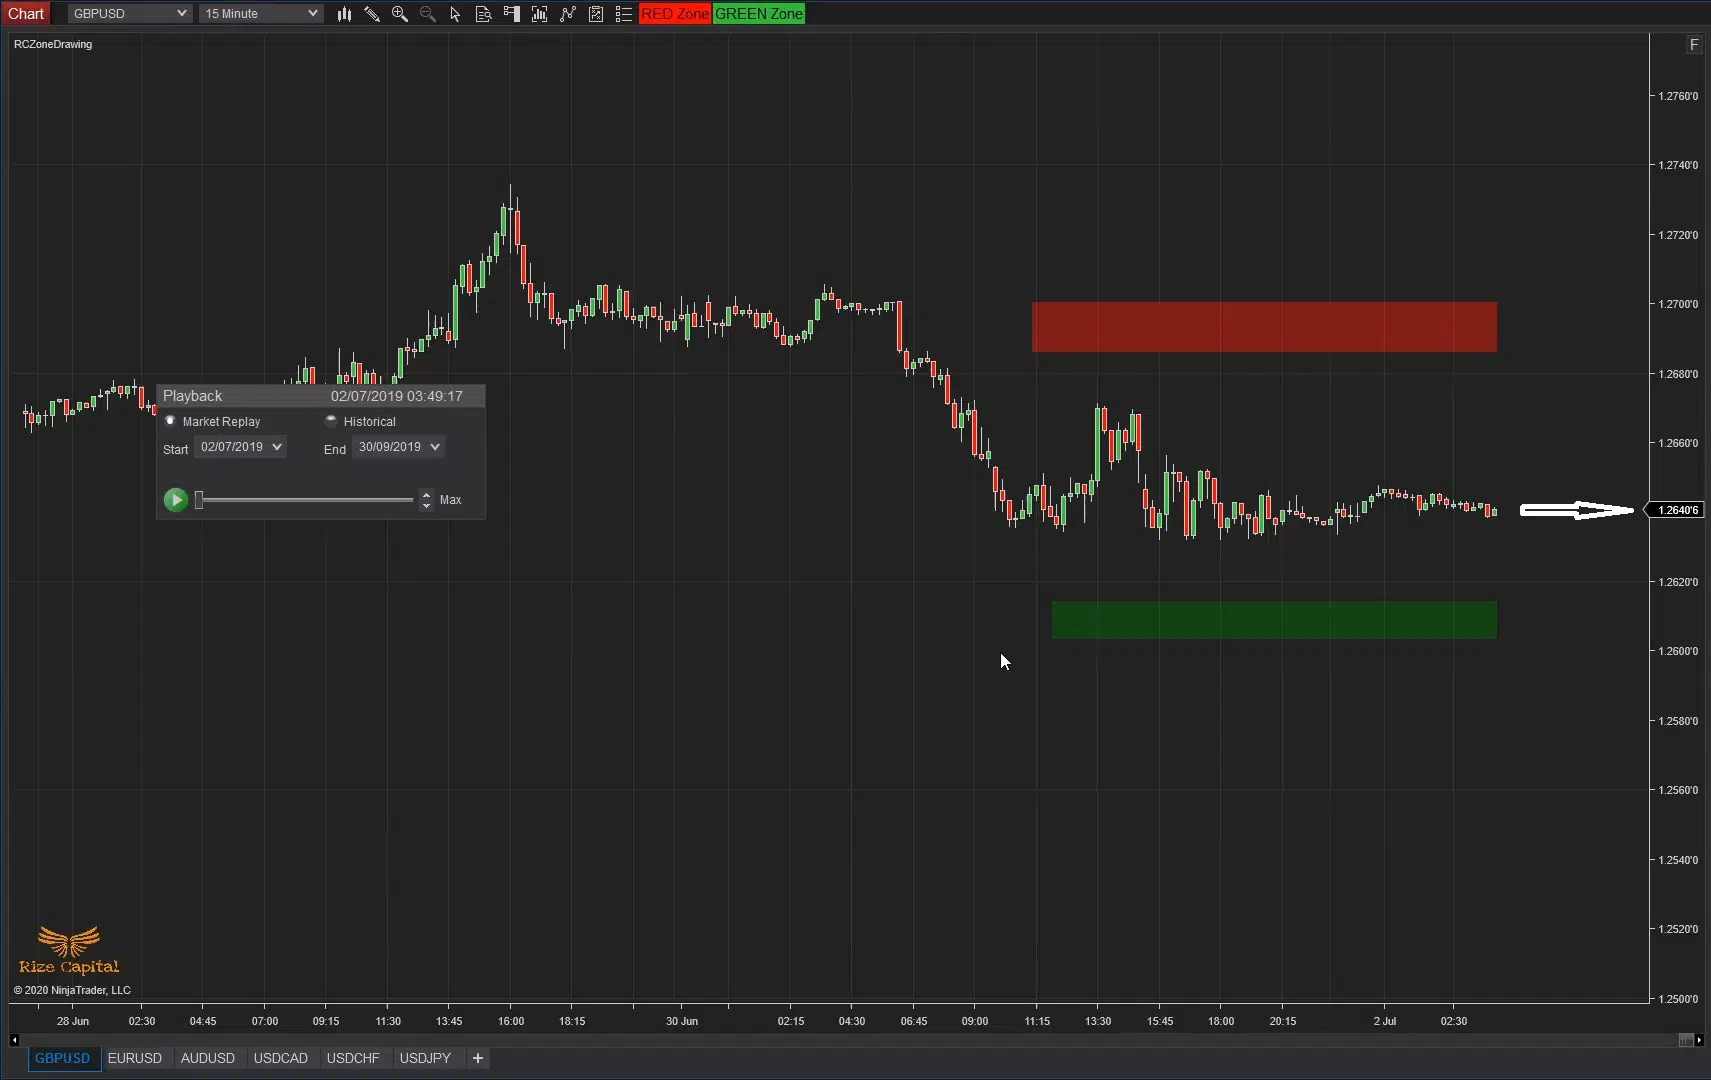
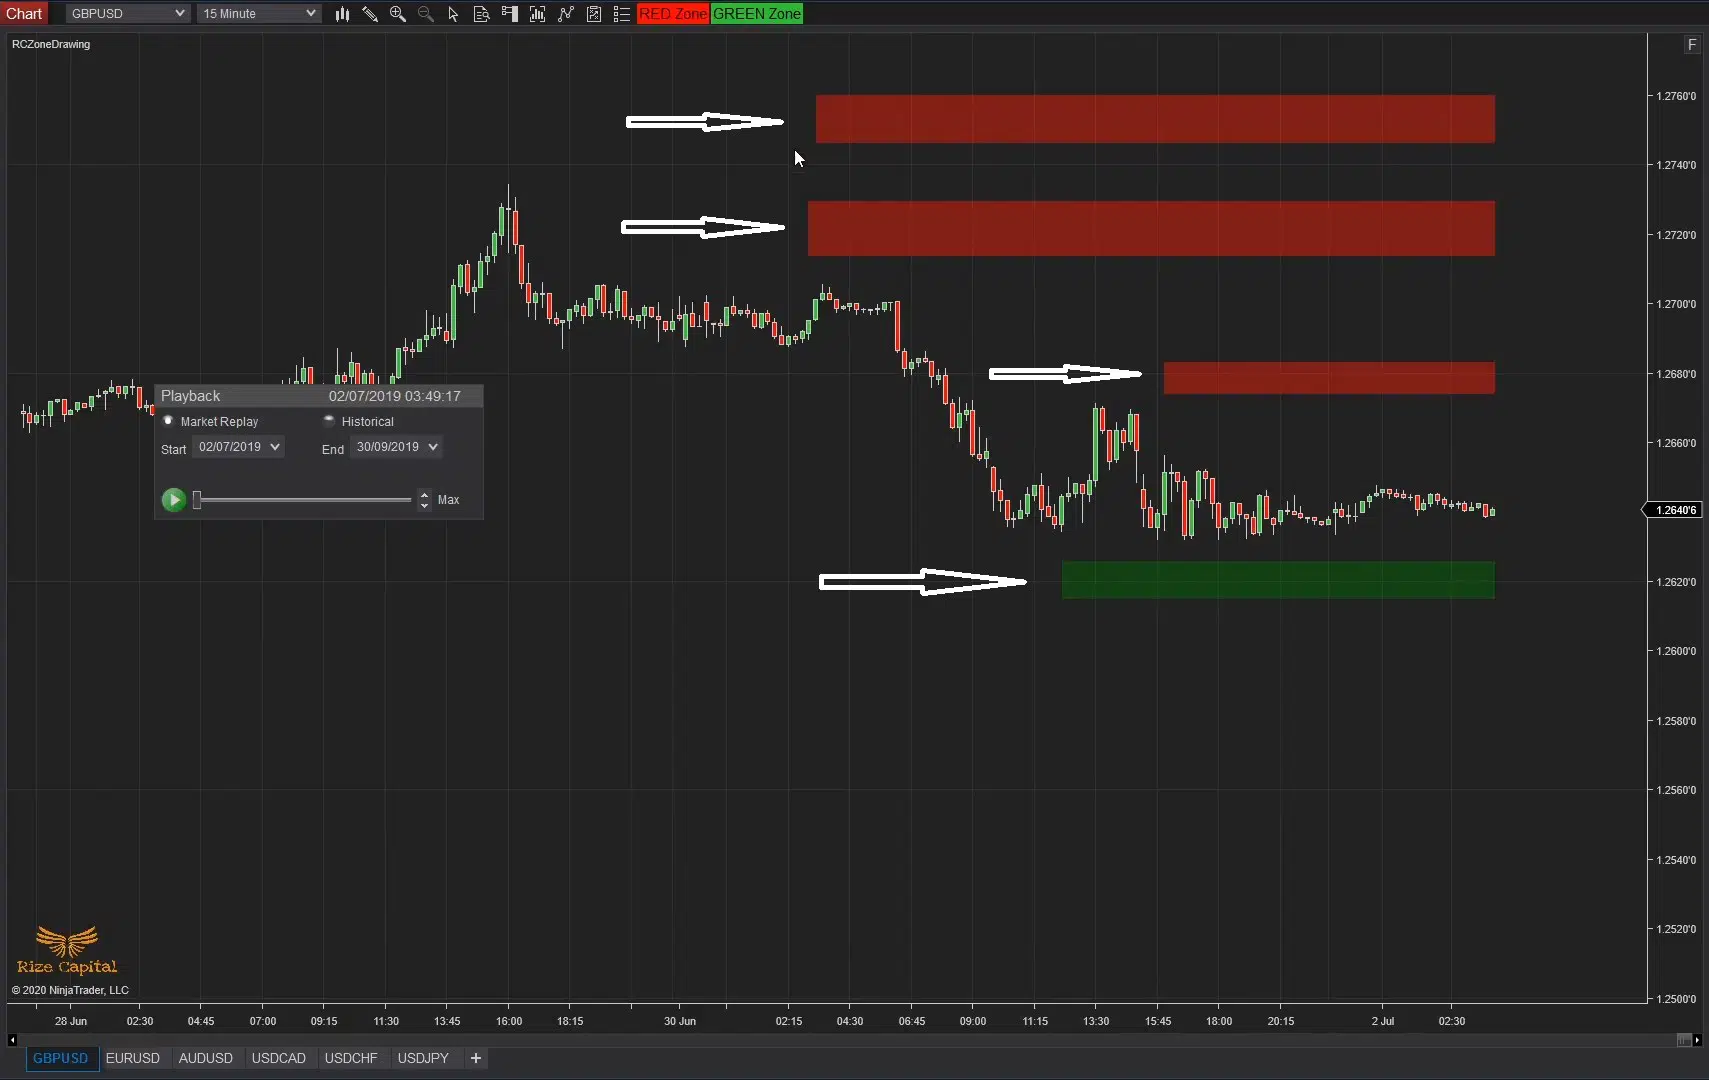
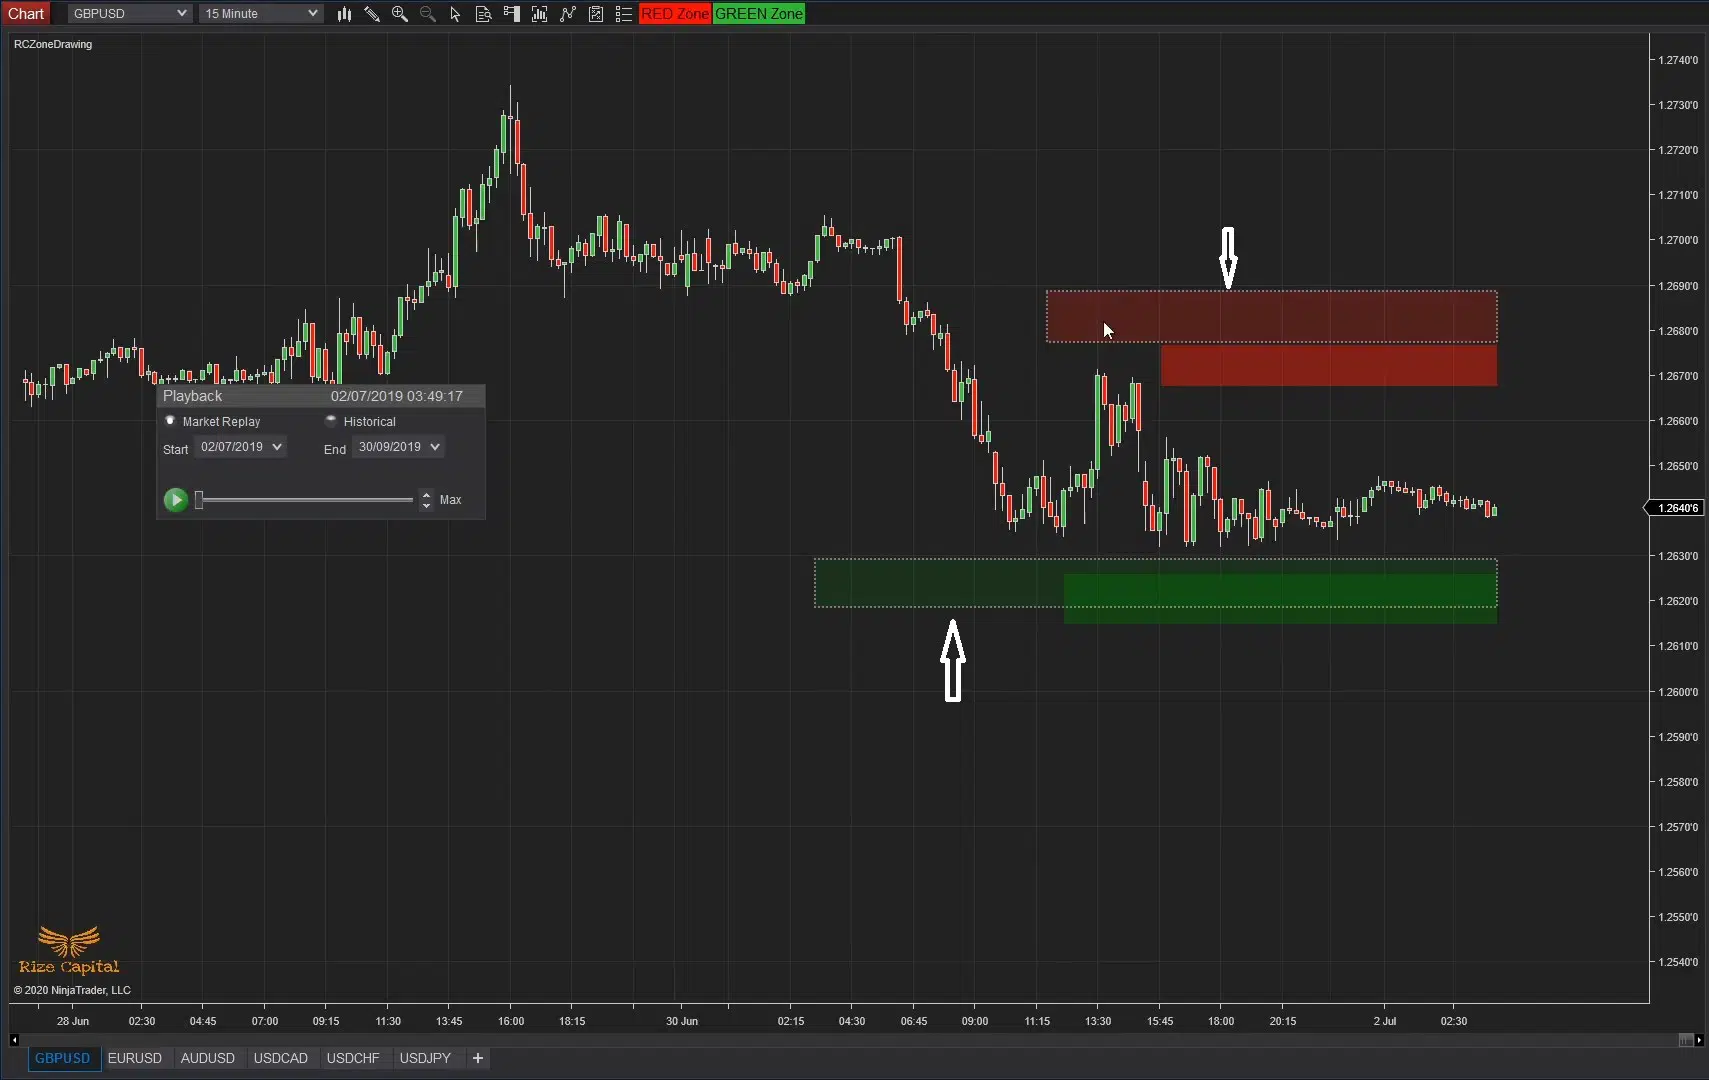
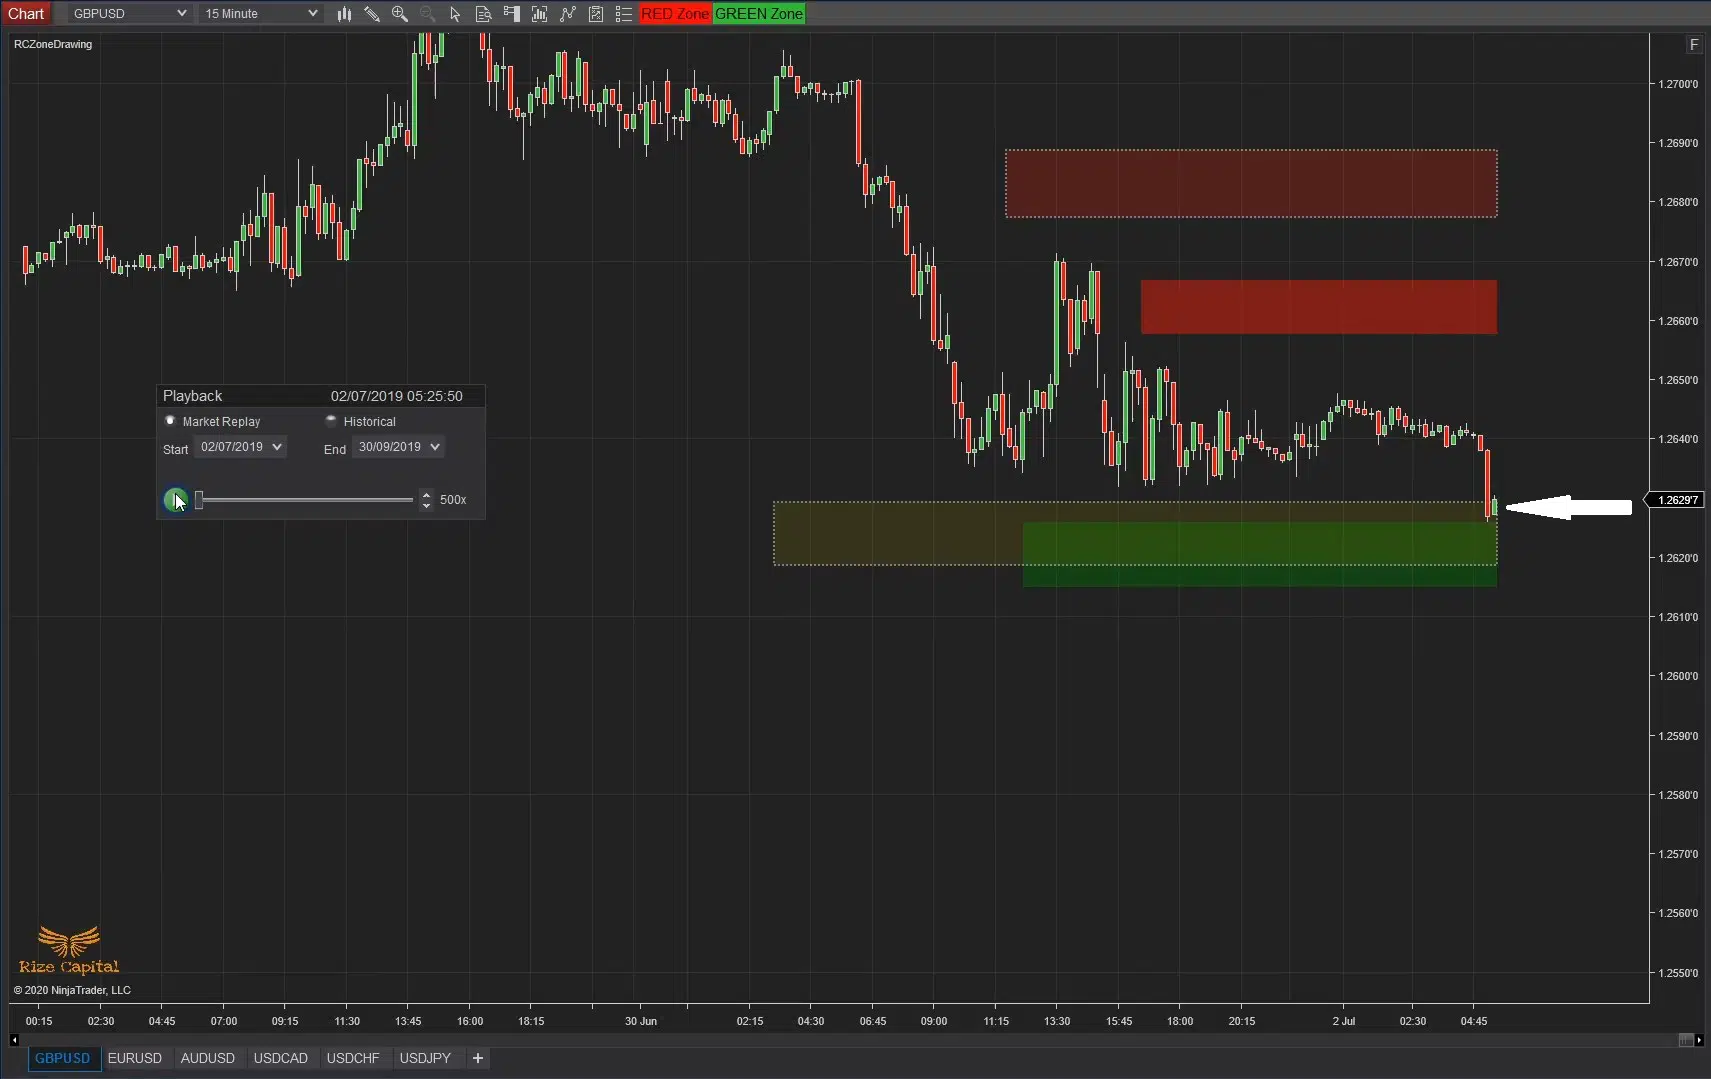
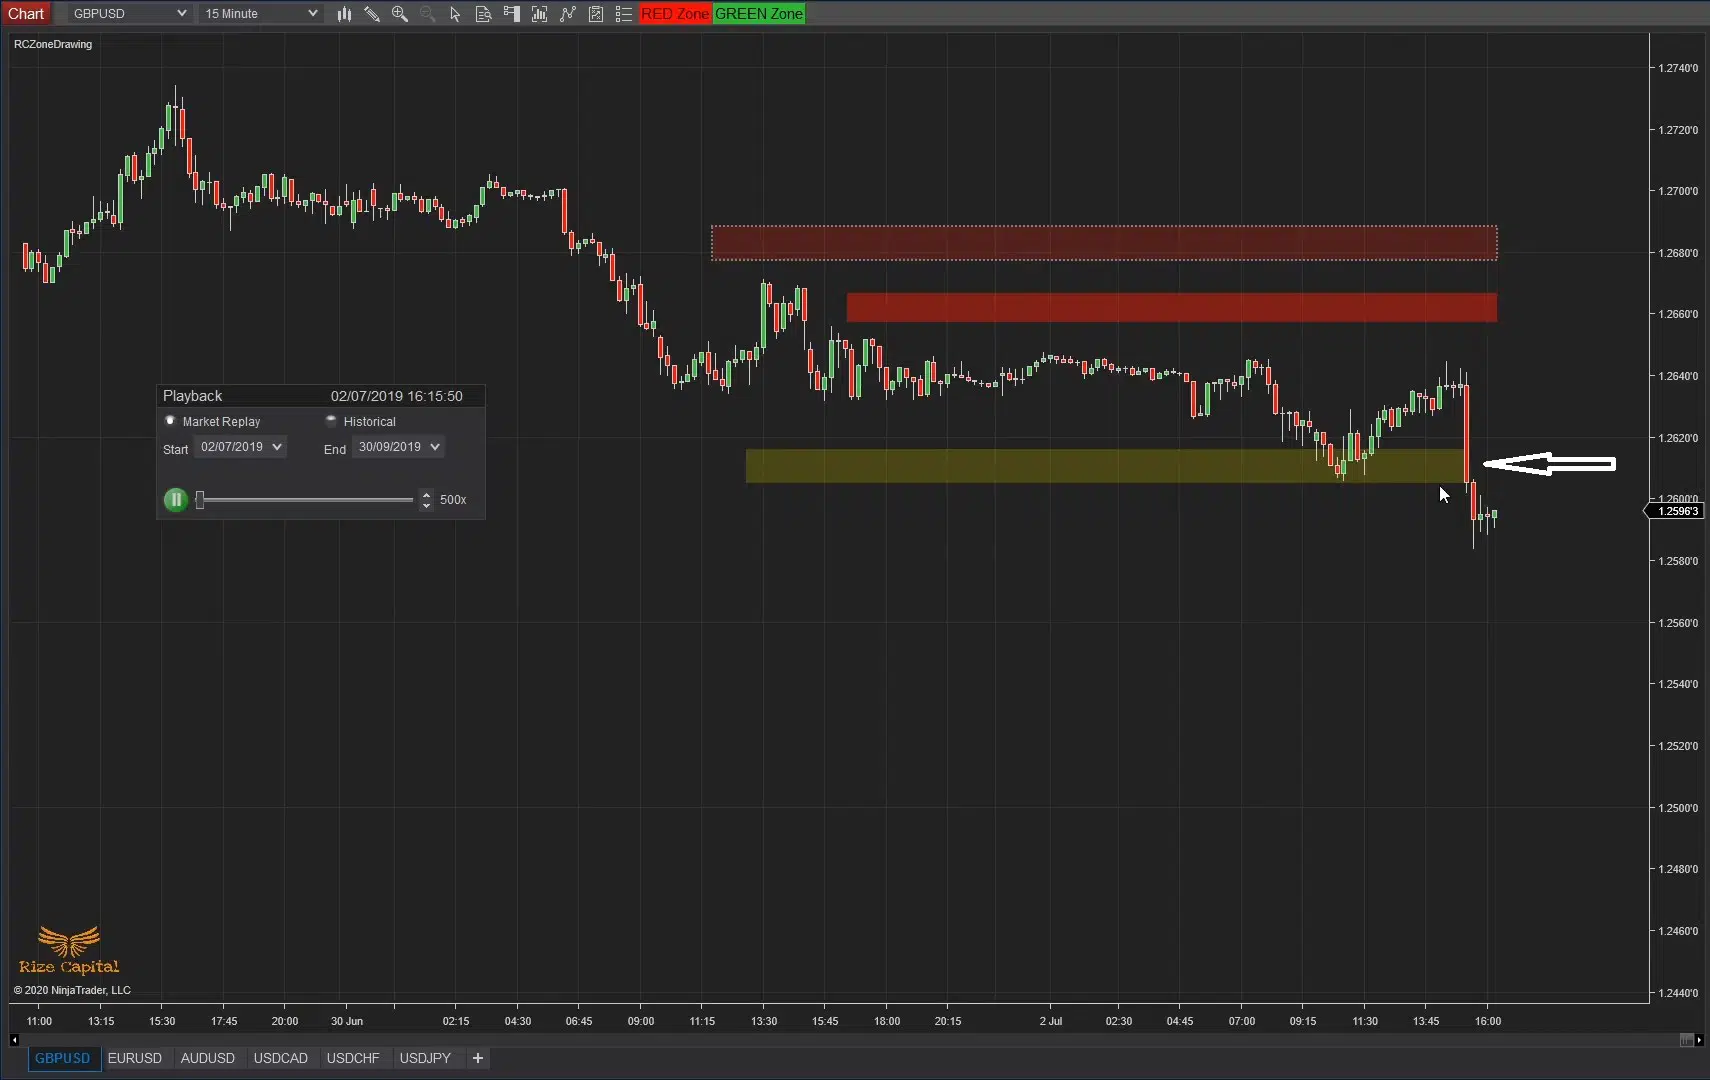
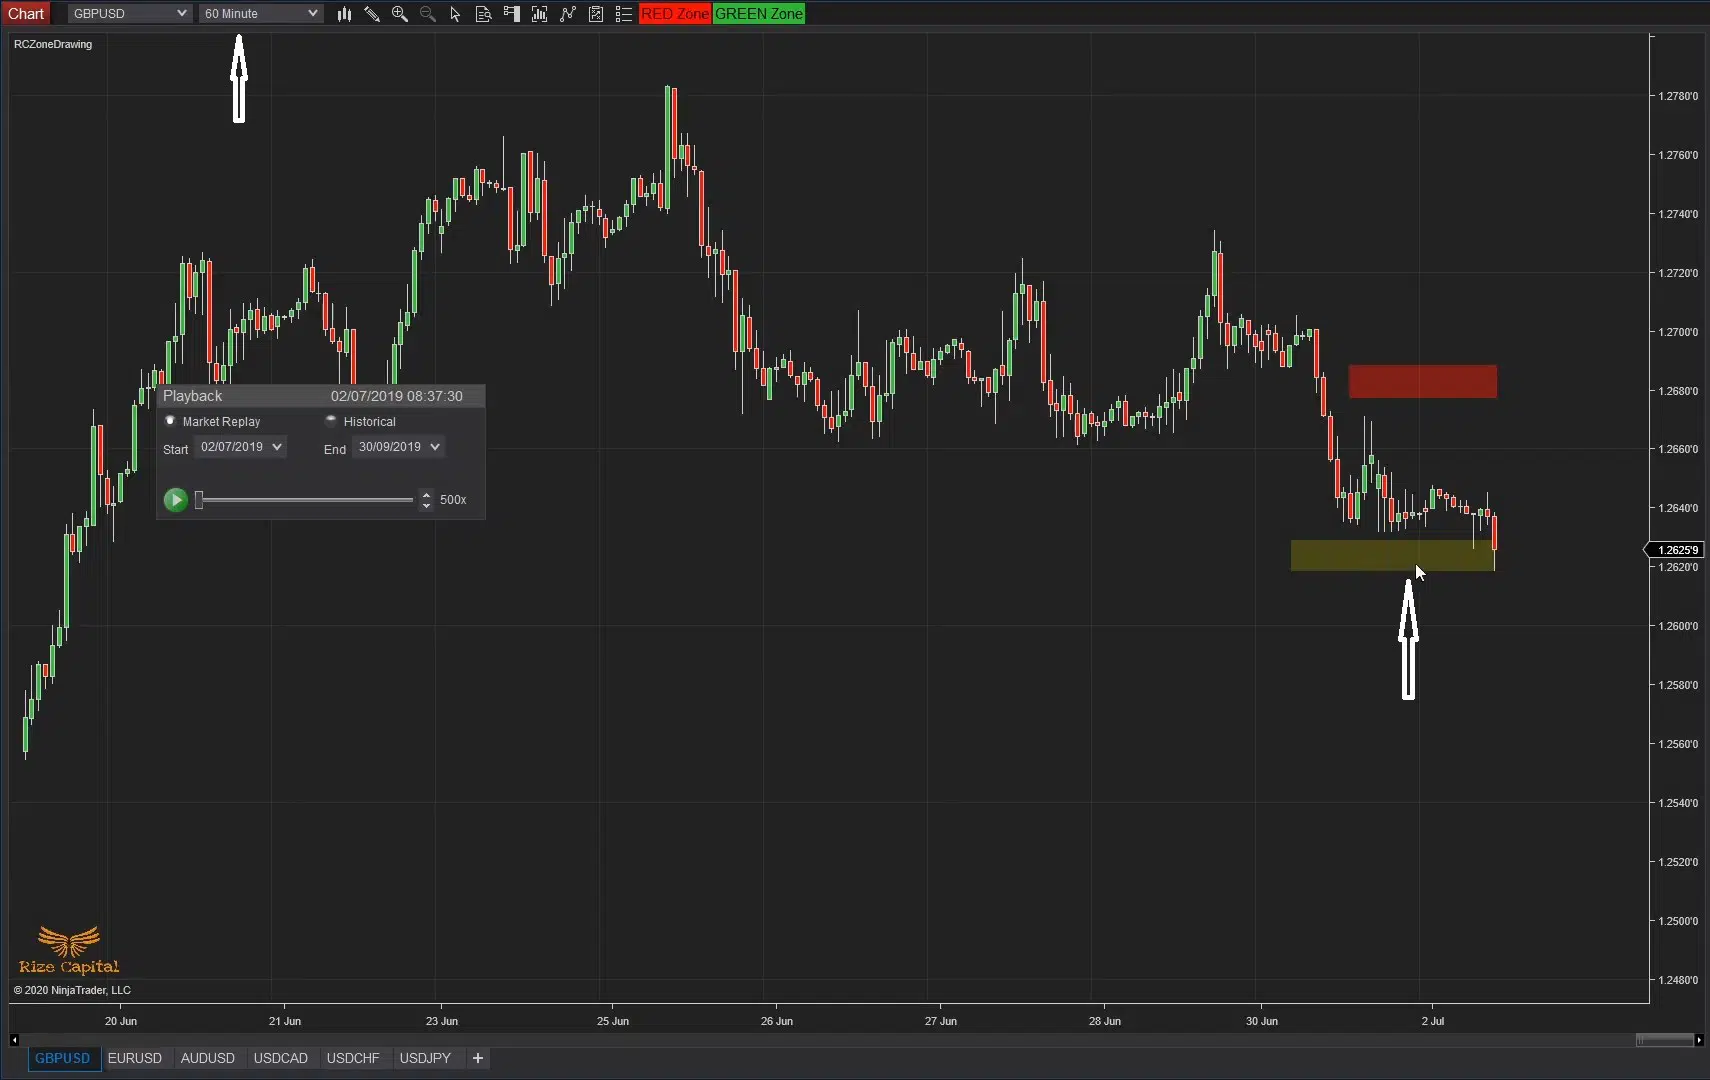
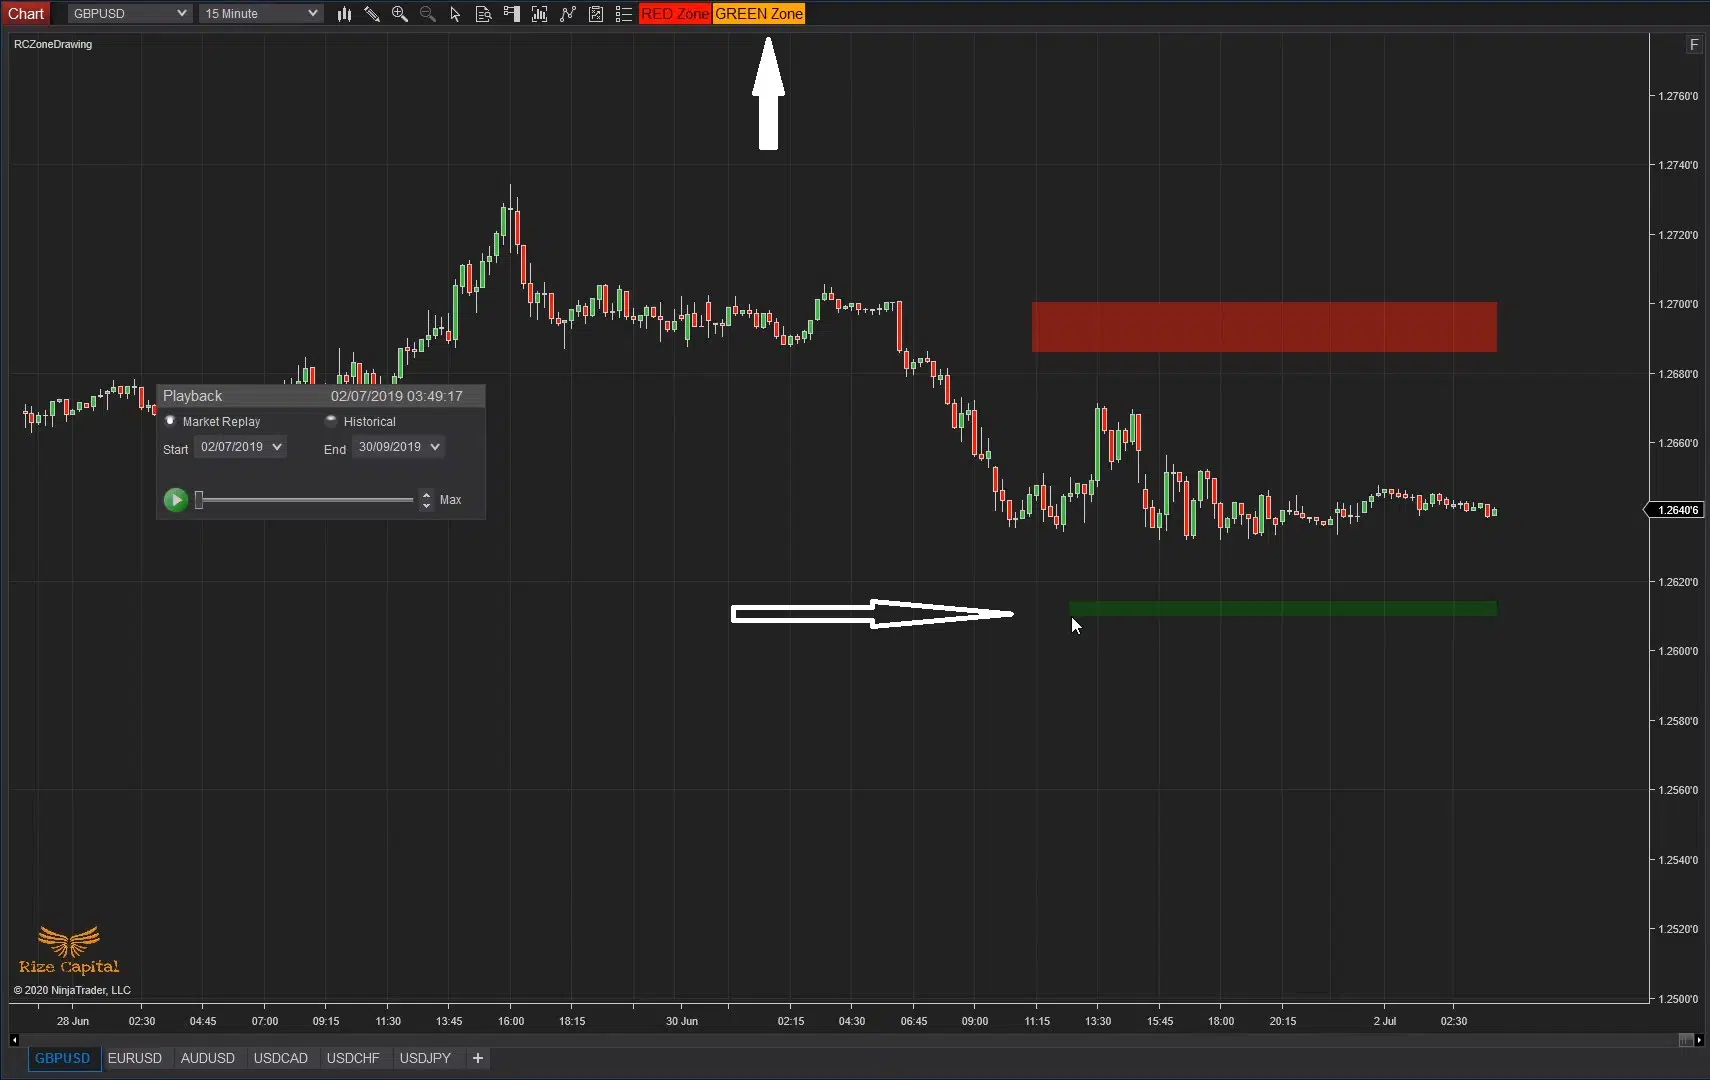
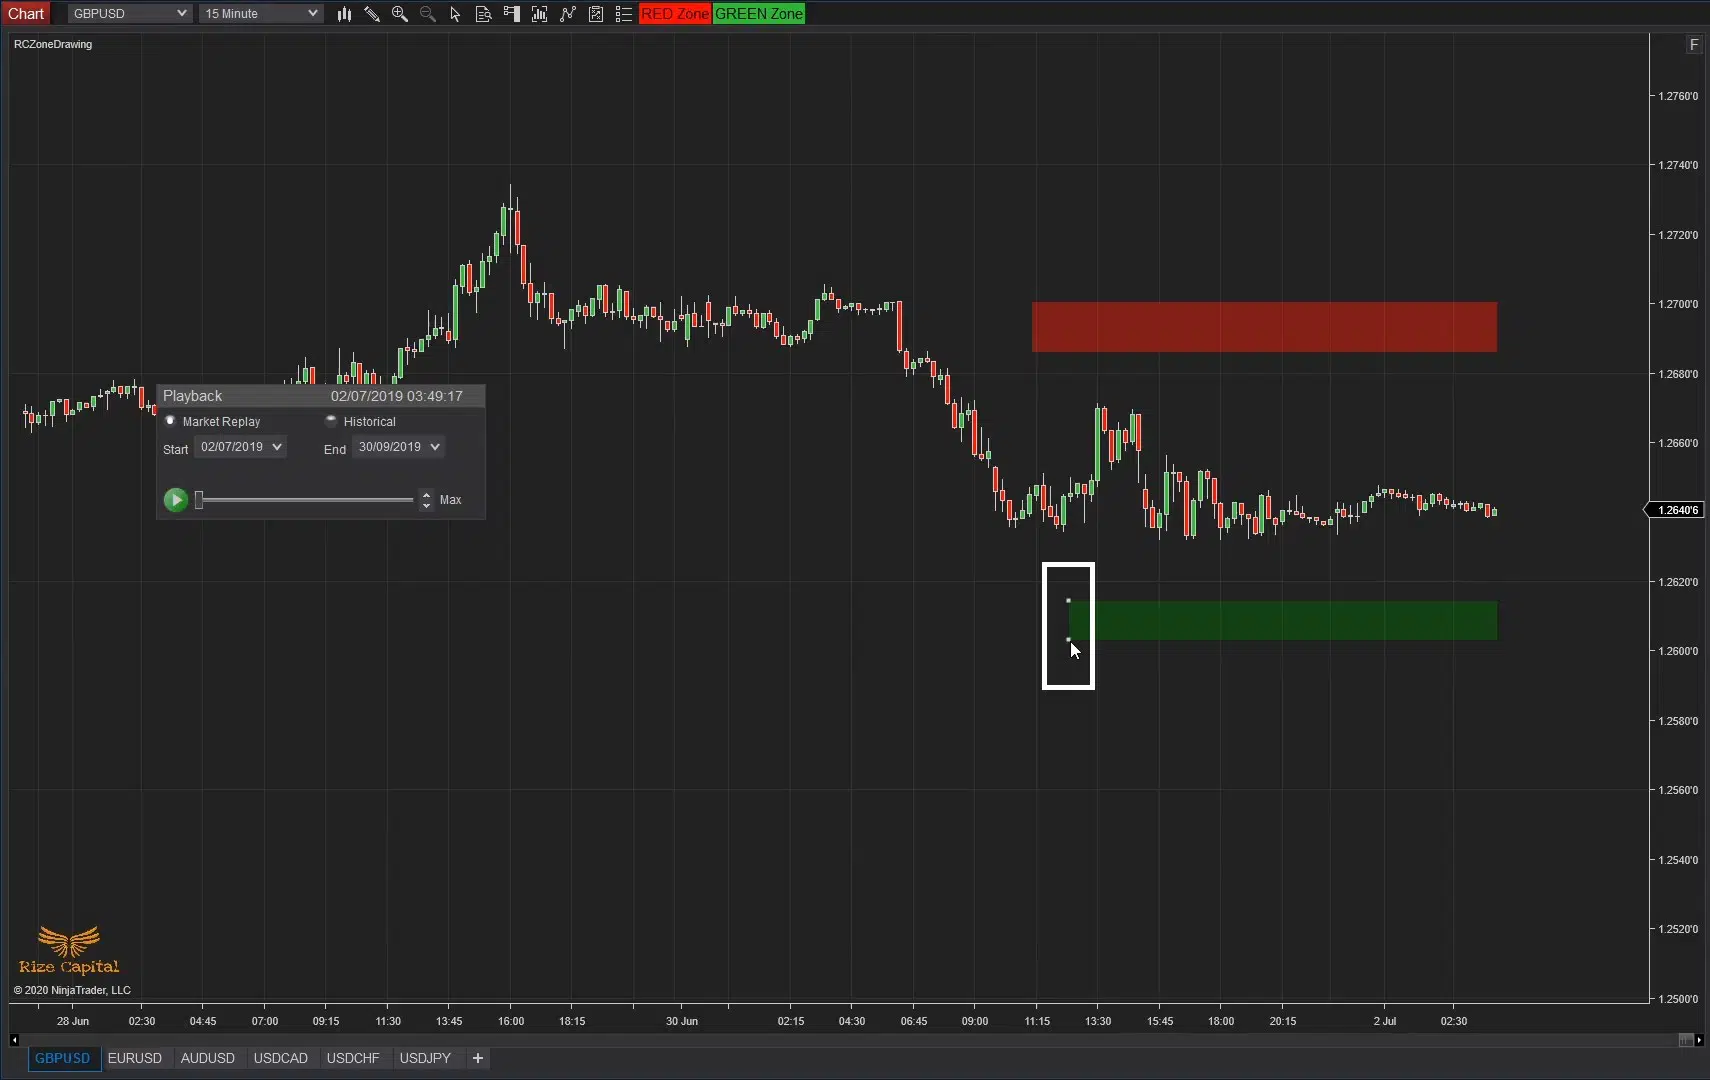
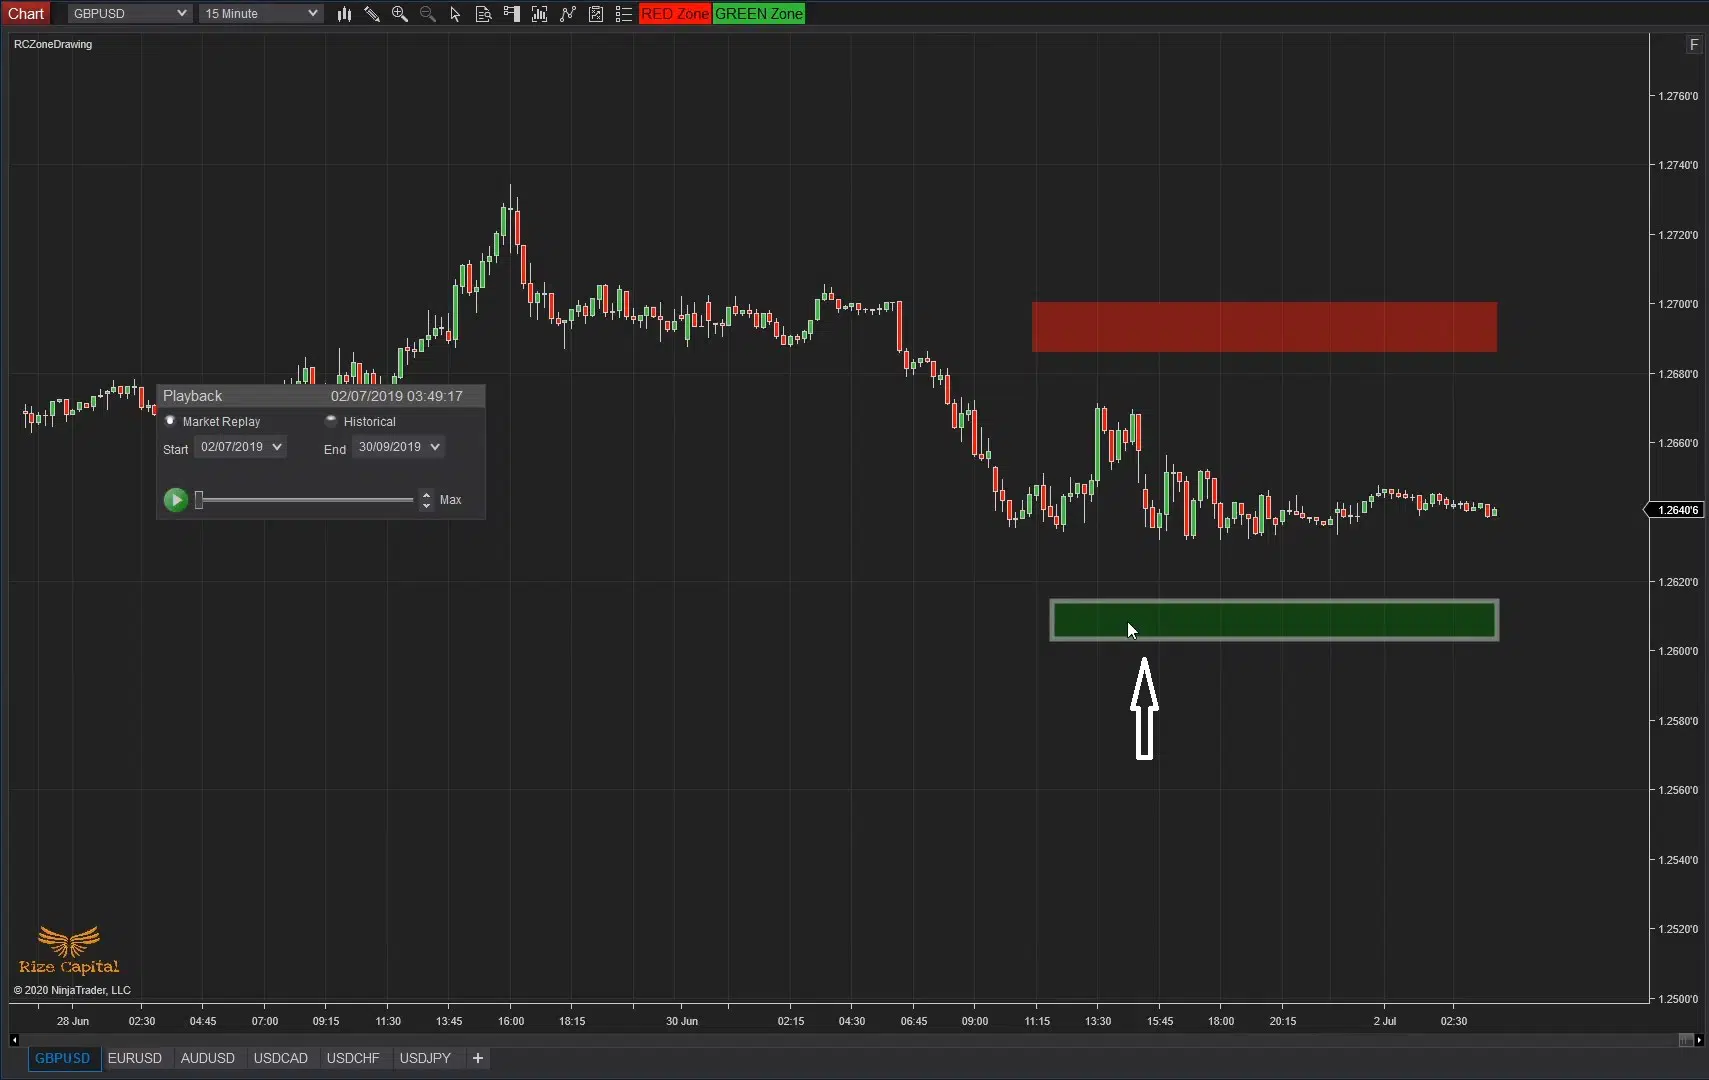
In Image -2, you can see you can draw Green and Red zones. But you need to remember to draw Green Zones below the current market price and Red zones above the current market price. You can draw multiple zones at the same chart as shown in Image -3. Zones drawn on Higher TF charts can be seen with dotted border line around it when you are on lower TF chart which is marked with white arrows in Image -4. Your current TF zones will be solid color by default without any border. Higher TF zones are visible on lower TF charts, but lower TF Zones are not visible on higher TF. When current market price only touches any zone for the first time, regardless Green or Red, it changes its color (marked with left white arrow in Image – 5) to highlight that this zone is already touched or used. But it does not change color again, if it touches the same zone next time.
Image - 6 (Click to ZOOM)
Image - 7 (Click to ZOOM)
Image - 8 (Click to ZOOM)
Image - 9 (Click to ZOOM)
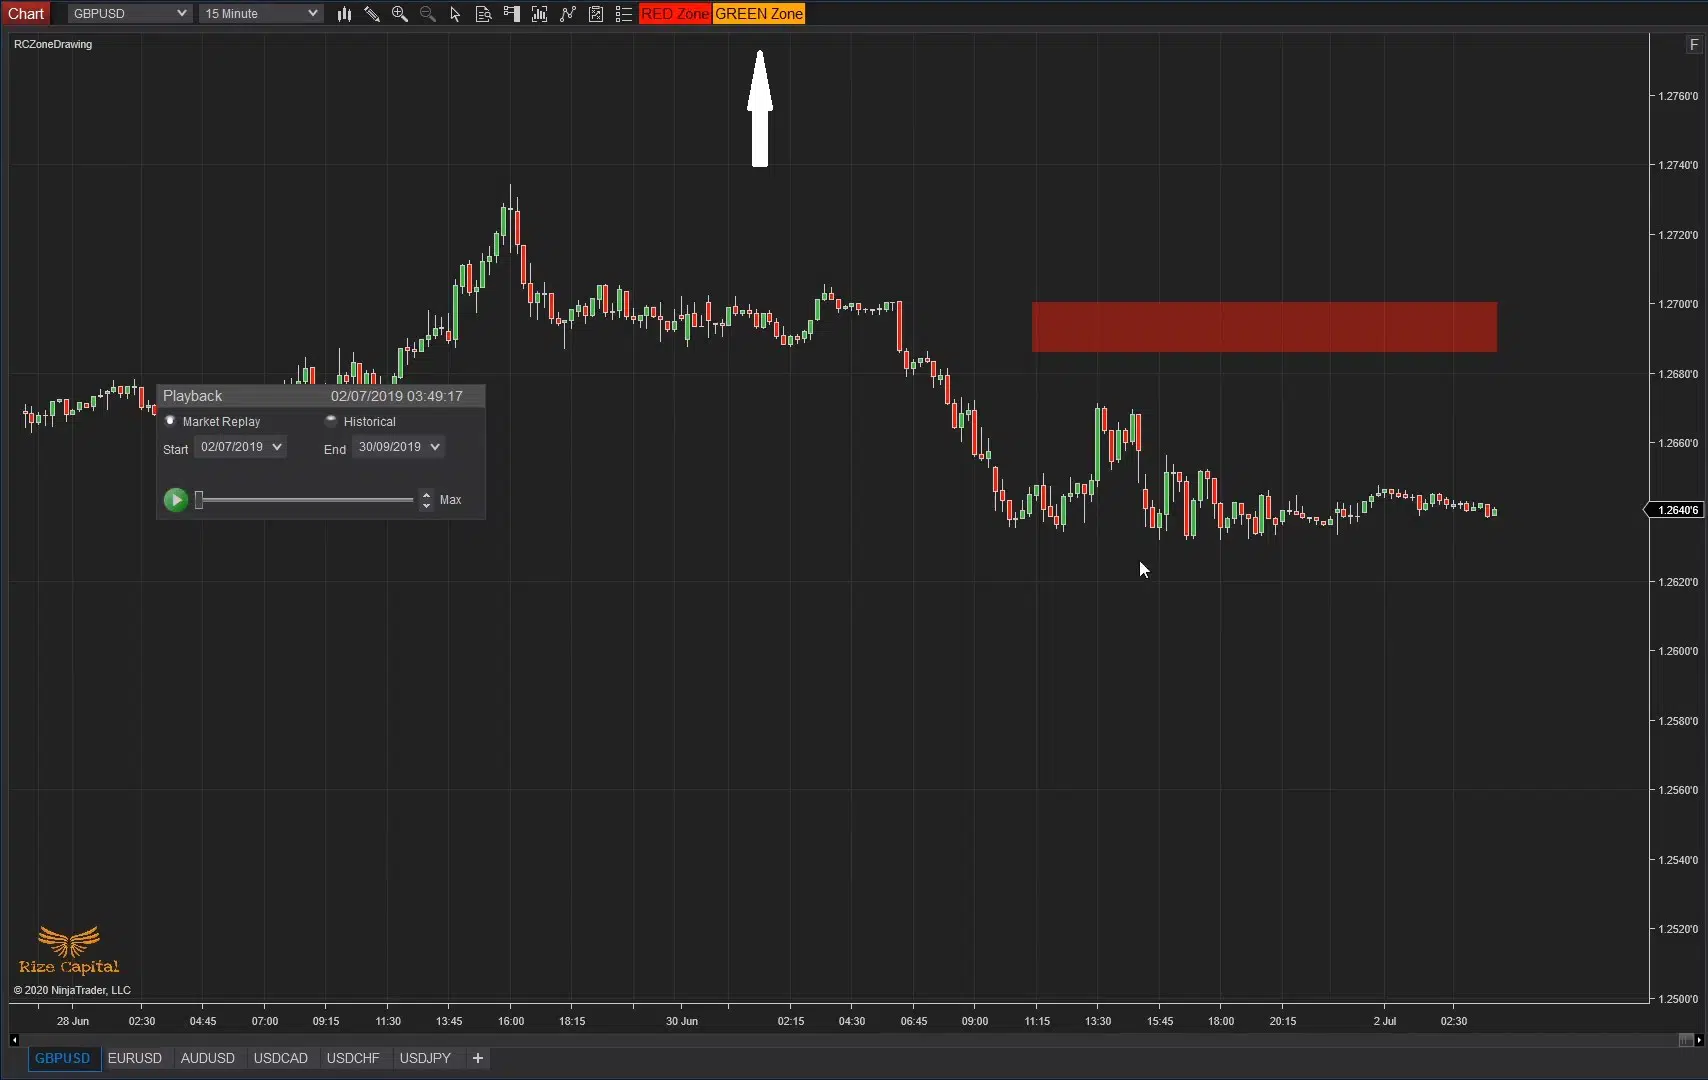
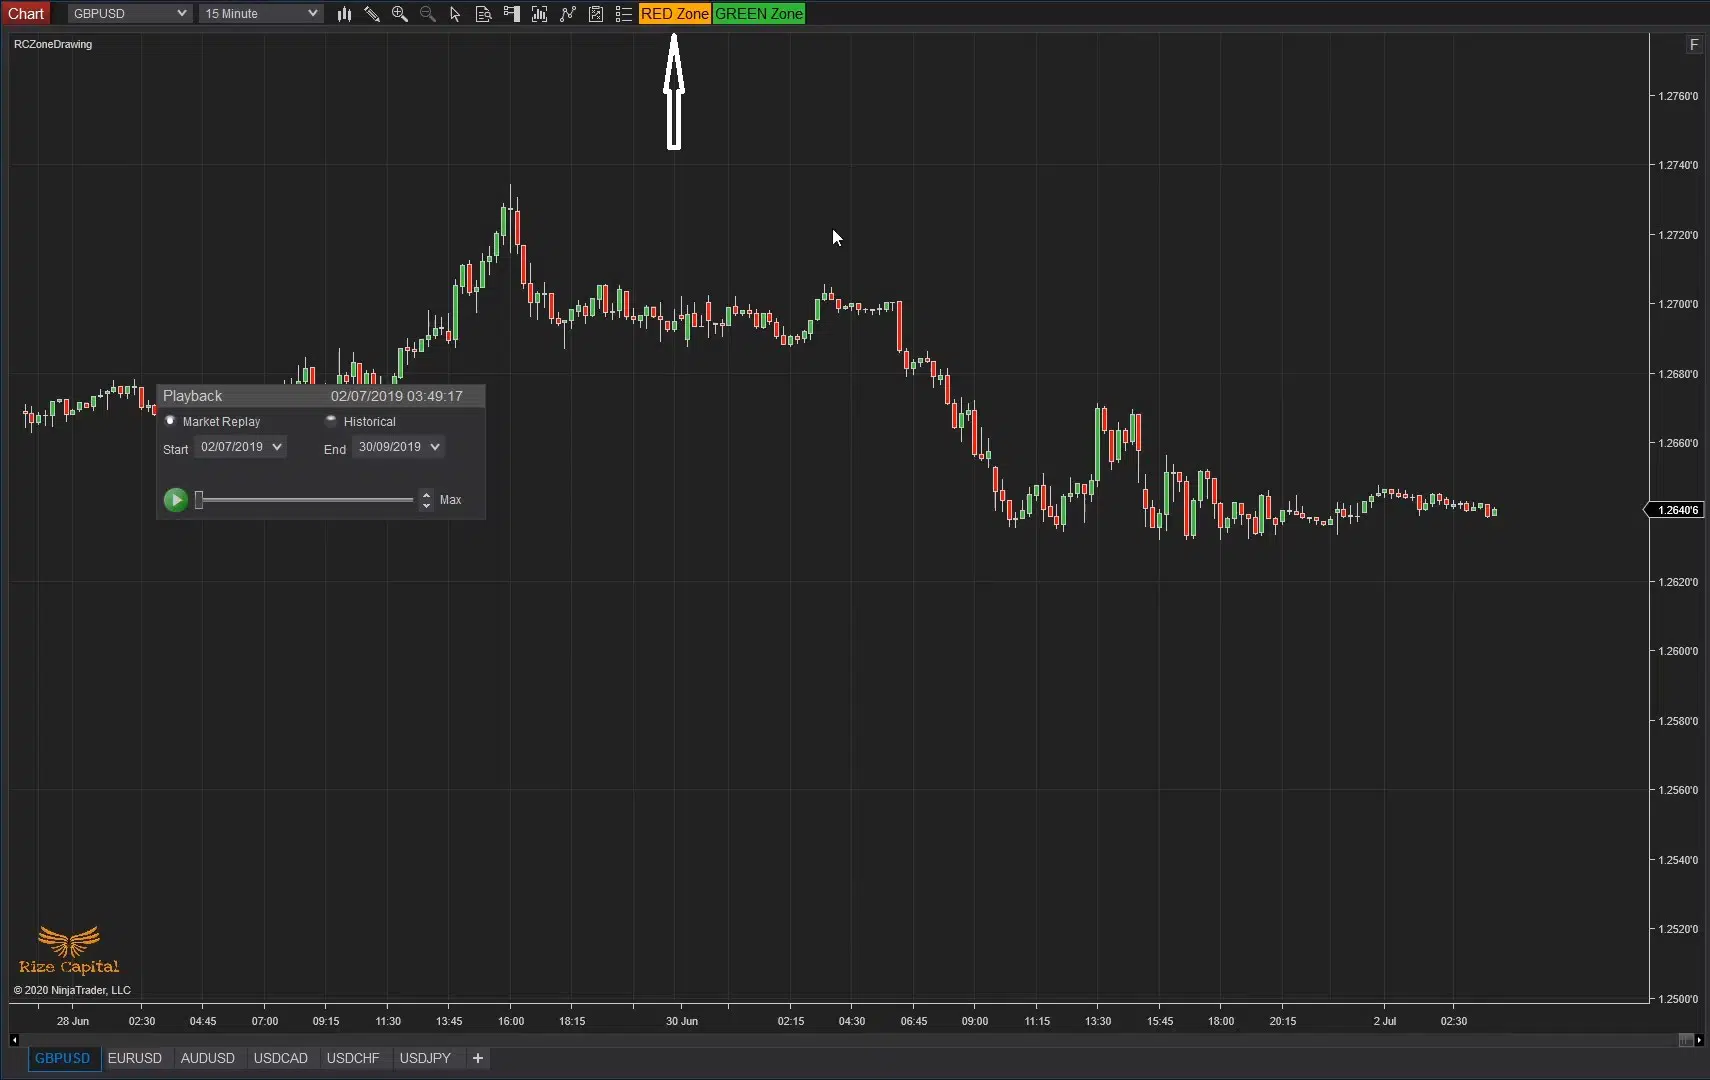
To draw Green zone, you need to left click on the “Green Zone” button once, which is marked with up white arrow in Image 8 and it will change the color of the button. Then you need to left click once anywhere on the chart where you want to draw your Green Zone like Image – 9 and release the click. Then you can move the mouse cursor to draw your zone as per your zone size requirements and then left click once again, which will stop drawing the zone for you.
Image - 10 (Click to ZOOM)
Image - 11 (Click to ZOOM)
Image - 12 (Click to ZOOM)
Image - 13 (Click to ZOOM)
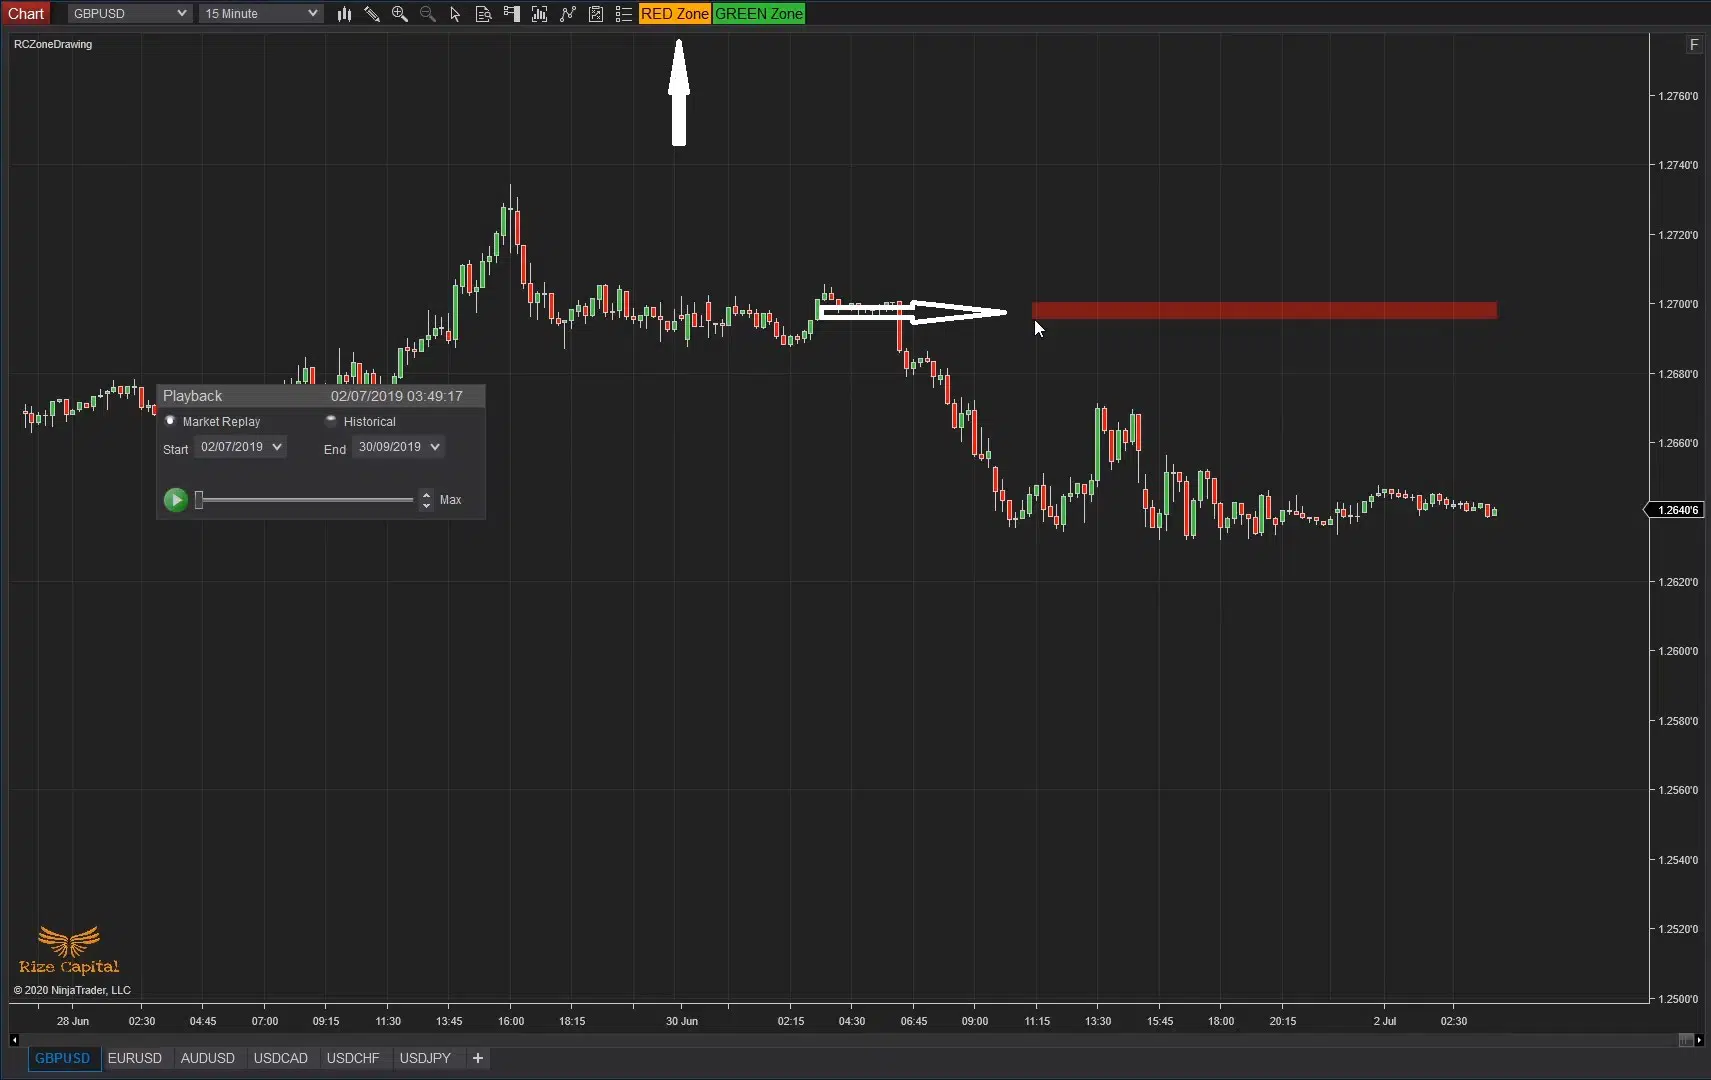
Like Green Zone, if you want to draw a Red zone, you need to click the “Red Zone” button at the top of chart window once (Up white arrow in Image – 10) and then left click once where you want your Red Zone to start from on the chart, like in Image -11. Then release the click and move the mouse cursor until you are happy with your red zone size and then left click once again to complete drawing your red zone on your chart. Now, if you want to resize your zone, you need to left click once at the left edge of any zone, like shown within white box in Image -12, which will bring up two dots at the top and bottom left edge of the zone. You can left click once on the dot and release the click; then move it as per your requirement and then left click once more, when you want to complete resizing. If you just want to move the zone without resizing it, then you need to left click once on the zone which will highlight the border like in Image -13 and then you can left click once more and release the click. Then you can move it anywhere suitable for you and left click once more to complete the move.
Image - 14 (Click to ZOOM)
Image - 15 (Click to ZOOM)
Image - 16 (Click to ZOOM)
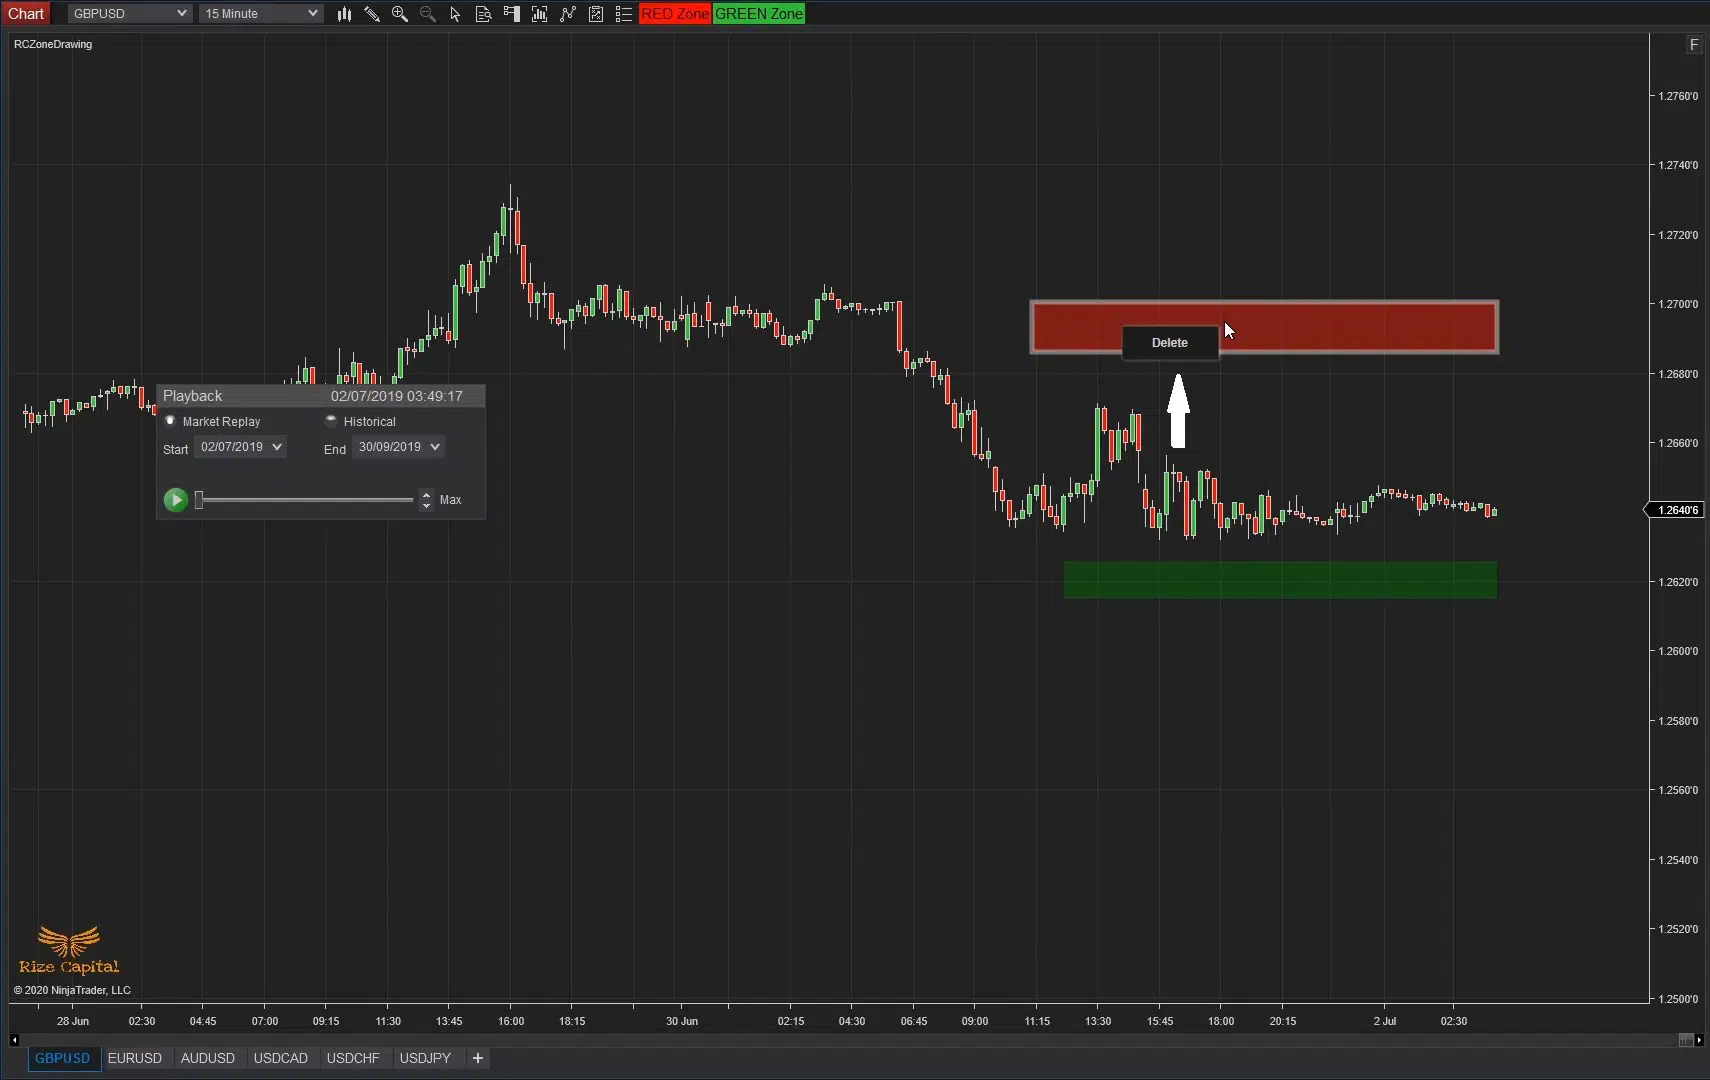
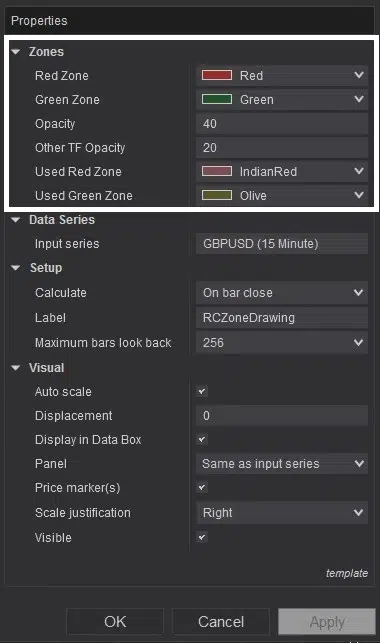
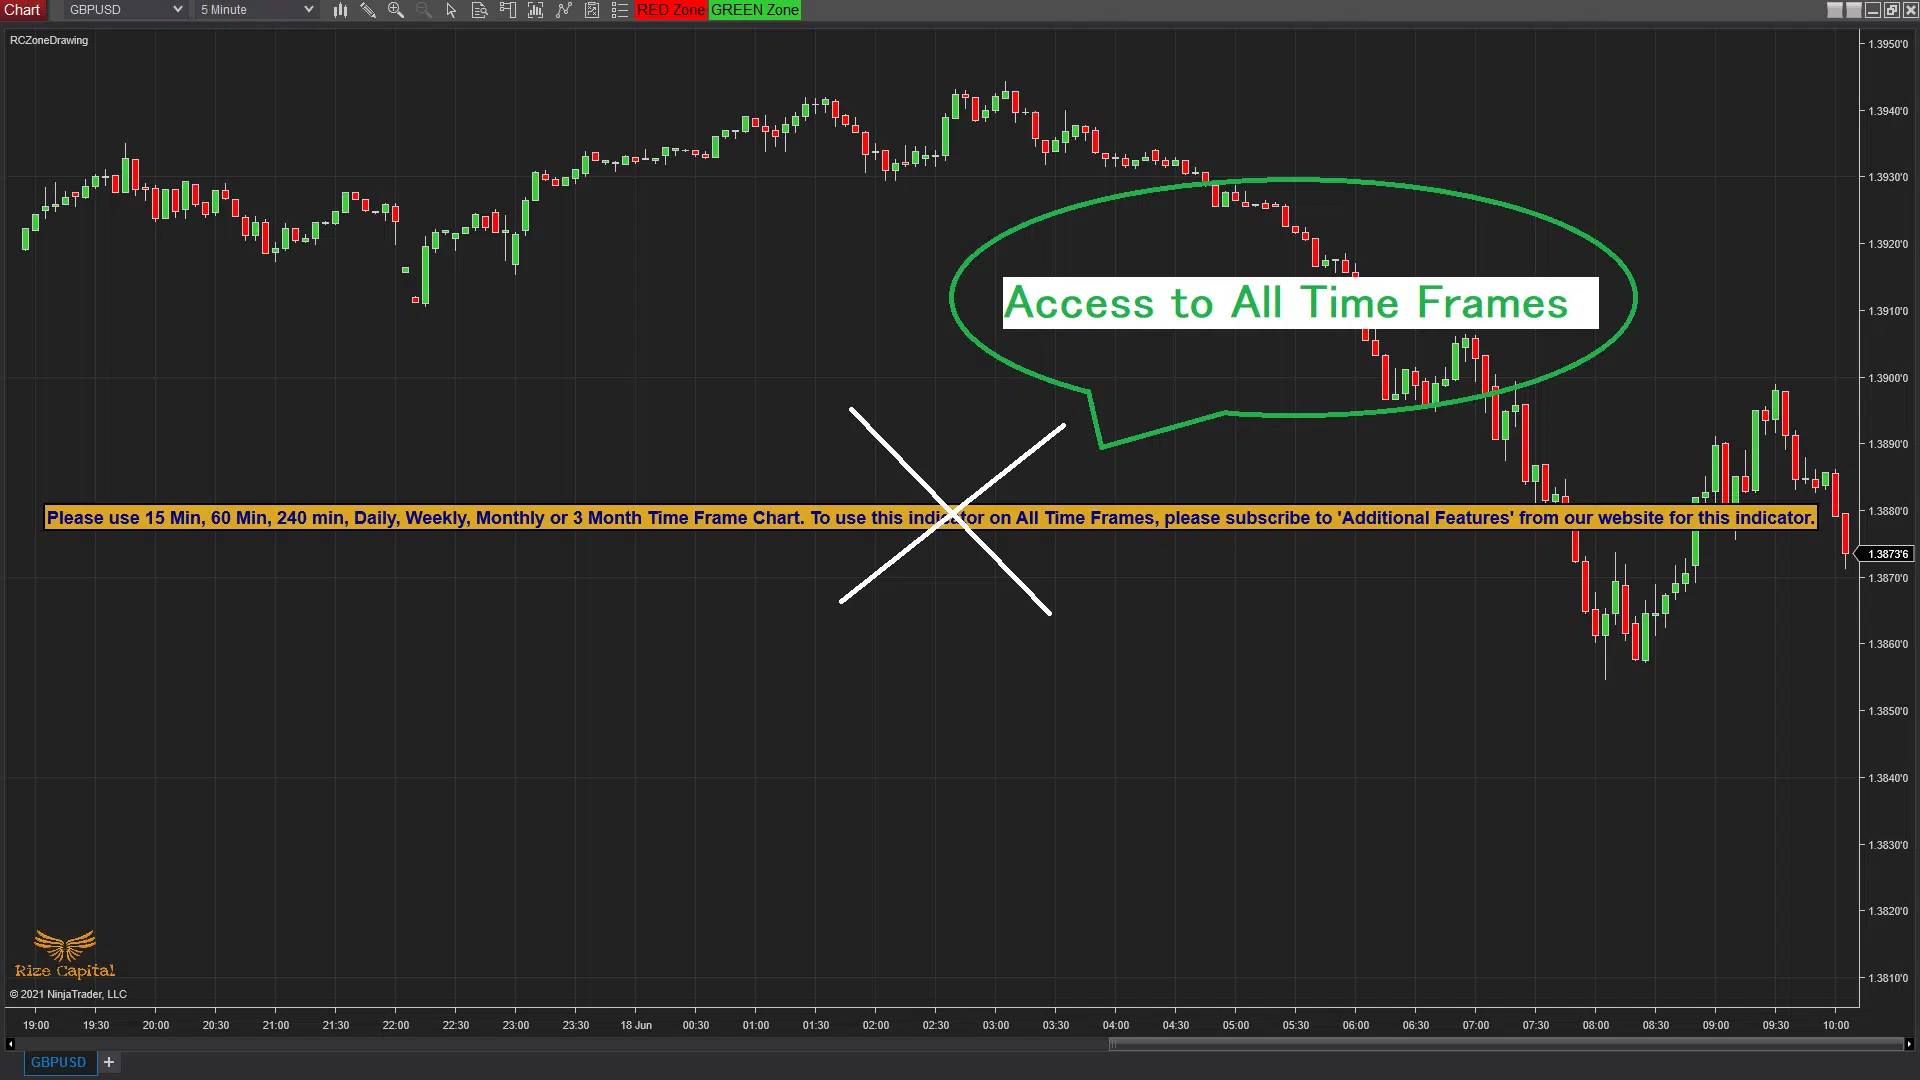
If you want to delete any zone, then you need to right click once on top of the zone and it will bring “Delete” option (shown with up white arrow in Image – 14). Then left click once on “Delete” which will delete the zone from your chart. This Free version indicator works on only 15 min, 60 min, 240 min, daily, weekly, monthly and quarterly charts, unless you are subscribed to ‘Additional Features’. You will see a text reminder on your chart like Image -15 to adjust your chart time frame. To subscribe to ‘Additional Features’ see below for details. Finally, if you want to customize Red, Green Zones, opacity, used zones colors – then you can change them from the Zone settings in the indicator’s properties section which is highlighted with white rectangle in Image – 16.
Additional Feature (For paid subscription):
Image - 8 (Click to ZOOM)
To remove restriction on use of this indicator to limited number of time frames, you just need to subscribe to ‘Additional Features’ from ‘Additional Feature Subscription’ section. After you subscribe to this, send an email to support@rizecap.com with your machine id and Indicator name. Please mention, ‘Additional Feature subscription details for Zone Drawing Indicator’ – in the subject of the email. To subscribe this ‘Additional Features’, please click here.
Upgrade Notes:
Version: 5.3.0.1
Additional Features option added to remove time frame restrictions for paid users
Separate versions are released to be used on NinjaTrader 8.0.x.x and 8.1.x.x
Version: 5.2.0.1
Auto update and announcement added
Version: 5.1.0.1
Can be used any Instrument.
Plots Green and Red Zones to show different levels or zones