First month is always free to try. You PAY NOTHING for your trial period and it’s a no obligation trial period. There is no minimum term, if you don’t like it – you can cancel your subscription any time you want.
Trade Entry Strategy
This NinjaTrader 8.0.x.x and 8.1.x.x versions strategy is developed for the traders and investors who prefer to enter for both short and long term position with precision. This strategy has different options and features to help you with that. It will help you execute orders using multi time frame principle ie, if you have planned your trade on a time frame, but wanted to execute orders using lower time frame chart for better entry and better price. Not only that, this strategy has options to build a position and add to it. Unlike default NinjaTrader 8 showing only average filled price for the entire position, you can get every execution entry price lines plotted on a chart to know where actually your different orders were executed. Besides with this strategy, you can switch to DayTrader Short term trading mode, if you decided to do so; as professional traders’ prefer to day trade when there is market volatility. Why don’t you watch the video tutorial and try this strategy for FREE for 1st month and test it yourself.
Try FREE for 1st MONTH
after first month just £9 /month
Your subscription will be processed through Paypal
If you are already subscribed to this strategy and want to unsubscribe, Please click here
WATCH THE VIDEO TO KNOW MORE ABOUT
Trade Entry STRATEGY
1st month FREE TRIAL
Access to all future updates
24/7 update and technical support
Cancel subscription anytime
Strategy Details:
Image - 1 (Click to ZOOM)
Image - 2 (Click to ZOOM)
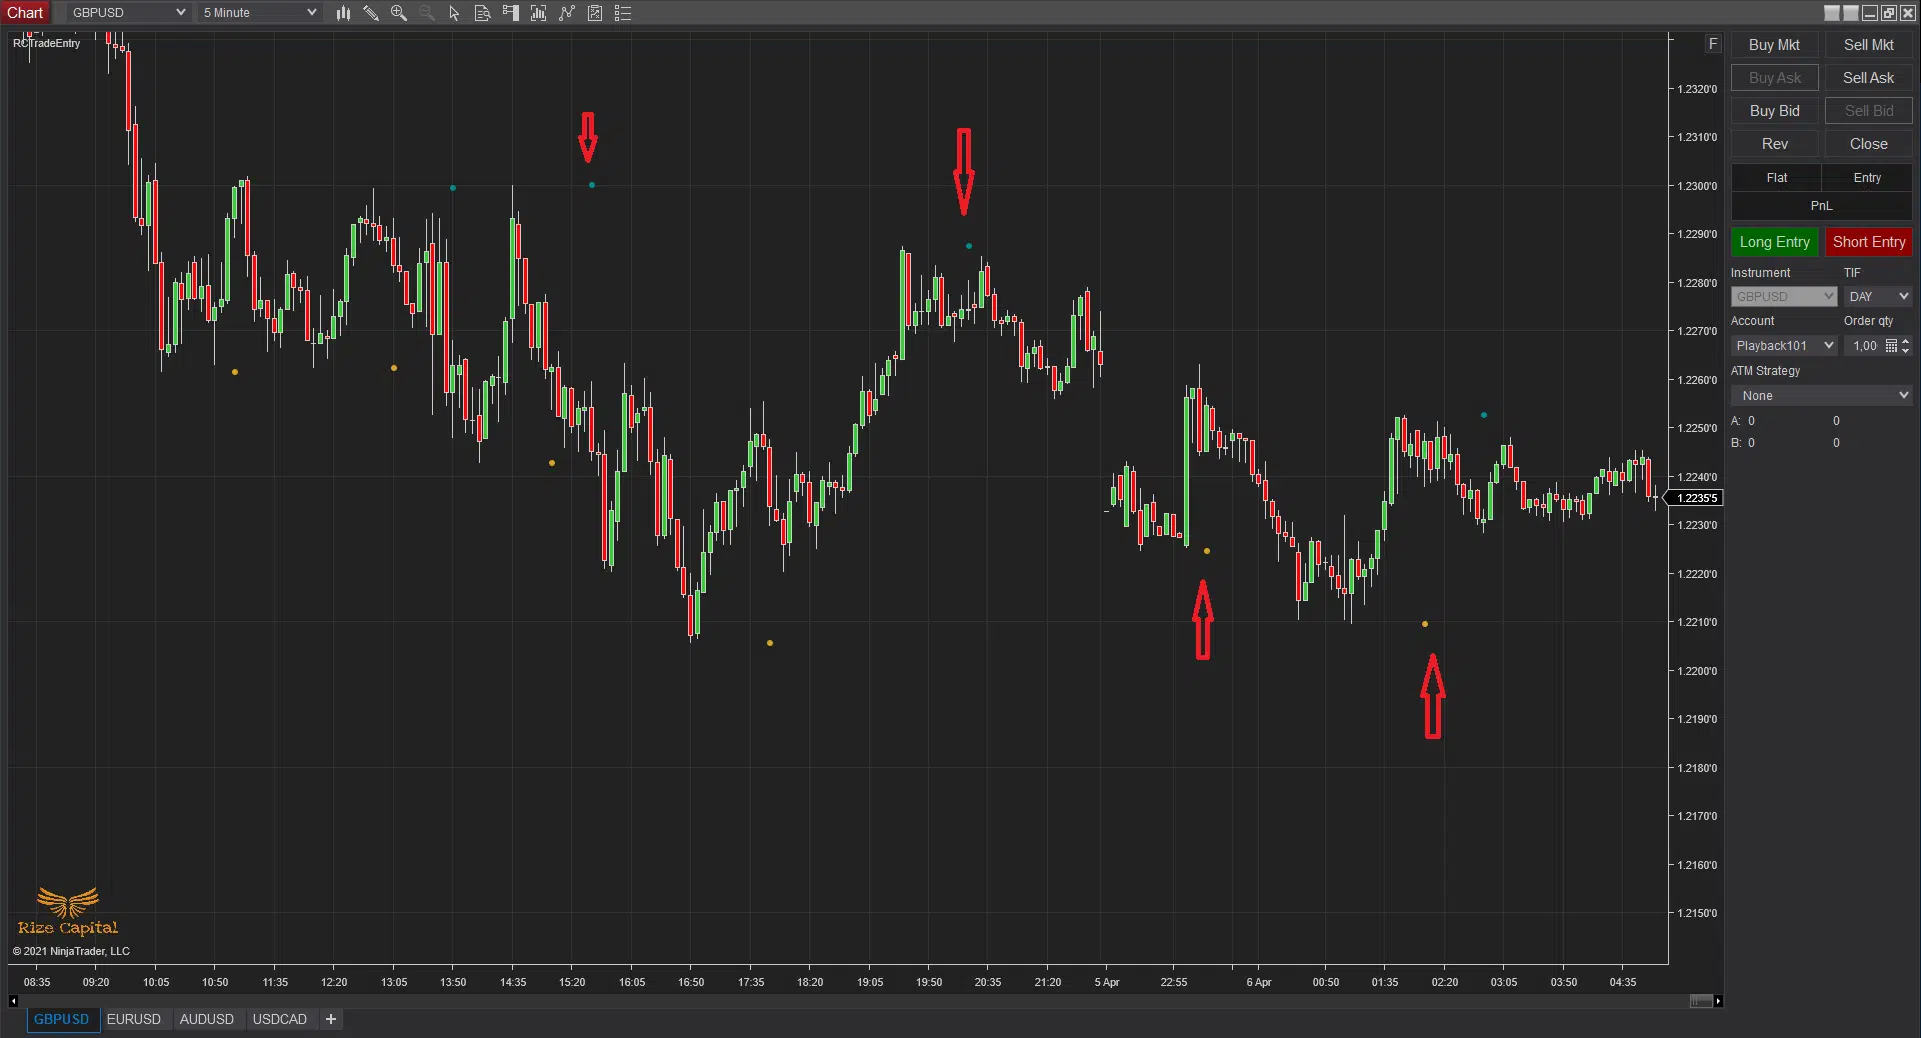
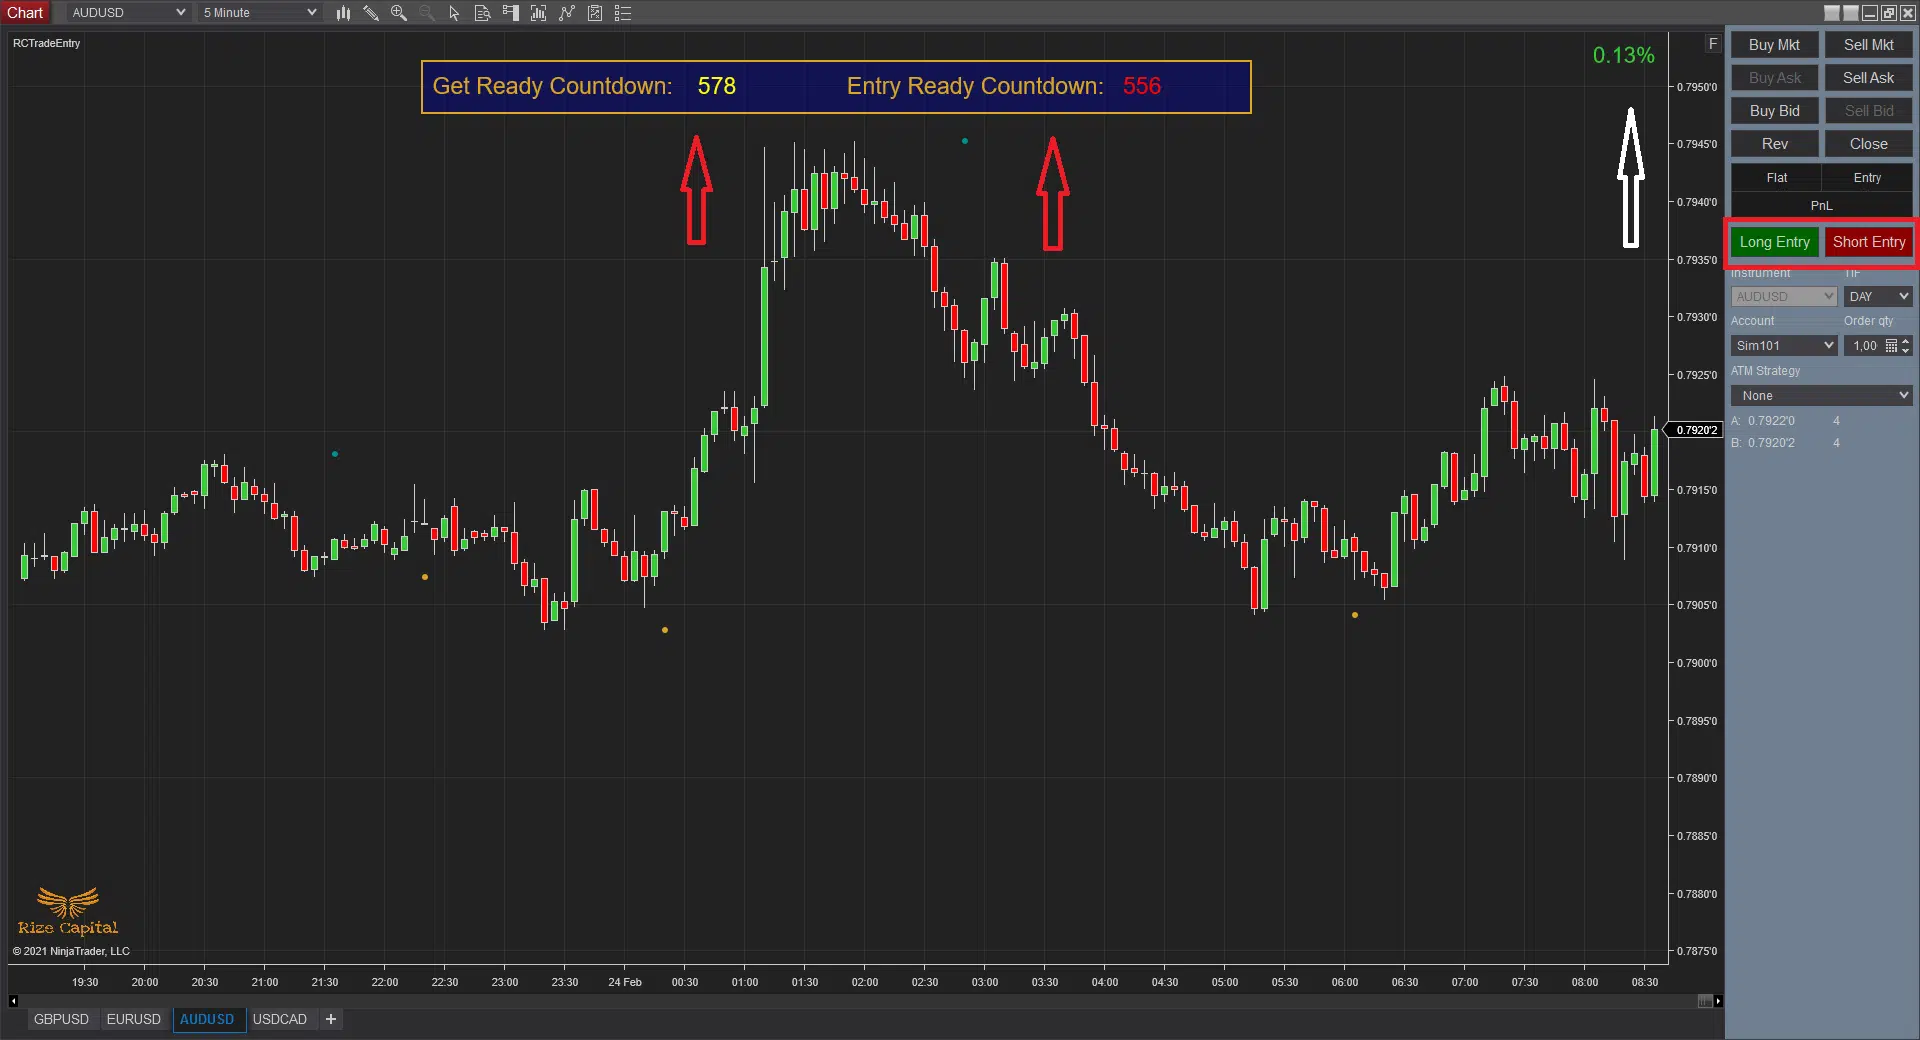
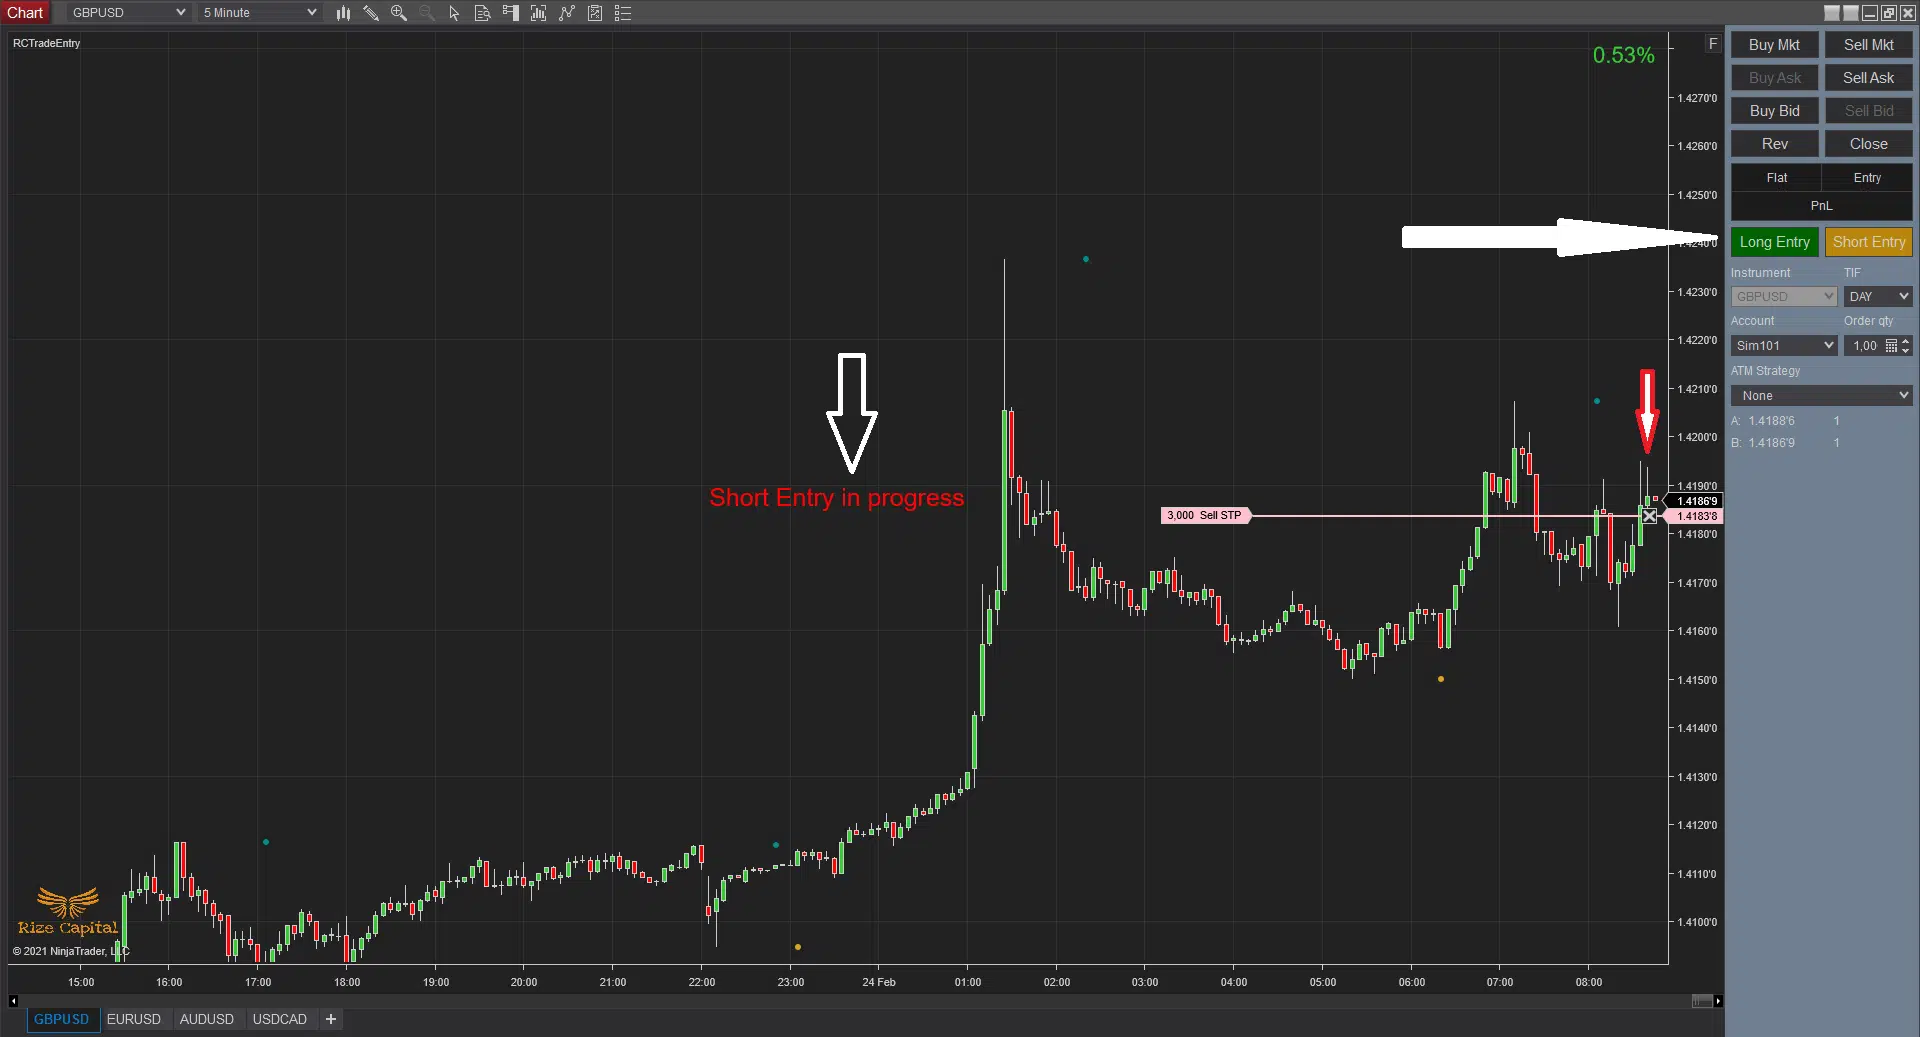
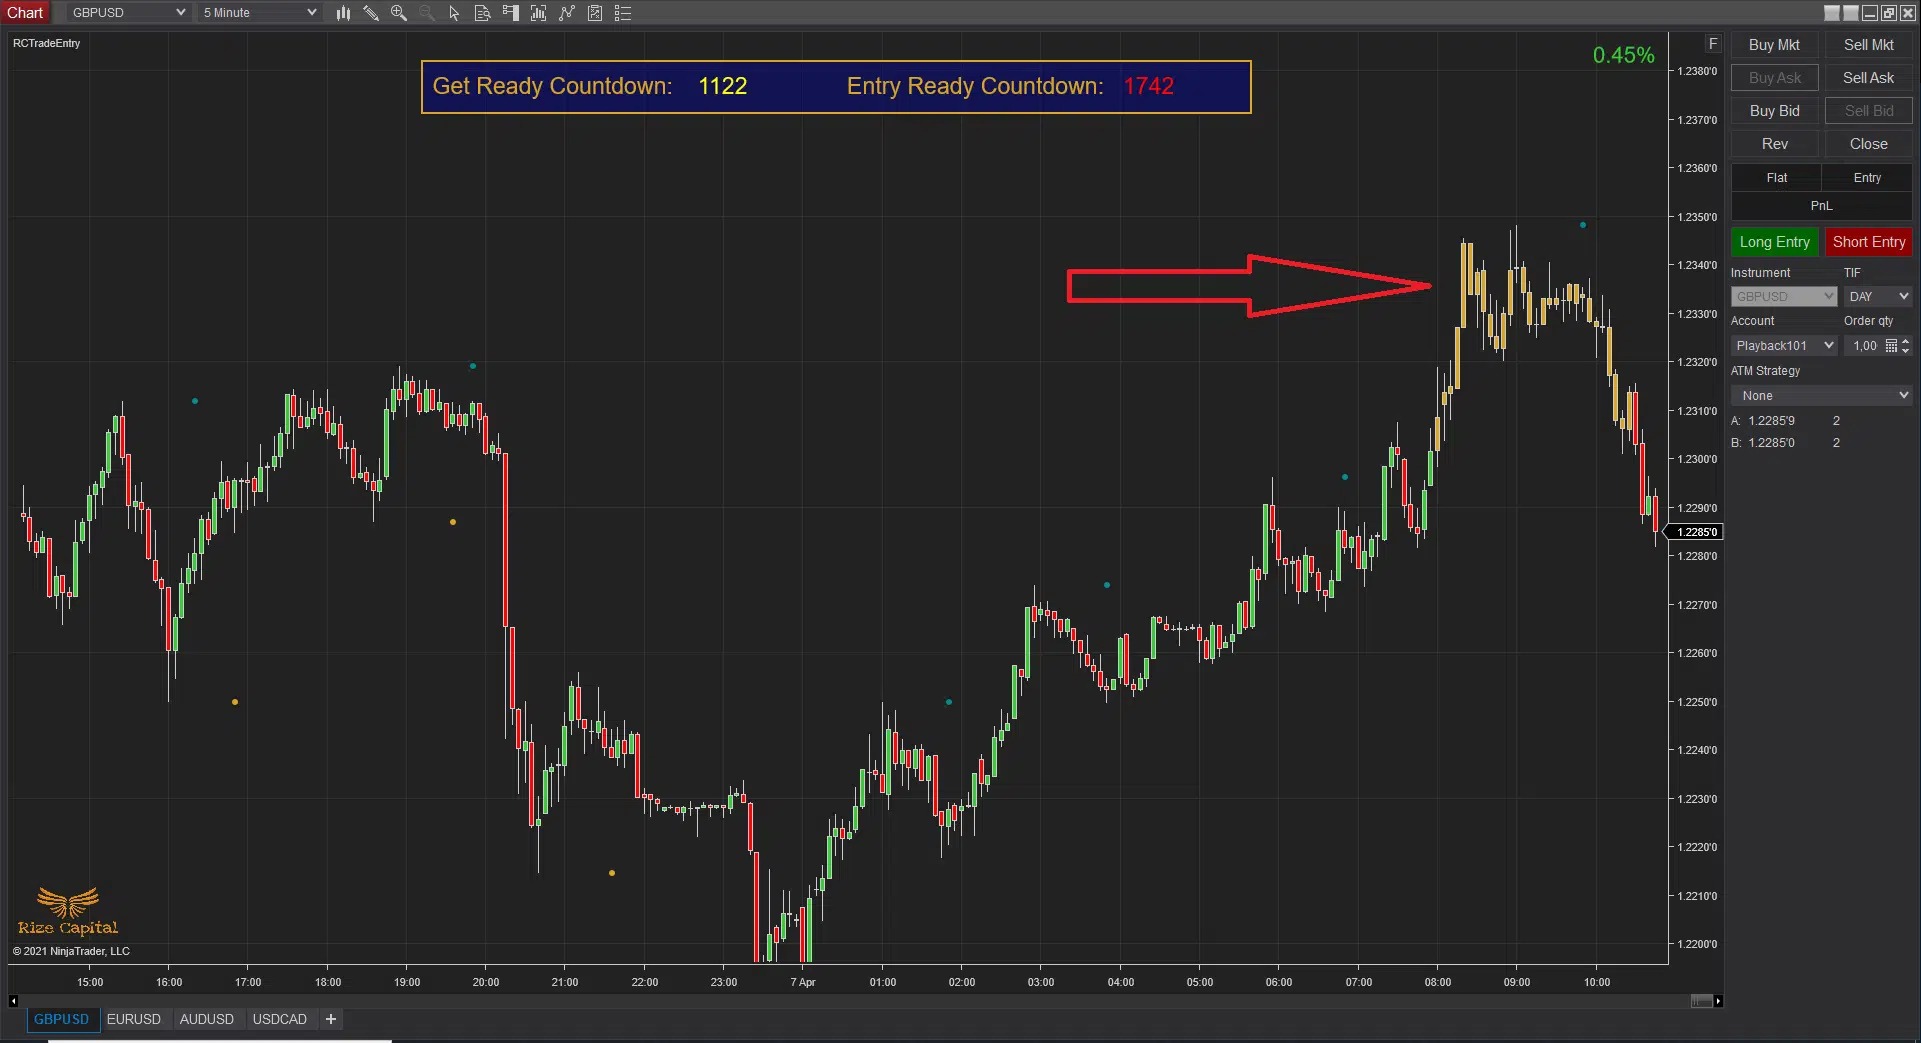
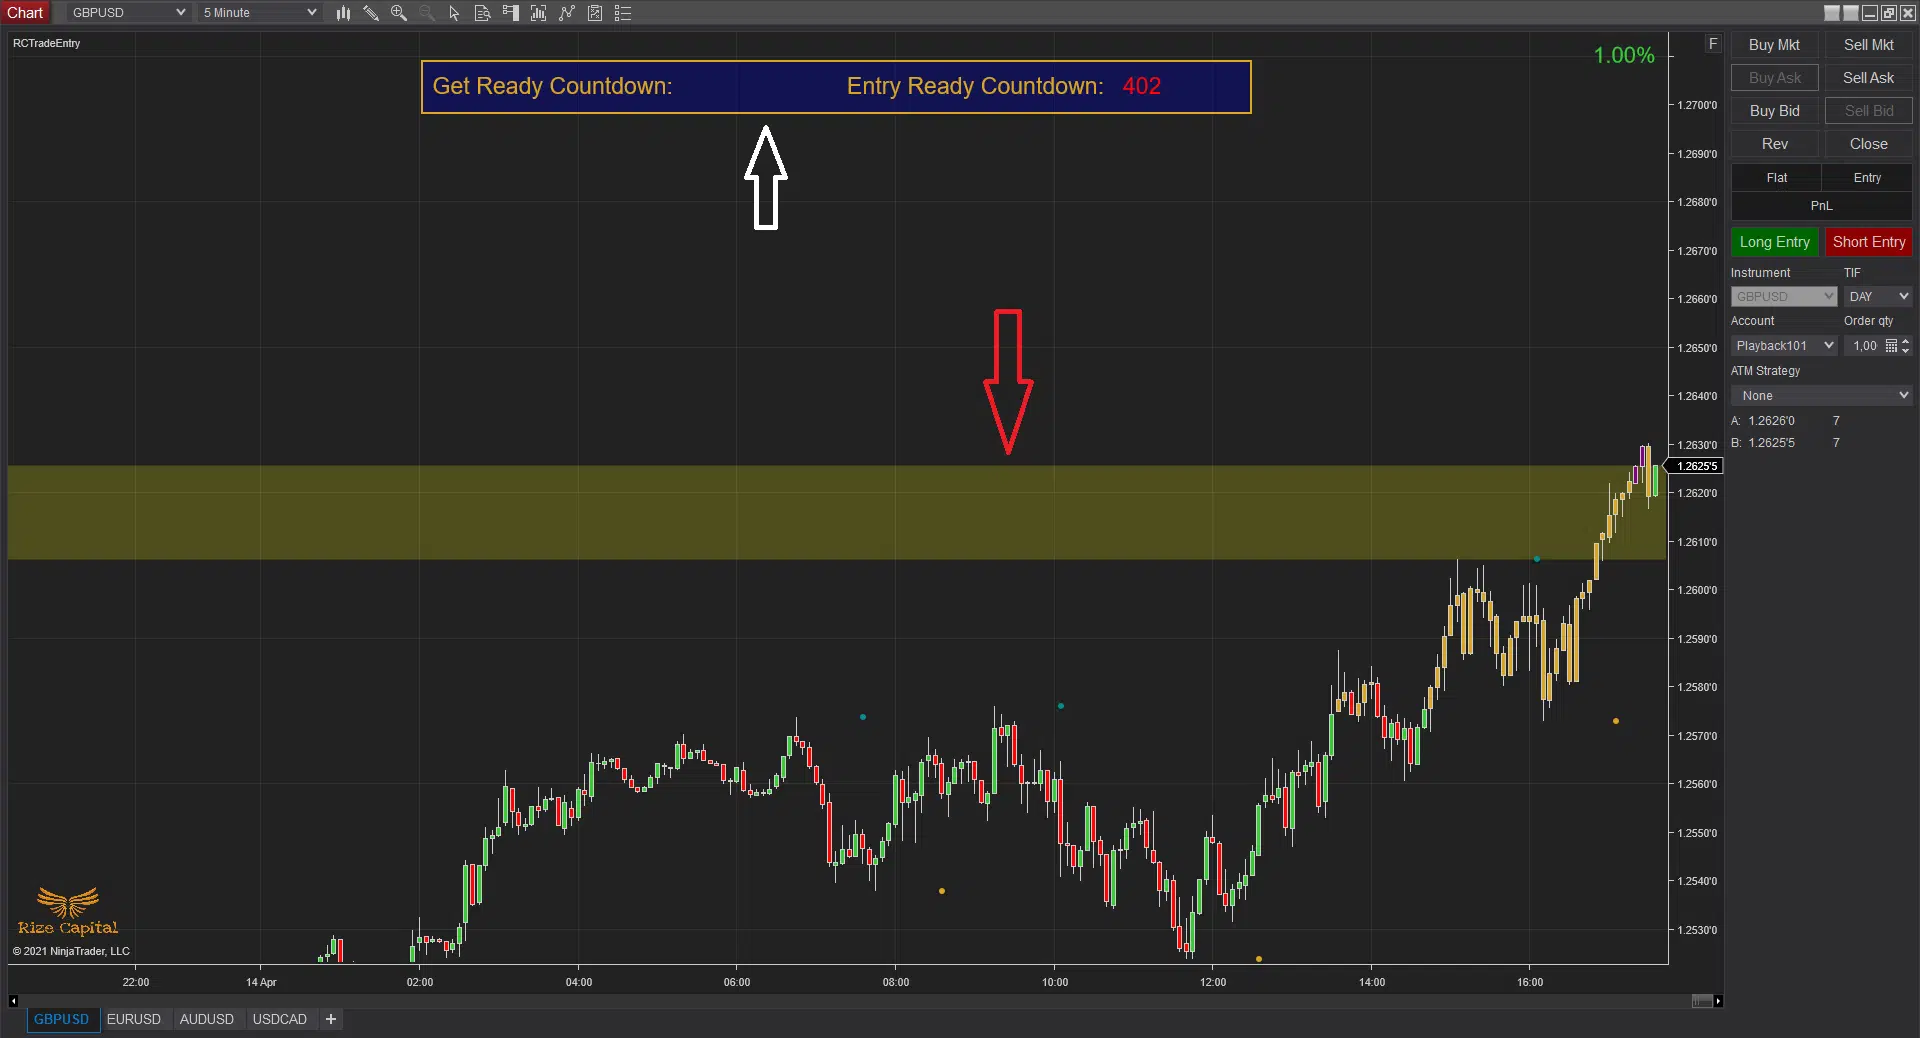
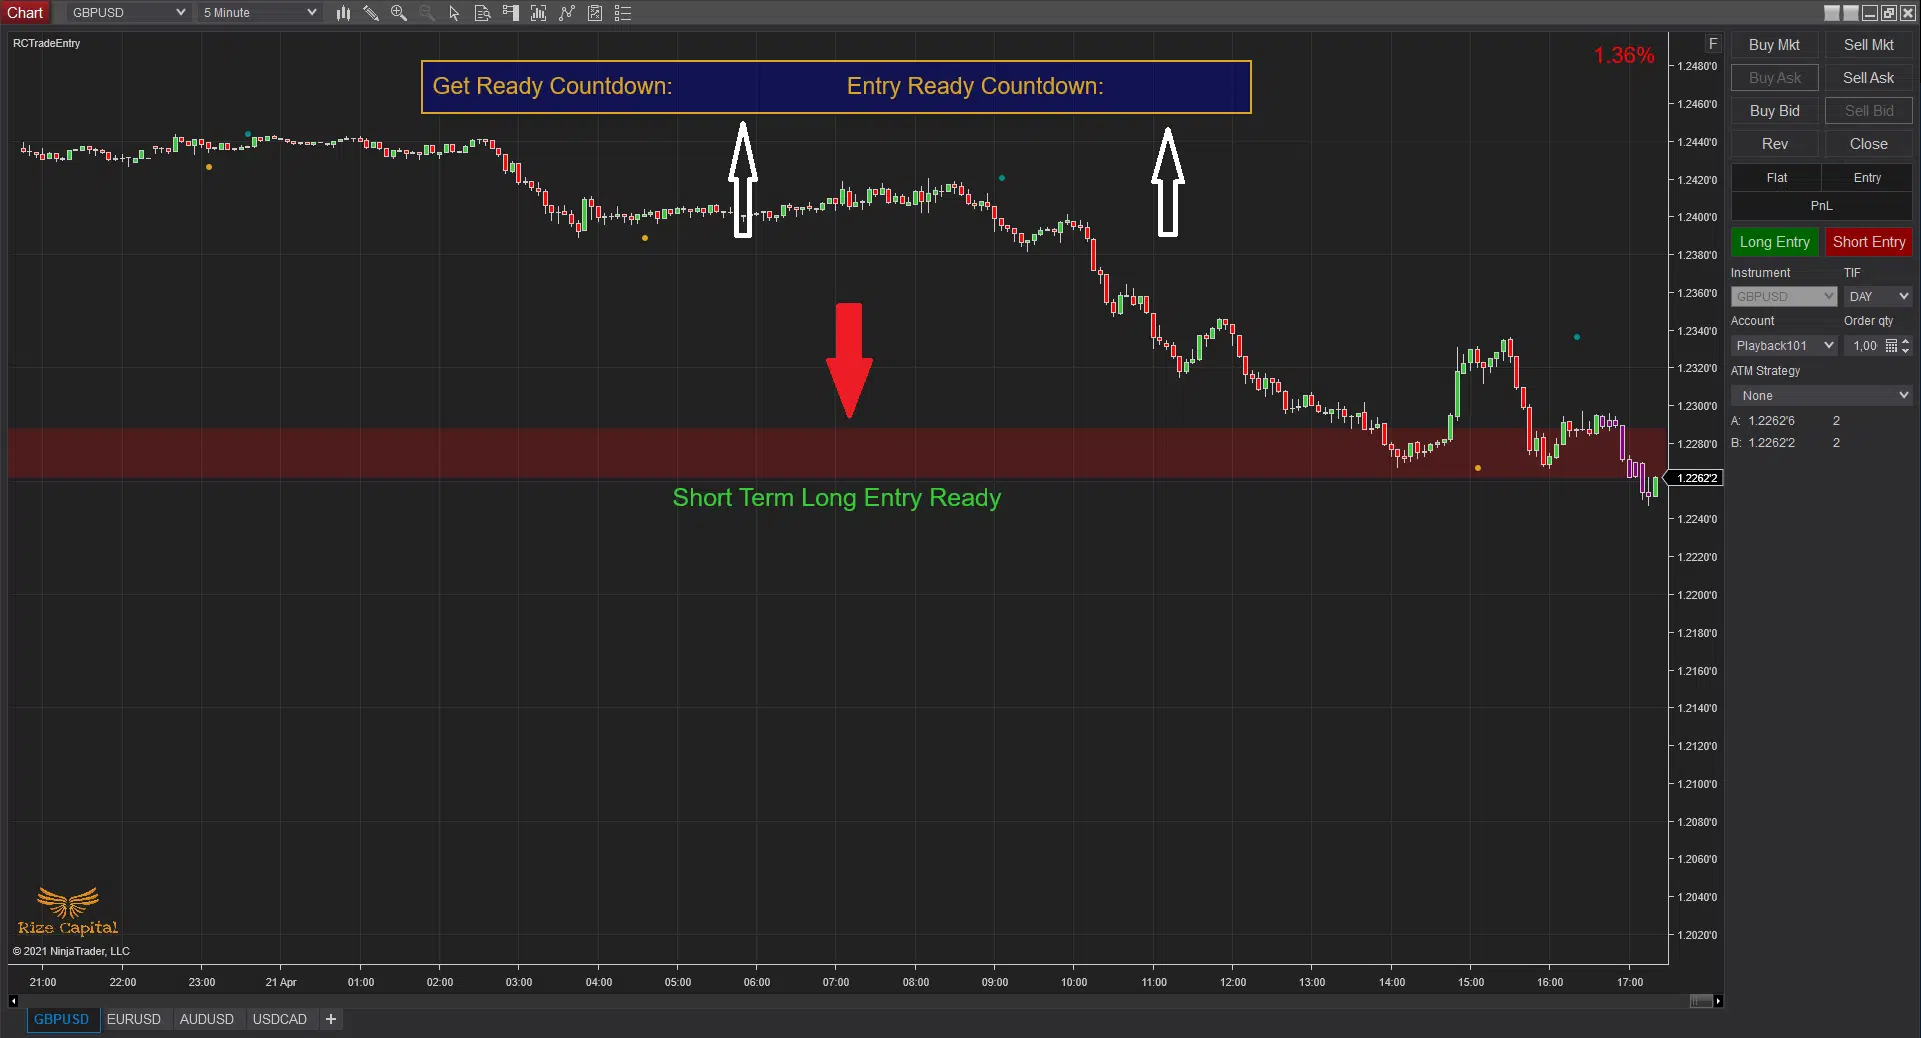
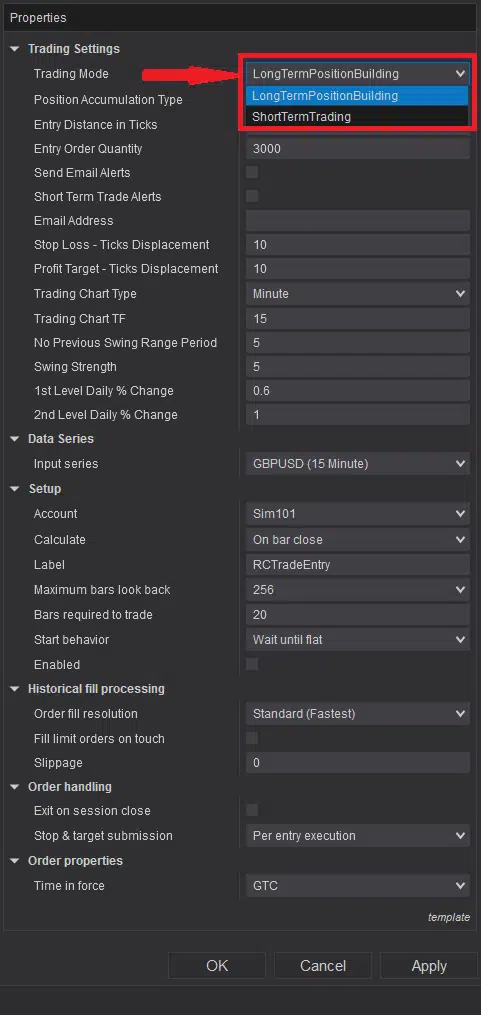
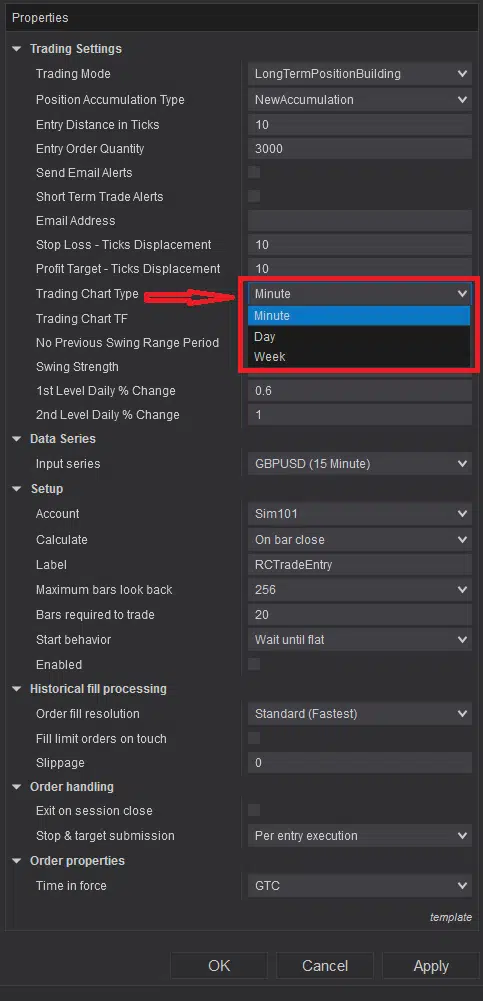
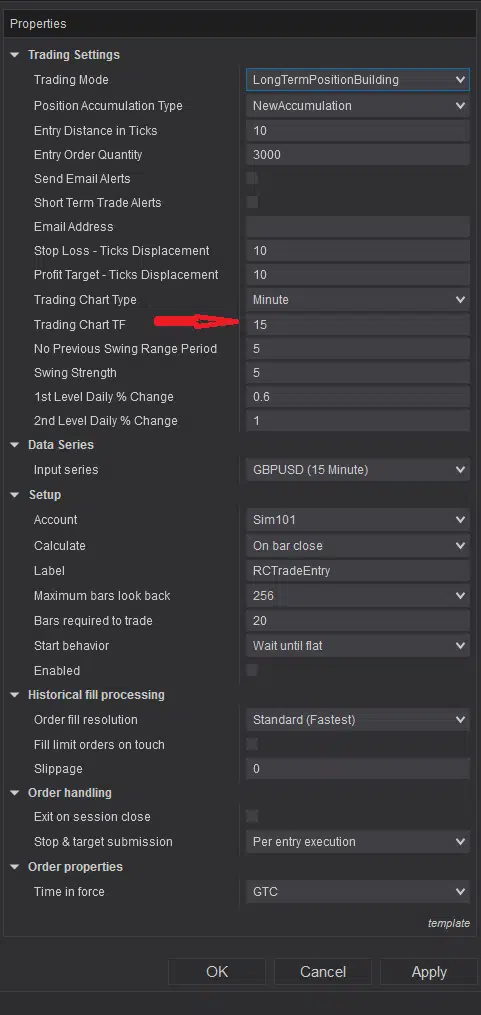
As soon as this Trade Entry strategy added to your chart, it will plot swing high and swing low dots on the chart Like both Image – 1 & 2. These dots are marked with red up and down arrows in Image – 1. But to remember, these swing high low dots are of the chart type and time frame selected in “Trading Chart Type” and “Trading Chart TF” in Image – 21 and Image – 22 below. Traditionally, if you are planning your trade on a specific chart time frame, this is what you select here, though you add the strategy to a lower time frame chart for precise entry executions. By default, “LongTermPositionBuilding” option (Image – 15) selected which will show your chart like Image – 1. But if you have selected, “ShortTermTrading” option (Image – 15), your chart will look like Image – 2; where you will have additional plots like daily percentage change of price on top-right corner marked with white up arrow and you will have a info bar with “Get Ready Countdown” and “Entry Ready Countdown” information at the center top of the chart (shown with red up arrows in Image – 2). If you want to know how these information are used for trading, please watch the tutorial video above.
Image - 3 (Click to ZOOM)
Image - 4 (Click to ZOOM)
Image - 5 (Click to ZOOM)
Image - 6 (Click to ZOOM)
Image - 7 (Click to ZOOM)
Image - 8 (Click to ZOOM)
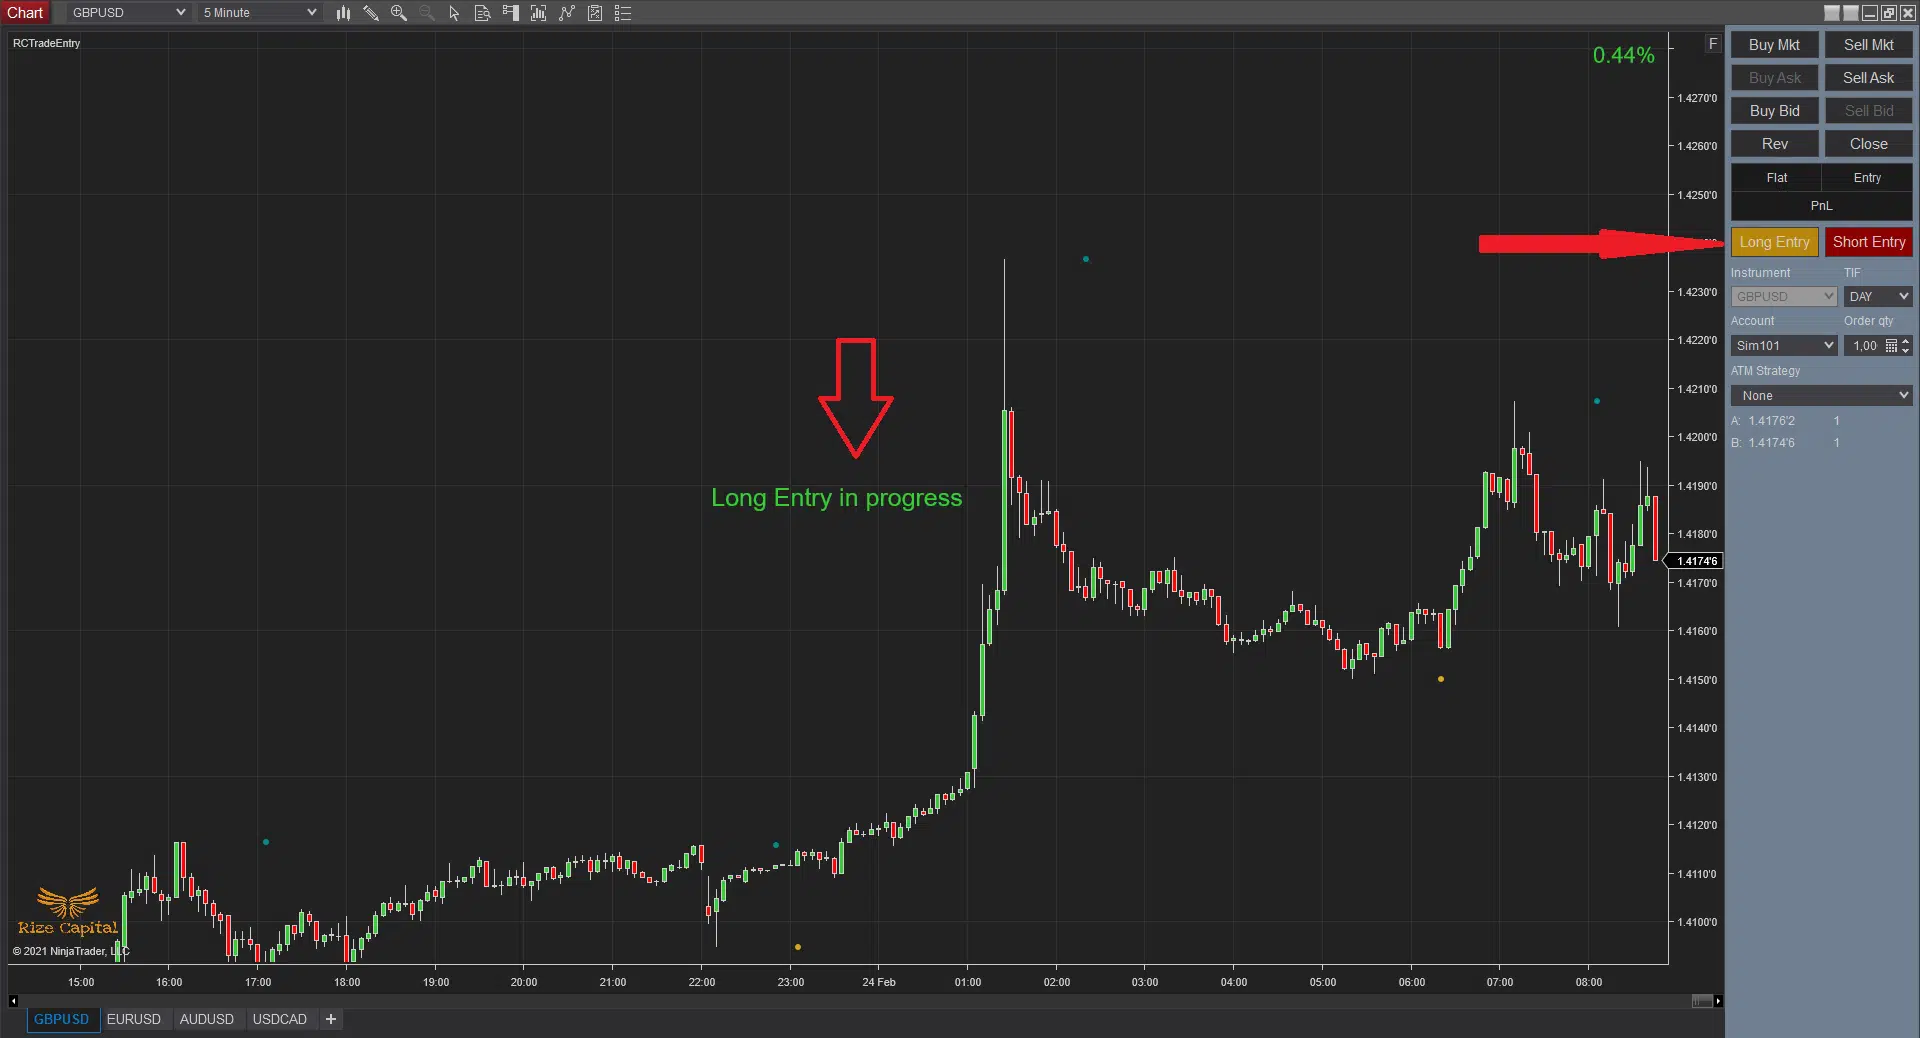
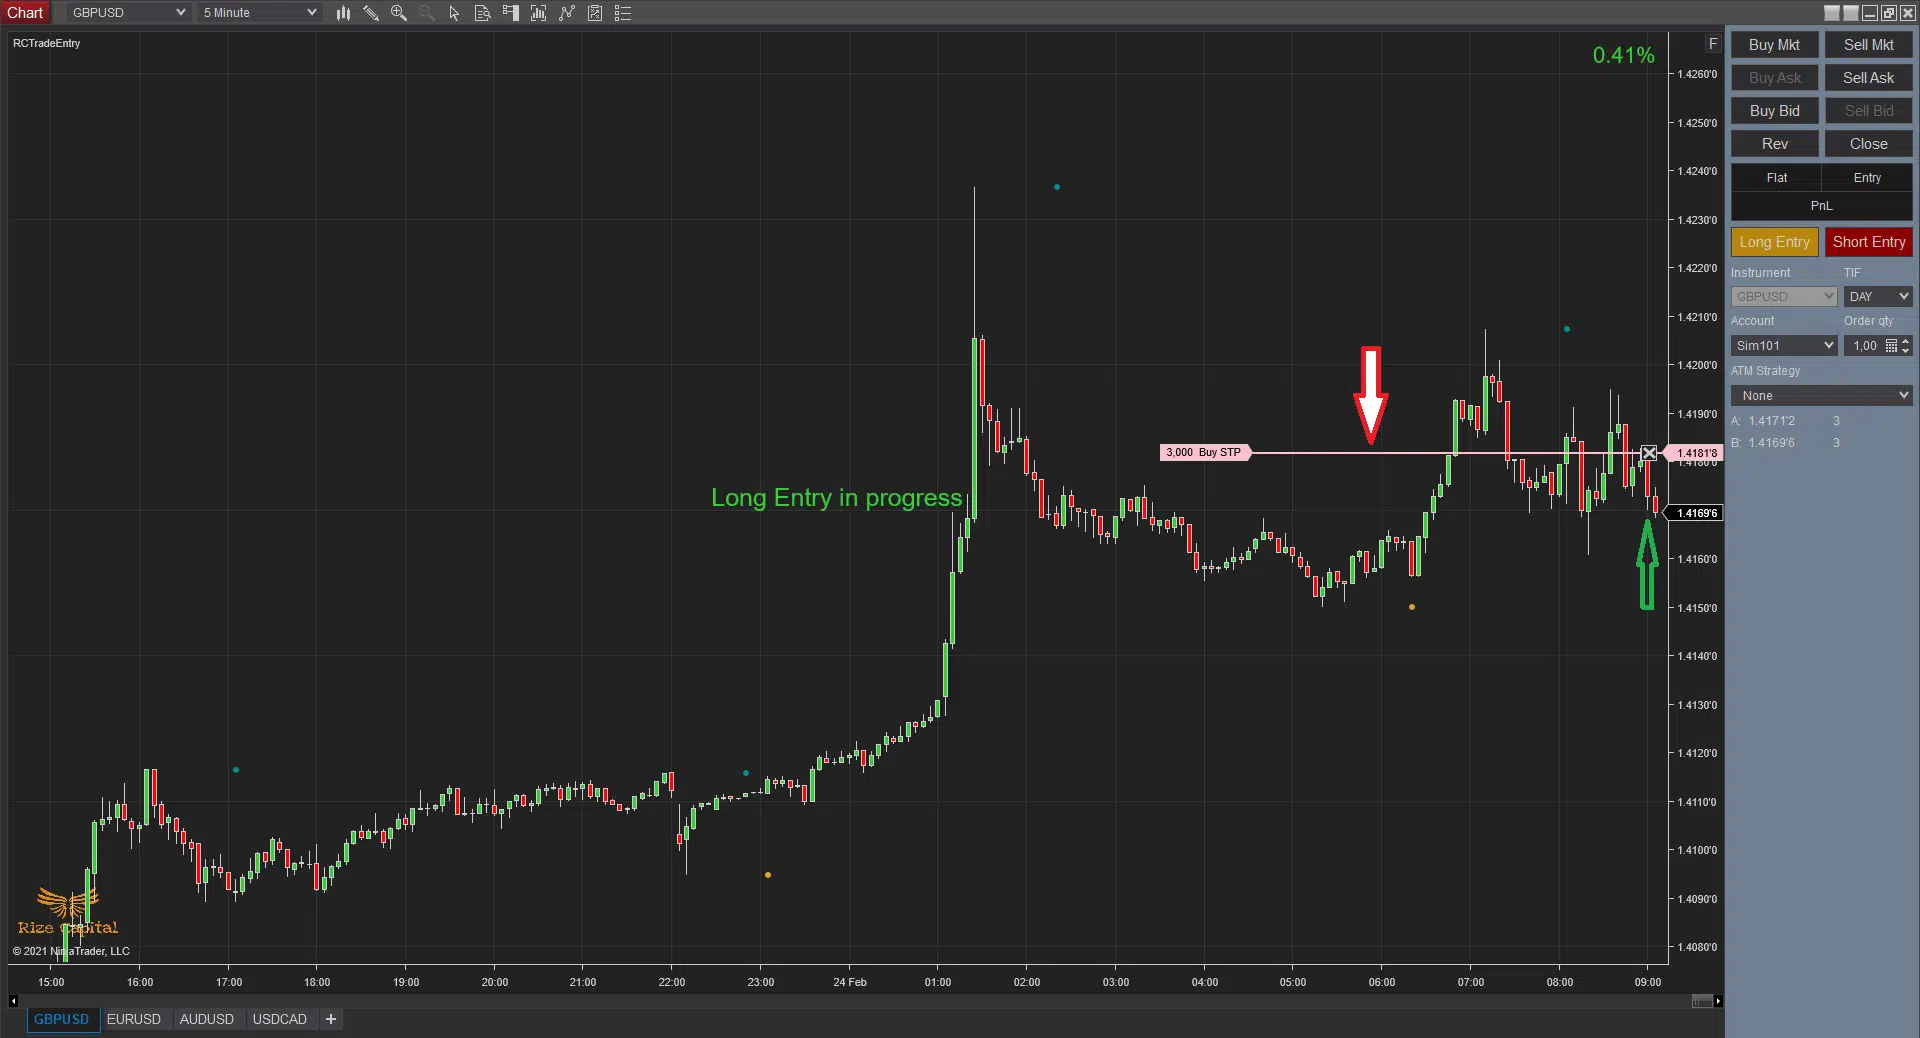
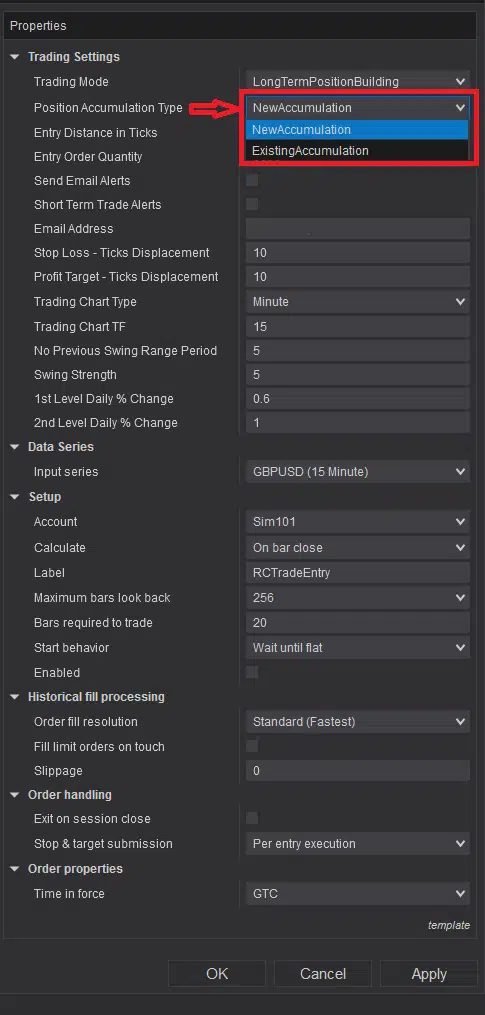
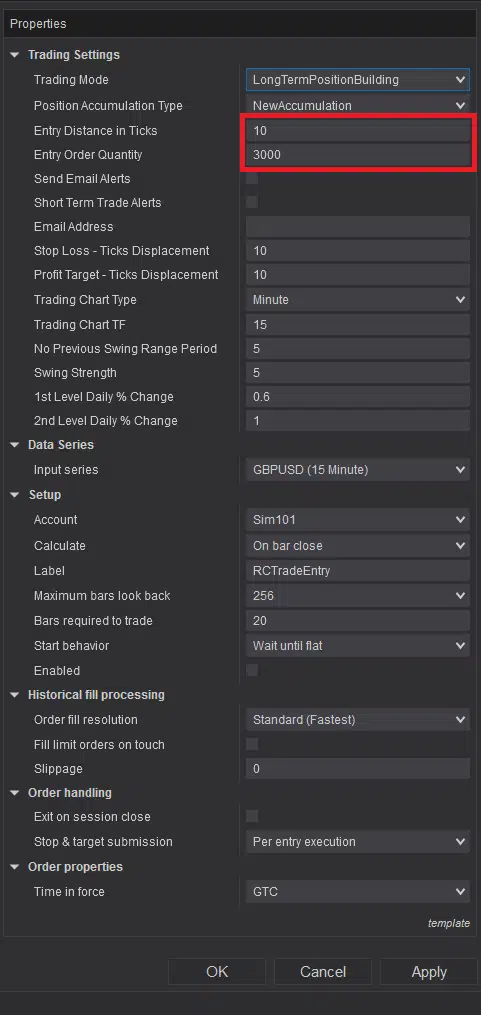
If you have selected “LongTermPositionBuilding” option and “NewAccumulation” option (Image – 16), then strategy is running for a new position building mode. That is, if you press “Long Entry” button (Image – 3, shown with red right arrow), this strategy will plot text “Long Entry in progress” (marked with down red arrow, Image – 3). It means, strategy is searching for best Long Entry conditions. Automatically when that conditions are met, it will place pending order for Long Entry at a distance selected in “Entry Distance in Ticks”(Image – 17 below and like it shows on Image – 4, down red arrow). Quntity will be determined by user input in “Entry Order Quantity” option in settings shown in Image – 17 below as well.
Now, this pending order will be placed based on the distance discussed above above or below latest closed bar on chart and will keep trailing until executed. At any point you don’t want to enter, you can press chart trader “Close” button or manually close the pending order. Whilst there is no pending order, but Long Entry in Progress and you don’t want to enter now; then simply click on the “Long Entry” button, that will stop the process.
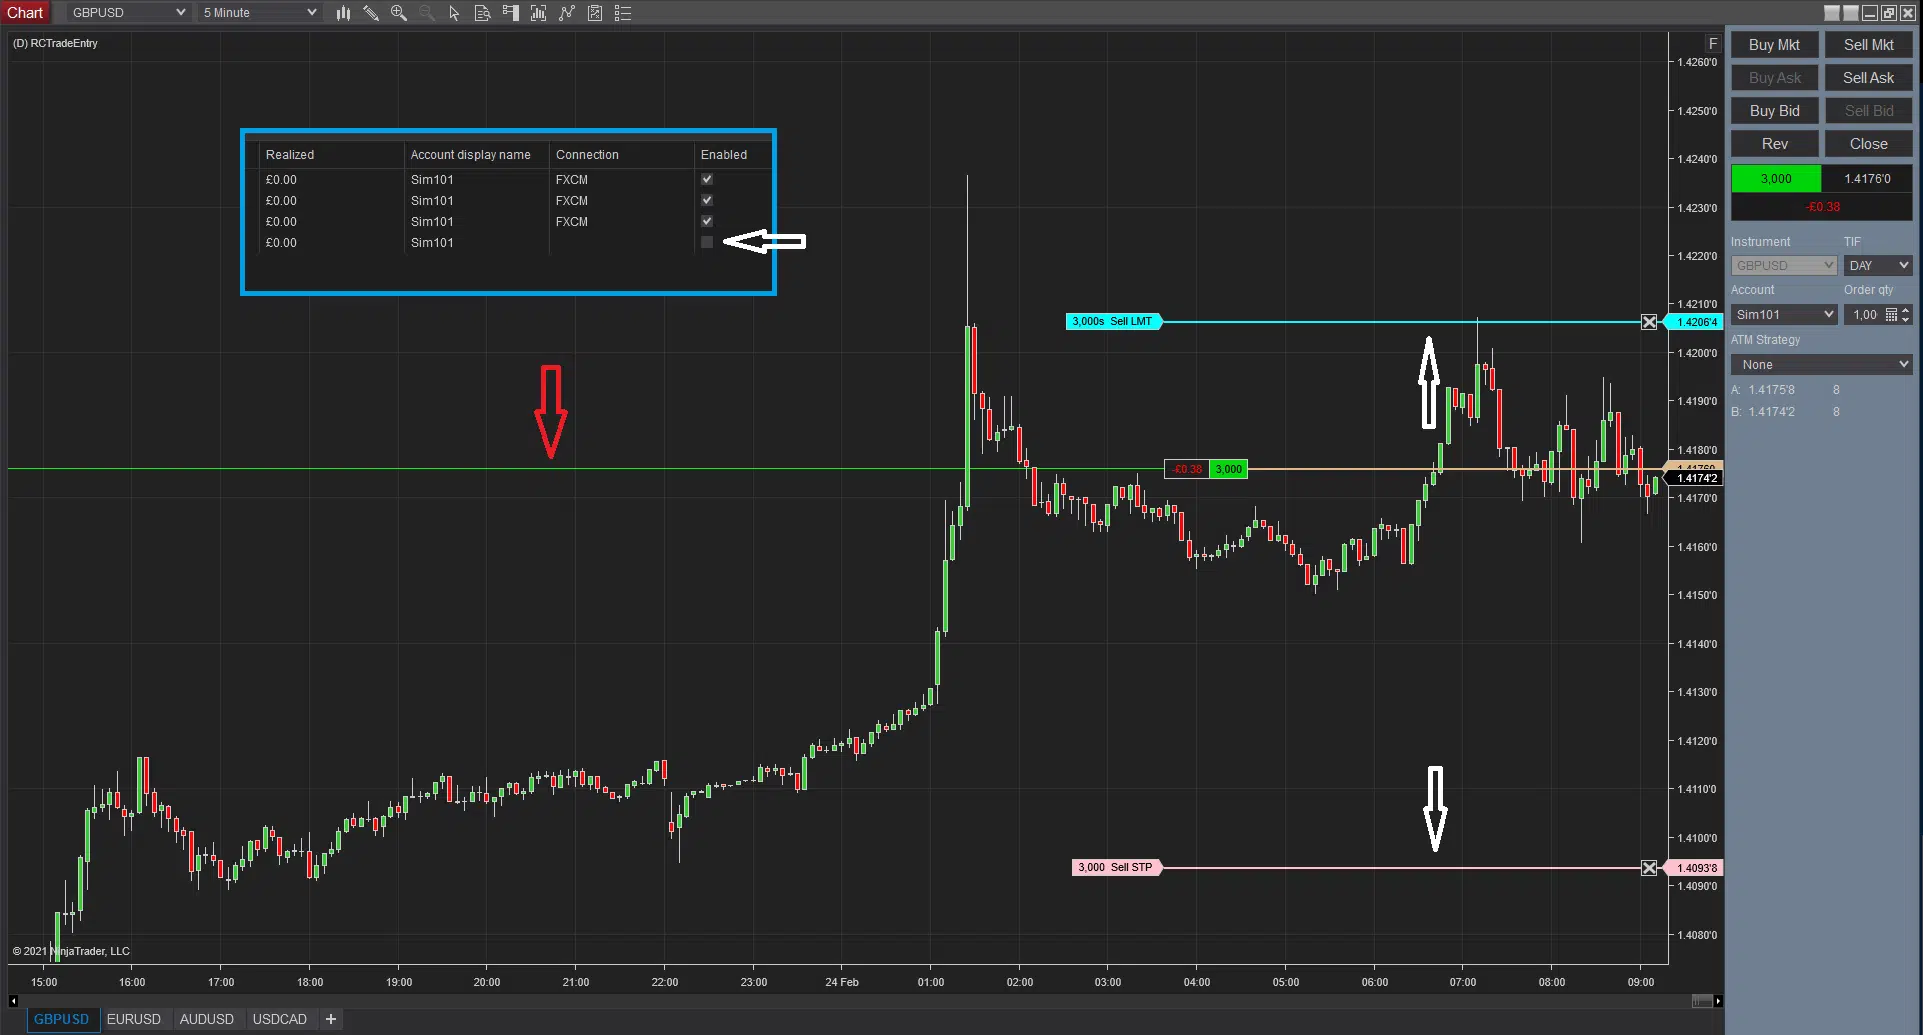
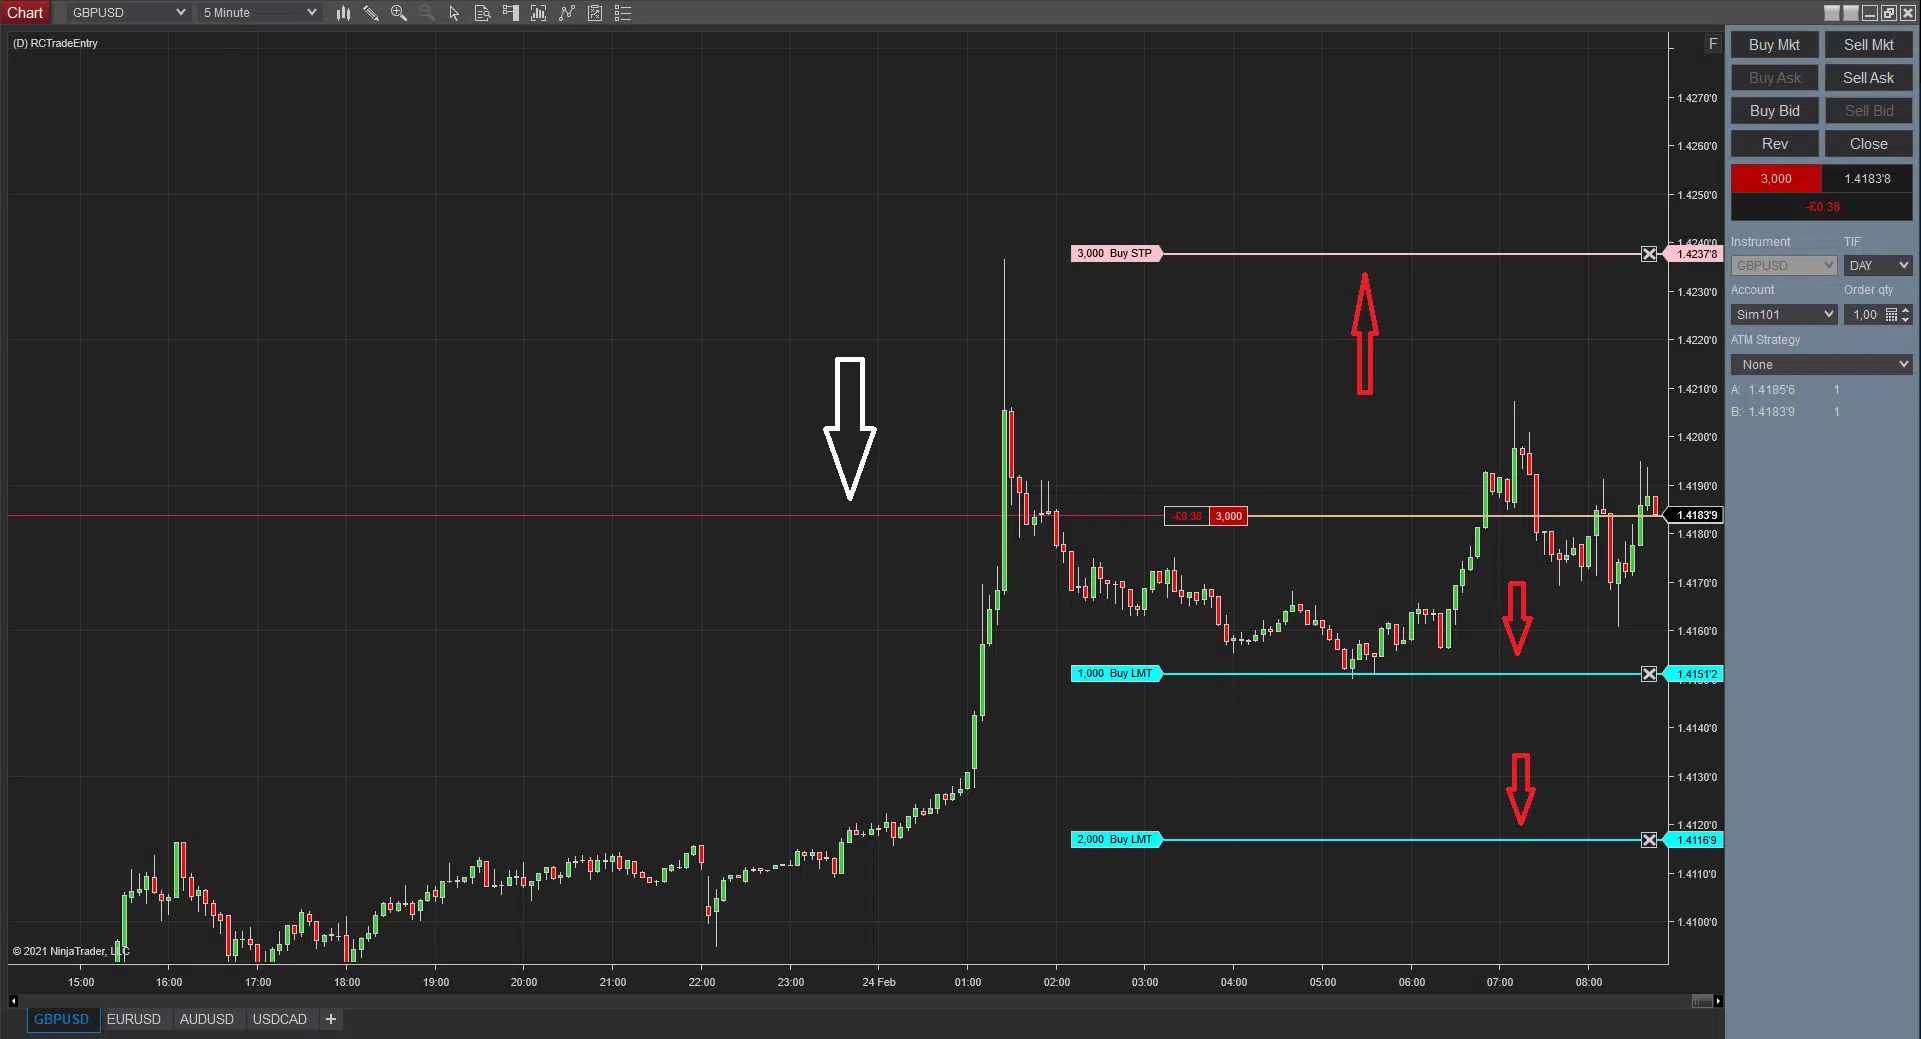
If pending entry order is executed, it will disable the strategy (shown in Image – 5 with Sky Blue rectangle and white arrow). At the same time it will place Green Line on the chart (Image – 5, down red arrow) to show you at what price your entry was executed. It will also place Profit Taget and Stop Loss of the same quantity of your filled position (shown in Image – 5 with white up and down arrow). Now all profit targets and Stop loss orders are placed based on swing highs lows of selected “Trading Chart Type” and “Trading Chart TF” (Image – 21 below) and our algorithm. If you want you can move them as you wish to find more suitable position, if needed.
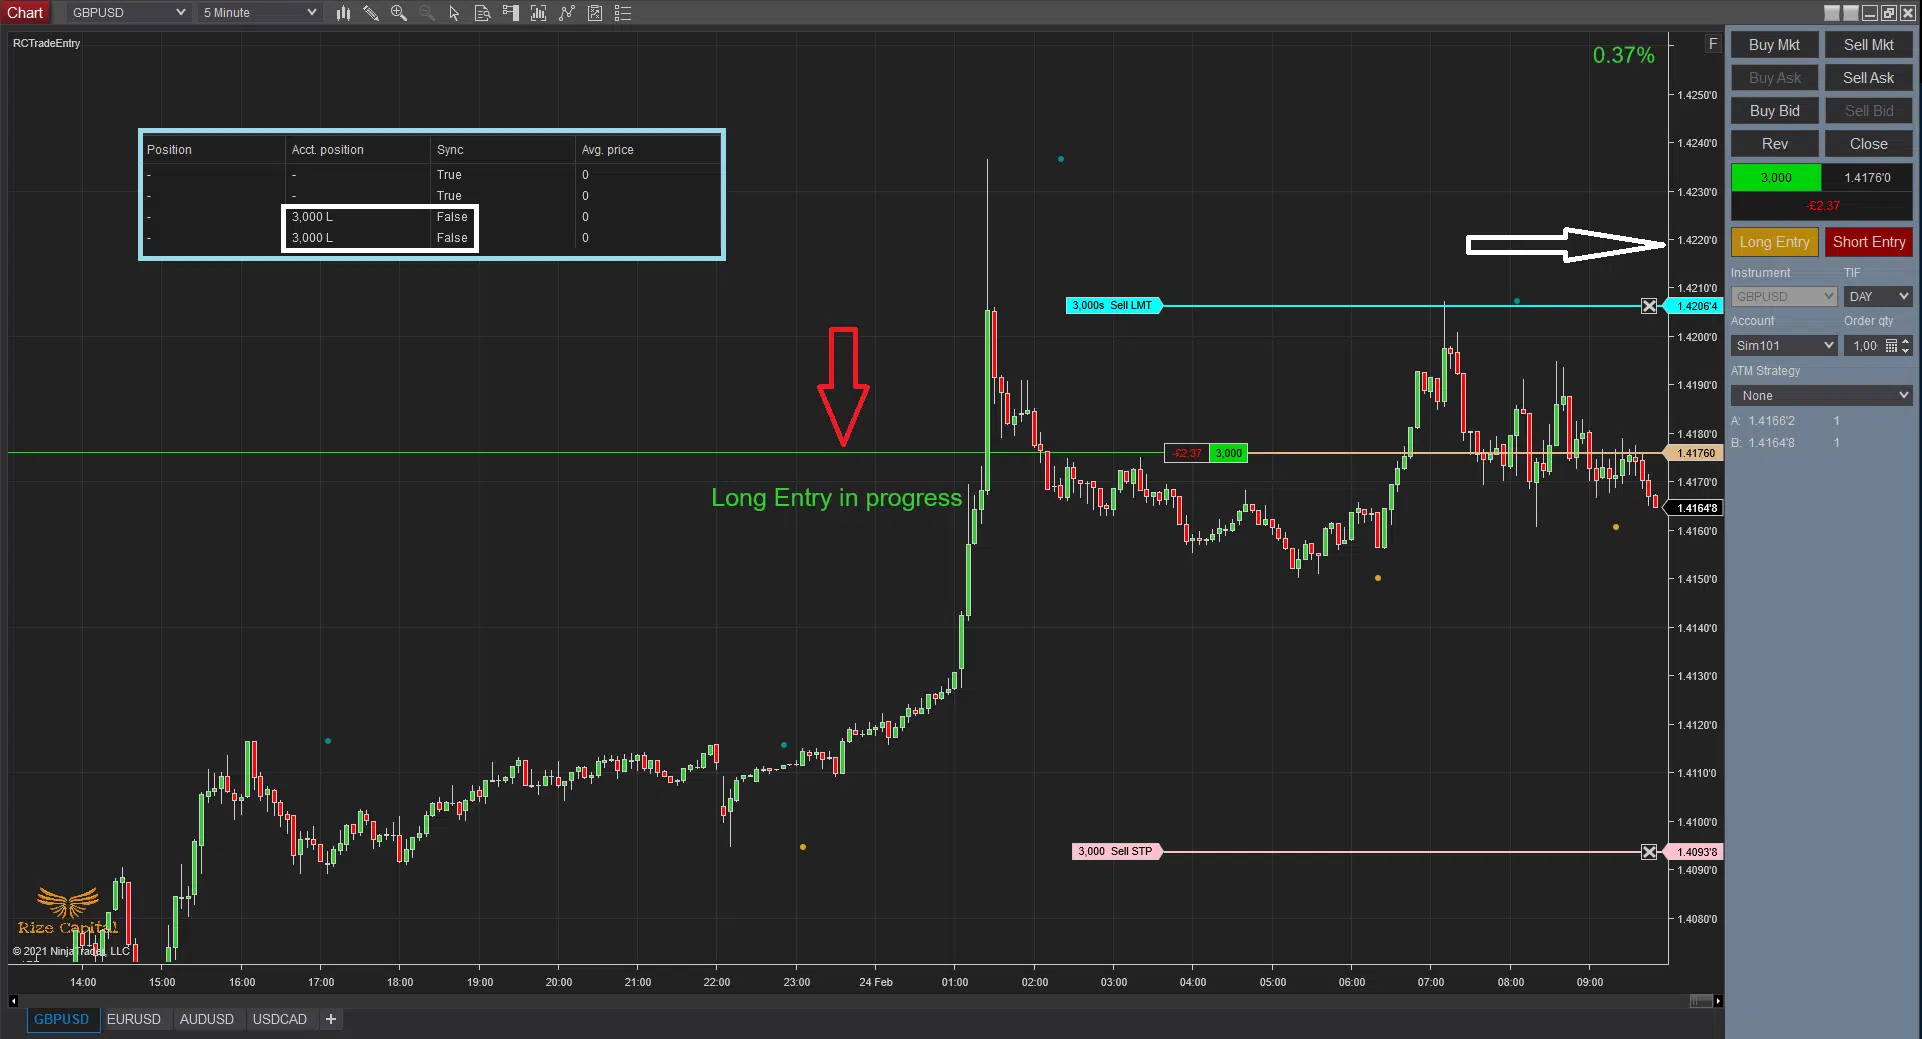
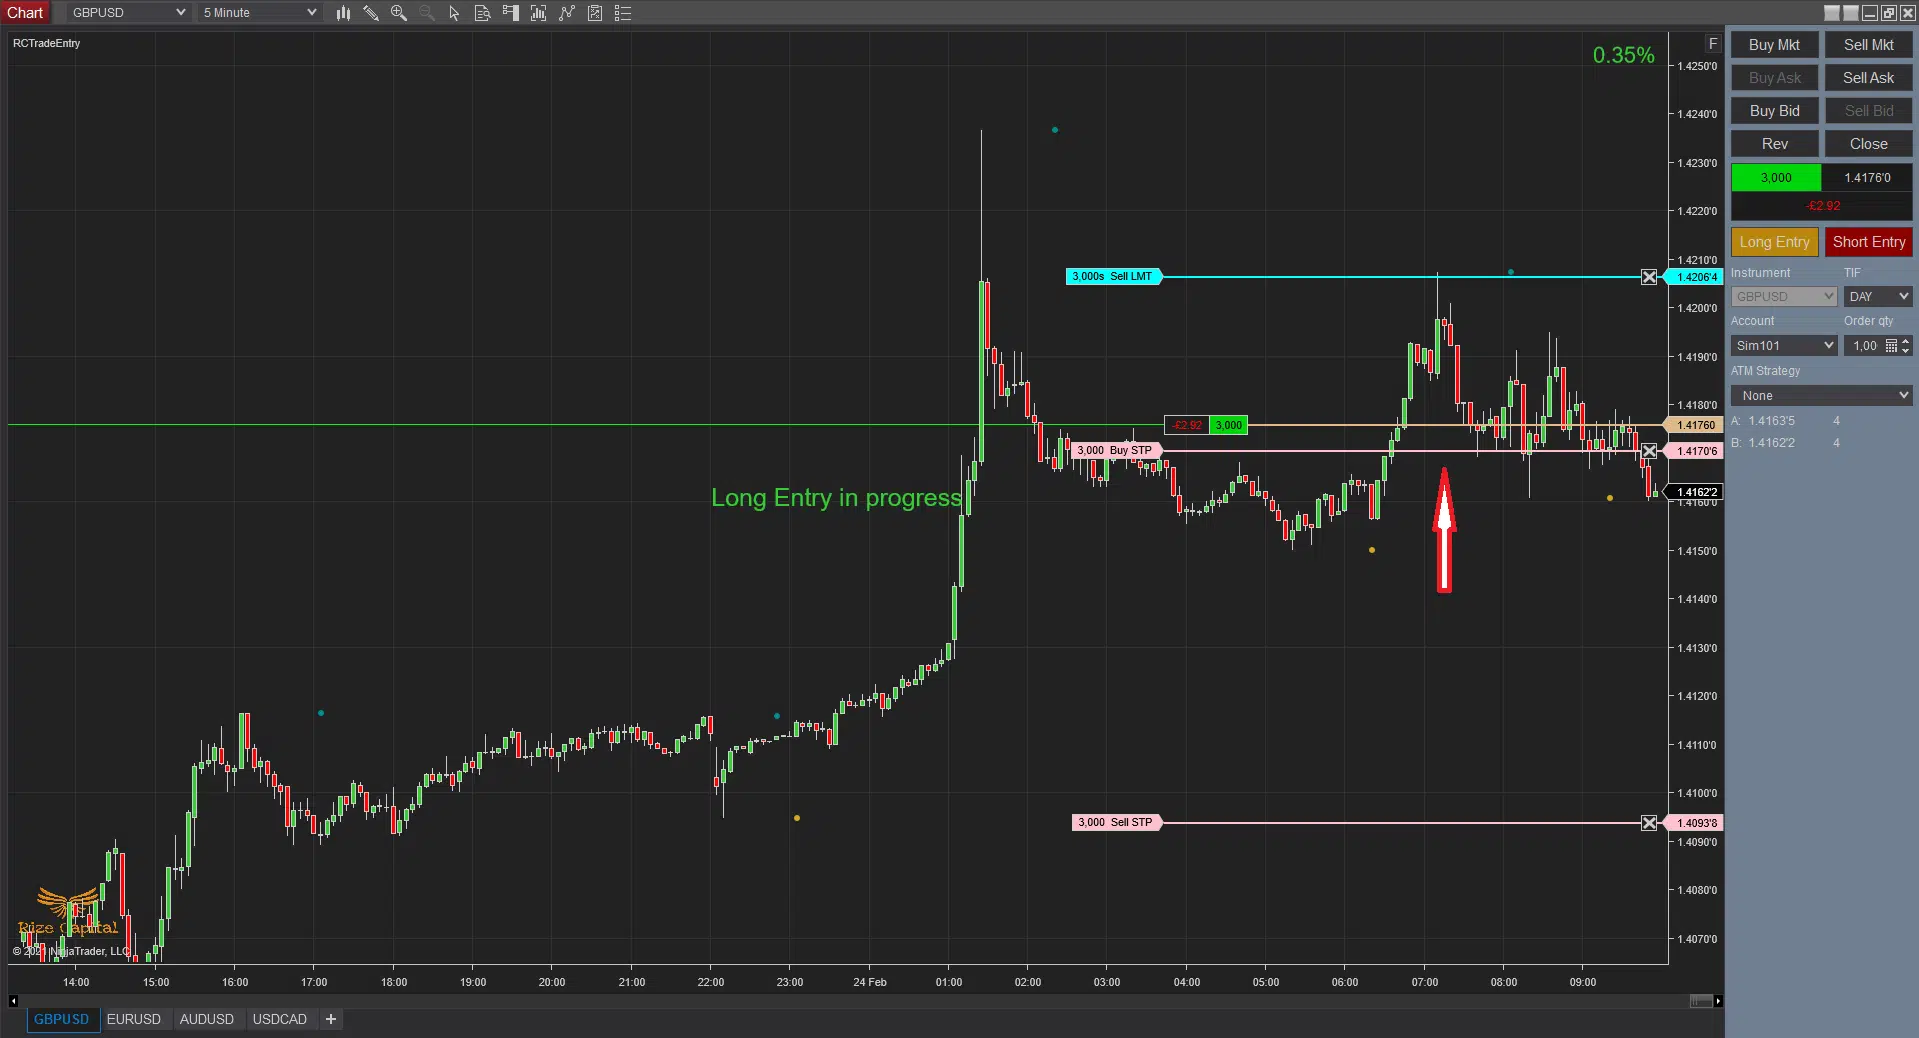
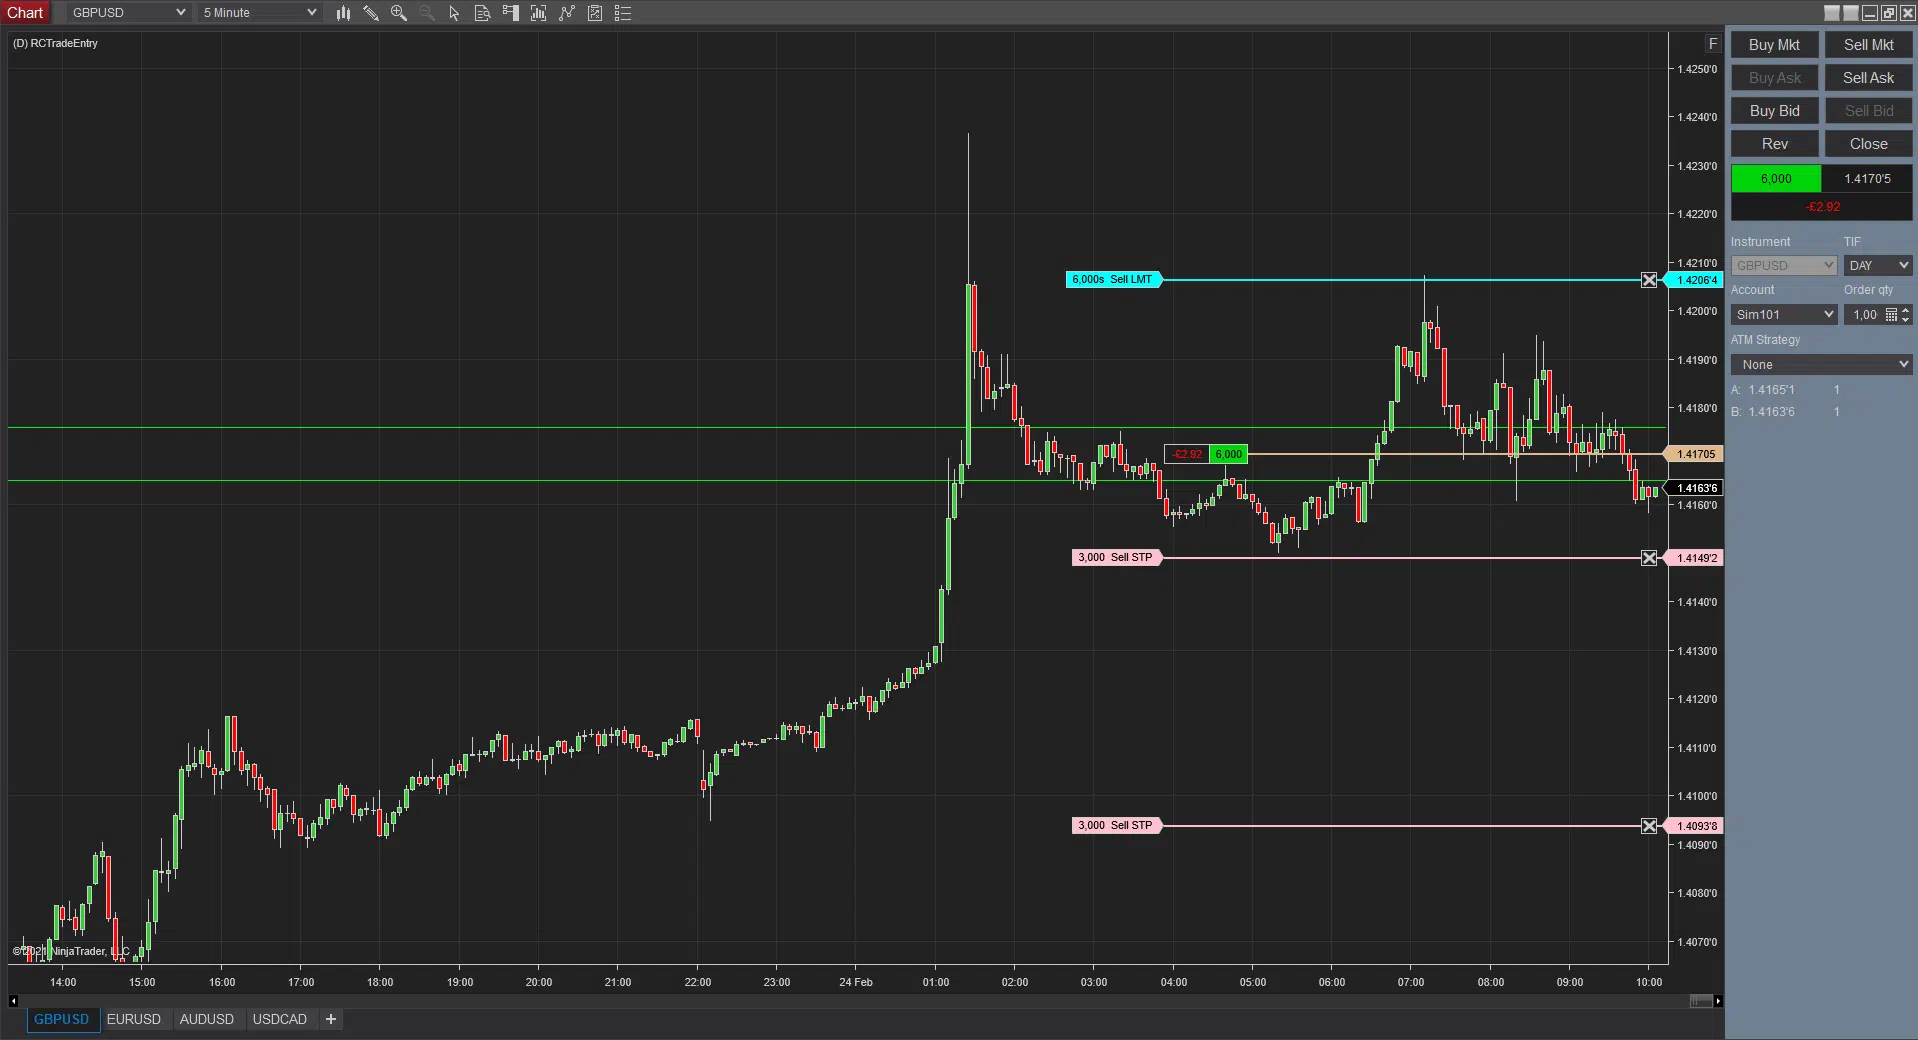
Now, if you are building on an existing position and have selected “ExistingAccumulation” option (Image – 16) and enabled your strategy, it will keep the previous entry lines to show you where your previous entries took place. But you will see in NinjaTrader 8 “Strategy Tab” sync column ‘False’, don’t worry about it; it will not have any impact on this strategy. Now if you want to add to your existing Long position, simply press “Long Entry” Button (Like Image – 6), it will start the entry process previously discussed and will execute accordingly (Image – 7 & 8). When multiple positions executed like above, it will draw same number of lines where entries were executed (Image – 8). But if you change the settings to “NewAccumulation”, it will remove those execution lines and start fresh; as you have also started a new accumulation.
Image - 9 (Click to ZOOM)
Image - 10 (Click to ZOOM)
Image 9 & 10 shows, how short entries are executed. It is exactly similar processes, but opposite. You need to press “Short Entry” button (Image – 9, shown with right white arrow) and when executed, it will plot red lines for execution price lines (shown with white down arrow in Image – 10).
Image - 11 (Click to ZOOM)
Image - 12 (Click to ZOOM)
Image - 13 (Click to ZOOM)
Image - 14 (Click to ZOOM)
If you select “ShotTermTrading” from Trading Mode showing in Image – 15, it will plot additional info plots as discussed earlier. You can still place Long/ Short entries for both New and Existing accumulation as you wish. But in this mode, you get some extra signals which will help you to make a decision whether to enter the market or not. These signals are mainly based on market volatility.
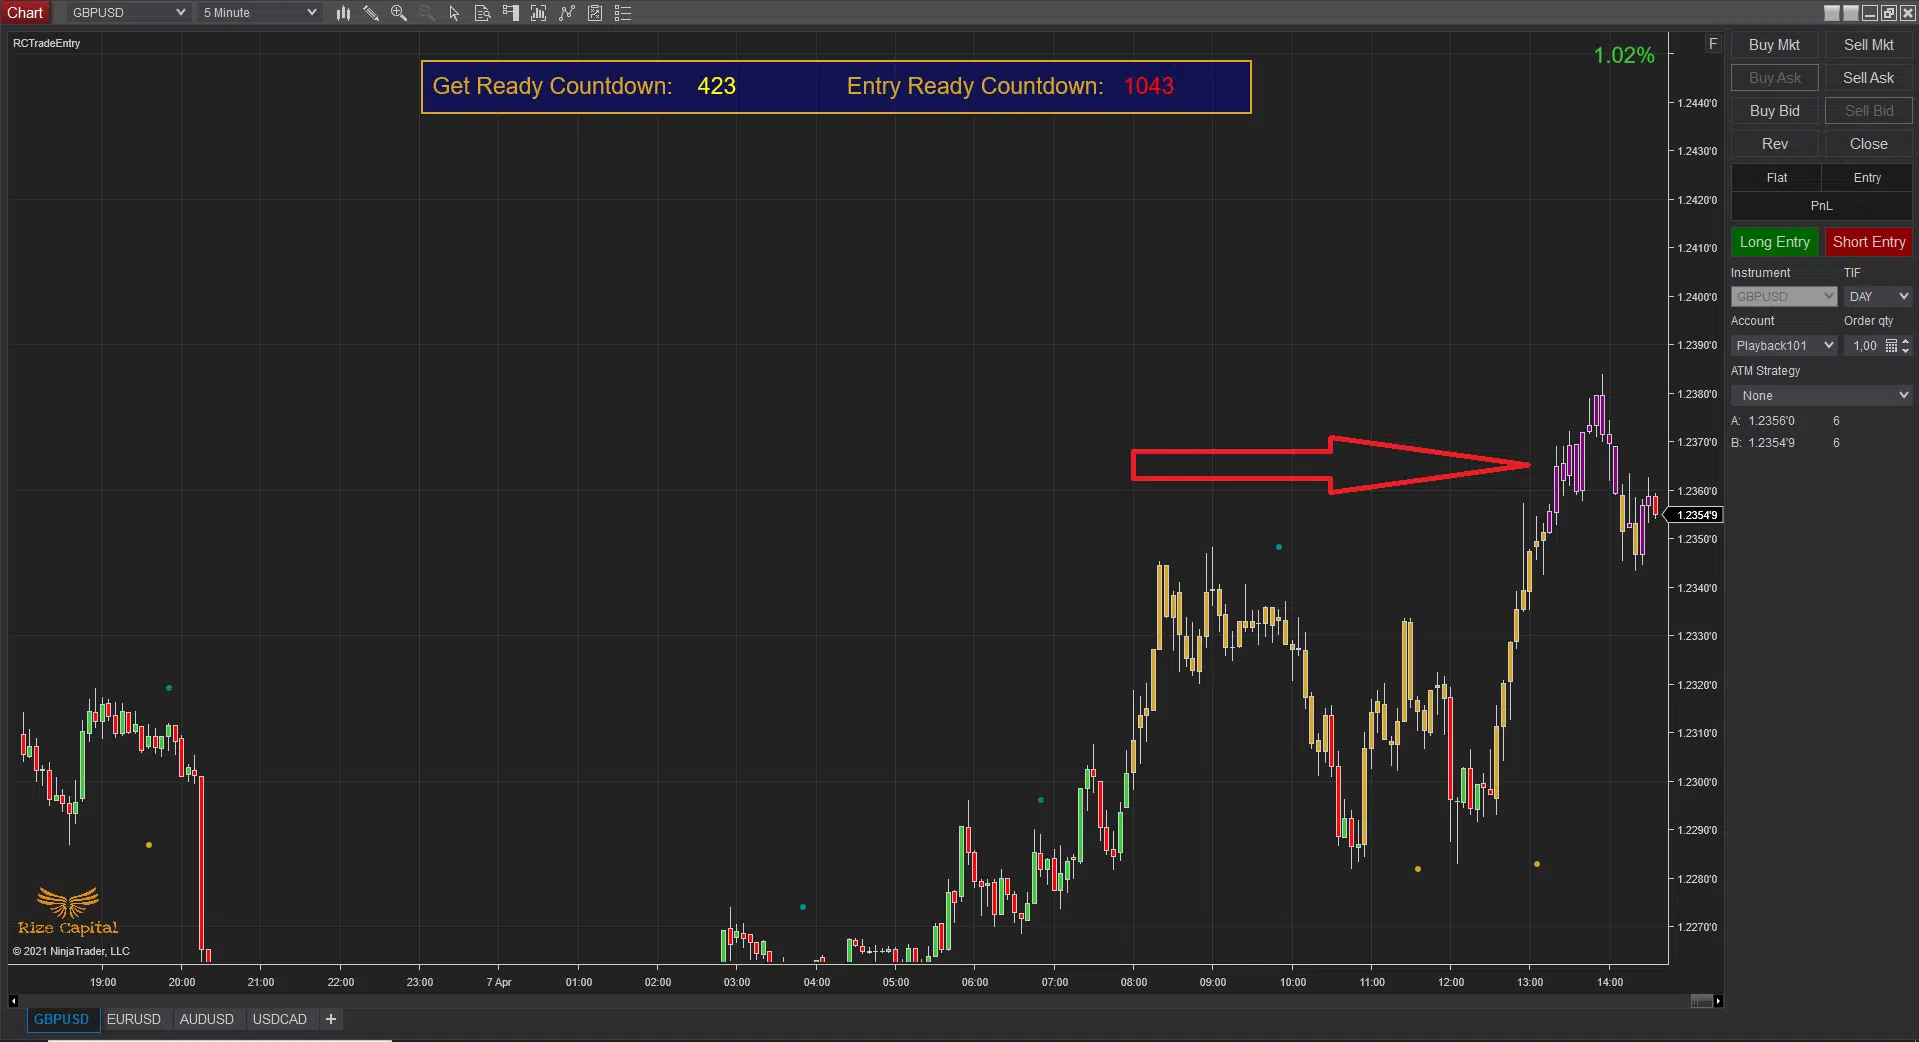
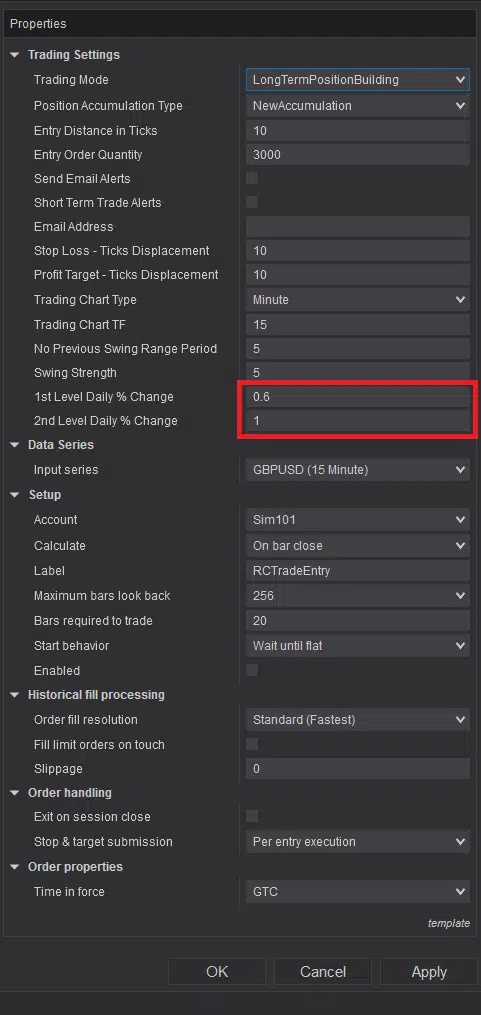
In the strategy settings you will see “1st Level Daily % Change” and “2nd Level Daily % Change” options (Image – 24, shown in red rectangle). You will need to add decimal numbers there which will than be converted into percentage and compared with current day’s daily percentage change in price. Now if the current day’s daily price change % change compared to previous day is higher than “1st Level Daily % Change”, it will start changing the color of the bar to Golden (Image – 11) and if it’s higher than “2nd Level Daily % Change”, it will change the bar color to purple (Image – 12). Now this change is considered on either side of the 0% value.
With this strategy for Short Term Trading option, you get “Get Ready Countdown” and “Entry Ready Countdown” info at the top of the chart. When the “Get Ready Countdown” number is 0 or nil, it will plot Yellow zone (Image – 13, marked with down red arrow) on your chart to warn you about potential entry conditions for your short term entry. And when “Entry Ready Countdown” is 0 or nil, it will plot a Red zone on your chart with text ‘Short term Long/Short Entry Ready’ (Image -14, marked with down red arrow). It will be your decision to make, which direction you want to start to take entry or pass this signal. But these Short Term Trade signals are generated based on current market volatility which is good for day or short term trading.
Image - 15 (Click to ZOOM)
Image - 16 (Click to ZOOM)
Image - 17 (Click to ZOOM)
Image - 18 (Click to ZOOM)
Image - 19 (Click to ZOOM)
Image - 20 (Click to ZOOM)
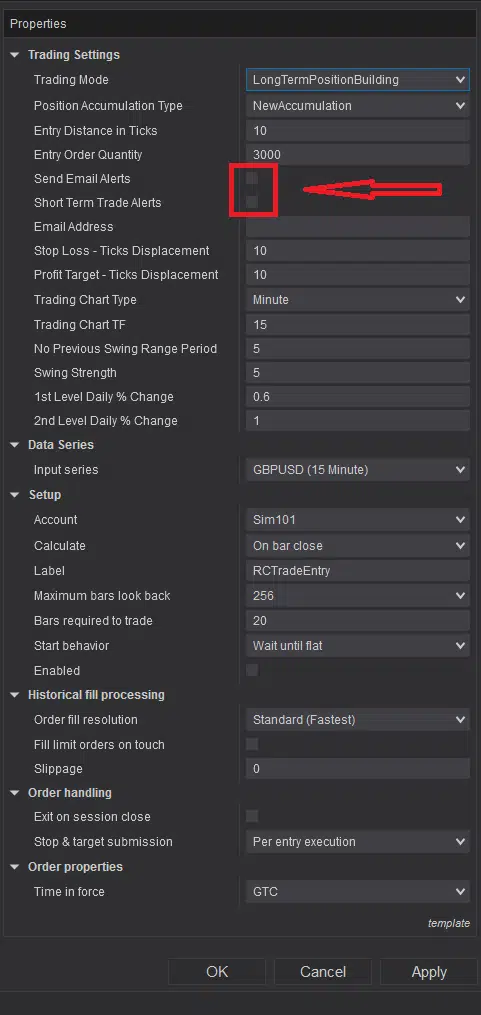
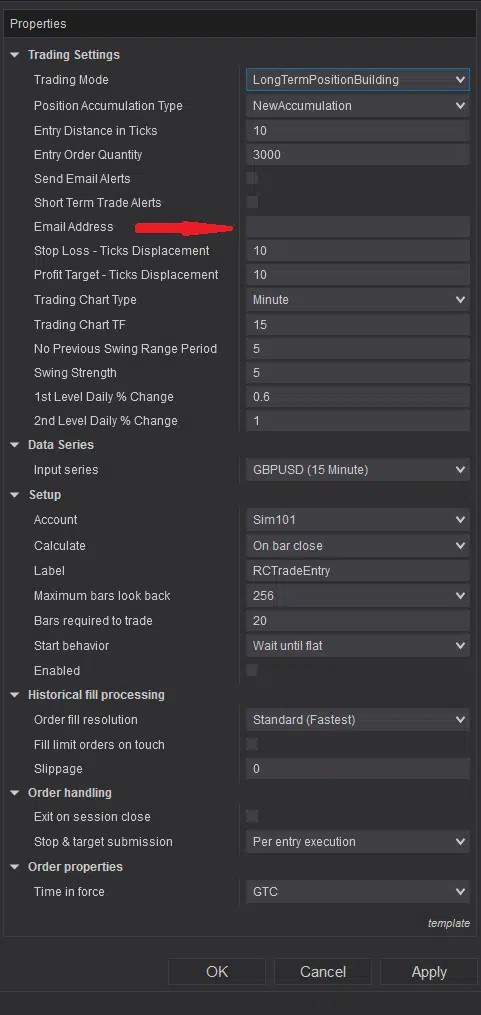
Now if you are not going to be on your trading desk or for any other reason, if you want to receive an email notification when an entry order is executed, you can simply check the box beside “Send Email Alerts” in strategy settings (Image 18). Now, if you want to get email alert for Short Term Trade Alerts for only Red Zone plots which was discussed above, you can check the box beside “Short Term Trade Alerts” (Image – 18). For both the email alert cases, you need to have an email address populated in “Email Address” field shown with right red arrow in Image – 19. Please note, to receive an email notification through NinjaTrader 8 platform from this strategy, you need to have your email share service already configured. If you don’t have or wants support, please contact NinjaTrader directly fore direction on how to configure email share service.
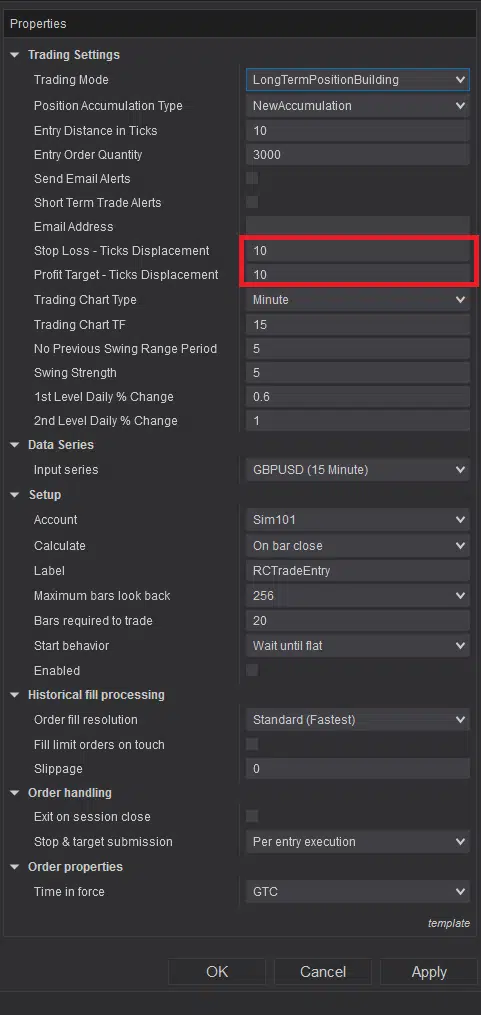
The values input in “Stop Loss – Ticks Displacement” and “Profit Target – Ticks Displacement” are the tick distance added or deducted from swing highs or swing lows when SL or PT are place immediately after an entry order execution.
Image - 21 (Click to ZOOM)
Image - 22 (Click to ZOOM)
Image - 23 (Click to ZOOM)
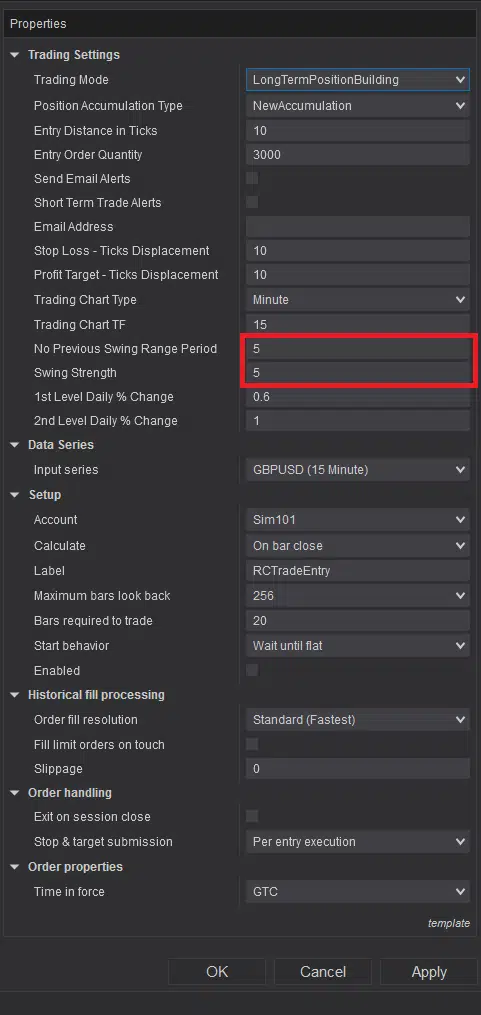
“Swing Strength” value (Image – 23) in the settings is used to calculate the swing highs and lows of the chart type and time frame selected in the settings where SL & PT are placed. If for any reason, no swing highs or lows are found to place PT and SL orders, it will place SL & PT orders as per our algorithm at a distance so that you can manually adjust them, if required. To calculate that whether a swing high or low is available or not, it will check previous number of bars of the value which you will input in “No Previous Swing Range Period” field (Image – 23).
Image - 24 (Click to ZOOM)
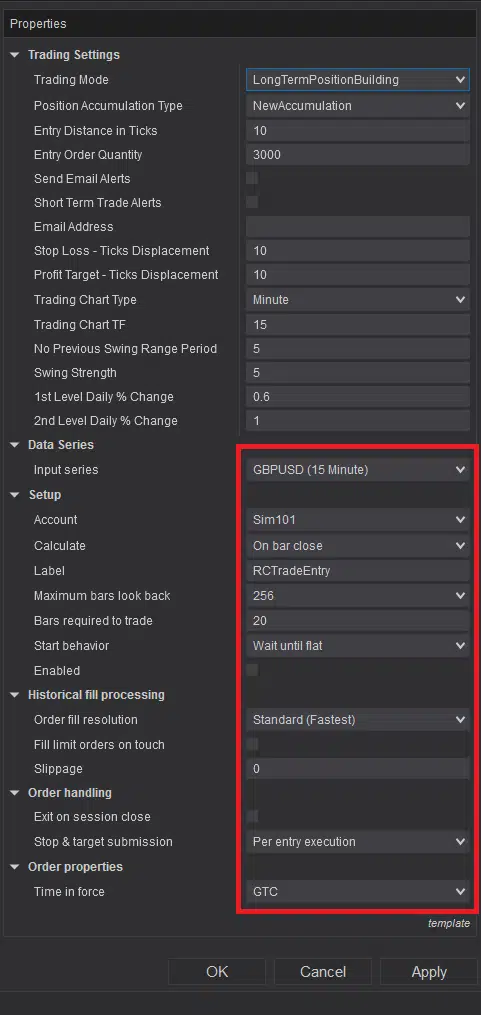
Image - 25 (Click to ZOOM)
You must not change any settings of NinjaTrader 8.0.x.x and 8.1.x.x versions default parameters which is marked within red rectangle in Image -25, apart from “Account” and “Enabled”. You can select your trading account and whenever you enable or disable, you can only make changes to the settings in this section. Otherwise, strategy may not work properly.
Warning: If you are testing the strategy on market reply data, please remove the strategy from the chart before you rewind the market replay data. Otherwise, you may get error. In case, if you do get error by mistake, remove the strategy and restart your platform. But as you cannot rewind live market, there is no warning for using it on live market.
Upgrade Notes:
Version: 5.2.0.1
This can be used on any instrument
Can be used for both Long Term and Short Term trade entries
Programmed for New Accumulation and Top up Existing Accumulation
Short Term Trading Signals based on Market Volatility
Receive email alerts to your email inbox
Auto update and announcement added
Separate Version for NinjaTrader 8.1.x.x is published