The best volume indicators are crucial to understand the current market volume insights. The trading decisions will depend on the changes in market volume insights. After all, every trader wants to make profits and avoid losing money.
Now, Price Level Volume Insights Indicator can be used on different instruments. This indicator uses different parameters to determine the current market volume insights. Moreover, the indicator also considers the historical data which is crucial to determine what the market might do next.
In this article, we will take a deeper look into the Price Level Volume Insights Indicator. We will get to understand each component of the indicator. Along with this, we will learn the overall importance of these indicator components.
So, let’s get started.
Price Level Volume Insights Indicator
Price Level Volume Insights Indicator offers the user volume insights based on each price level. The indicator calculates the volumes based on parameters; namely, Up-down tick and Bid-Ask. The parameters need to be chosen based on the instrument you are using. If your broker can supply you with real volumes, you can choose Bid-Ask. However, if you are using an instrument that doesn’t offer real volume such as forex, choosing Up-Down Tick will be a better option.
The Price Level Volume Insights indicator works very well with live market data along with historical data. And if you want to forward test the indicator on market replay, you can easily do so.
The indicator can be used for all types of instruments in different financial markets such as stock, forex, futures etc.
This volume per price indicator is a great tool for both short and long-term volume analysis at each price level.
What are the components of the Price Level Volume Insights Indicator?
There are three major components of this indicator:
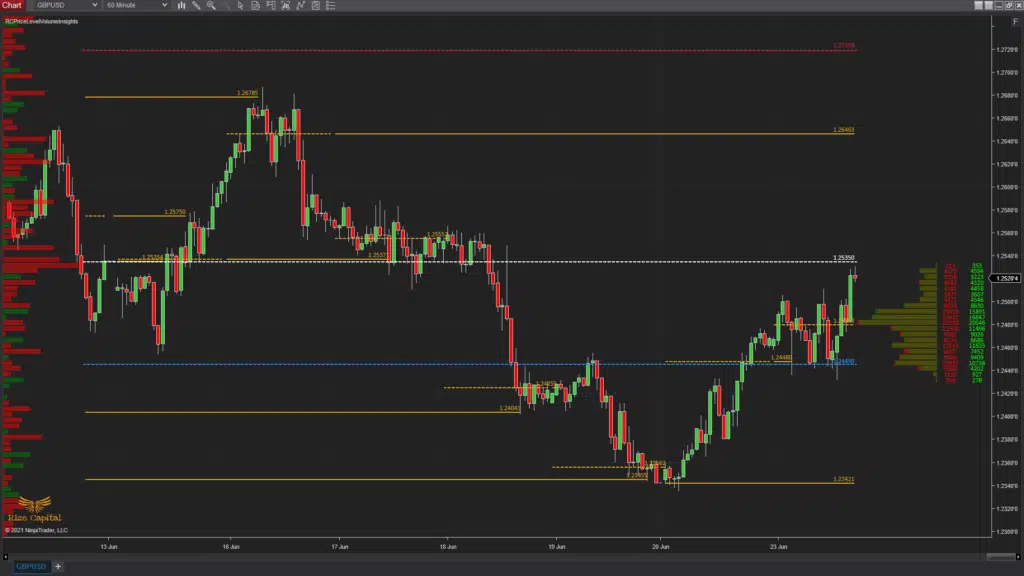
- Right Margin Volume Profile: This profile shows volumes including both buy and sell sides separately with histogram beside it.
- Left Margin Volume Profile: This profile also shows volume histogram. (However, it is different and independent from the right-side volume profile, which we will get to below)
- Daily Session POCs: These are the point of controls (POCs) depicted as golden lines on the chart. Each POC line indicates the price of the most traded volume in a particular session accepted by the traders. The lines are plotted until the price level again comes back and reaches that POC line. Once reached, it will stop plotting the said POC. However, you will find certain POCs that will continue to plot. These can be either the newer POC lines or historical POC lines. As mentioned above, newer POC line plotting will stop once the price touches the line again. In the event of this happening, the trader can expect a significant reaction around that POC line. Whether the current market price might come down or break and keep moving higher. A historical POC line will still keep plotting, if the price never touched the line or never crossed above or below it.
How does the right margin volume profile differ from the left margin volume profile?
Although both the profiles in this buy sell volume indicator will depict volume with a set of values, they are independent of each other.
On one hand, the right margin volume shows the real-time value for Bid-Ask or Up-down tick with histogram beside it with delta plot to show which side of the trade has got more control at every price level selected. If a trader wants to look at current market volume values, they must pay attention to the right margin volume.
Whereas the left margin volume shows the market volume values for a longer time frame. For example, if a trader wants to check market volume insights for 1 month, they should check the left margin profile.
In brief, the right margin volume is for short-term volume profile analysis and the left margin volume is for long-term volume profile analysis. Moreover, both these profiles can be customized by the user. The user can change the value for both based on “how many days’ or months’” values they want to see on the chart.
Apart from this, there is a difference in the choice of options for setting the parameters for both margin s’ profiles. On one hand, you can only set buy/sell volume on the right margin profile. On the other, for the left margin volume profile, you can either choose buy/sell volume or delta volume to plot the histogram. Moreover, with the left margin volume profile, you also plot value area high, value area low, and daily session POCs. (We will learn the overall importance of these values in the next section.)
What is the importance of each component of this indicator?
- Right Margin Volume Profile
As mentioned above, with the right margin volume profile, you can choose buy/sell volume. This will give two pieces of crucial information. Firstly, by choosing Bid-Ask value at a price level, you will get to know who is controlling the market, whether it is a buyer or seller. Secondly, when you choose the Up-down tick, you will get to see the changes in the buy/sell volume for each price level in real-time.
However, the calculation type will depend on which type of market you are applying this indicator to. For example, if you are using this indicator for the forex market, you should choose the Up-Down Tick calculation type. Based on this, the results in the right margin volume will be different.
- Left Margin Volume Profile
With the left margin volume profile you can choose delta volume or buy/sell volume. The main importance of plotting left margin volume is to understand the market volume in the long-term.
- Daily Session POCs
The main function of plotting Daily session POC lines is to generate historical data for traders to plot on chart to provide them leading indications for market reversals/significant reaction price levels in the future. Historical data is then used to determine whether the market will bounce back after touching the said POC price value or not.
Bottom Line
The Price Level Volume Insights Premium Indicator is a great tool to get market volume insights over a period. If you are interested in getting this volume profile indicator NinjaTrader 8, get in touch with us.
We provide custom-built indicators that can be used by beginner and advanced traders alike. Not just Price Level Volume Insights indicator, but we have a range of products for you to choose from based on your trading requirements.
Contact us now to know more.