Mega Sale 50% OFF All Products & Memberships | Limited time onlyUse code RCSALE50ALL
Explore our collection of premium NinjaTrader 8.0.x.x and 8.1.x.x indicators designed to enhance your trading experience. Besides paying for them individually, you can also access all of these NinjaTrader 8 indicators with our ALL INDICATORS BUNDLE and PROFESSIONAL TRADER memberships.
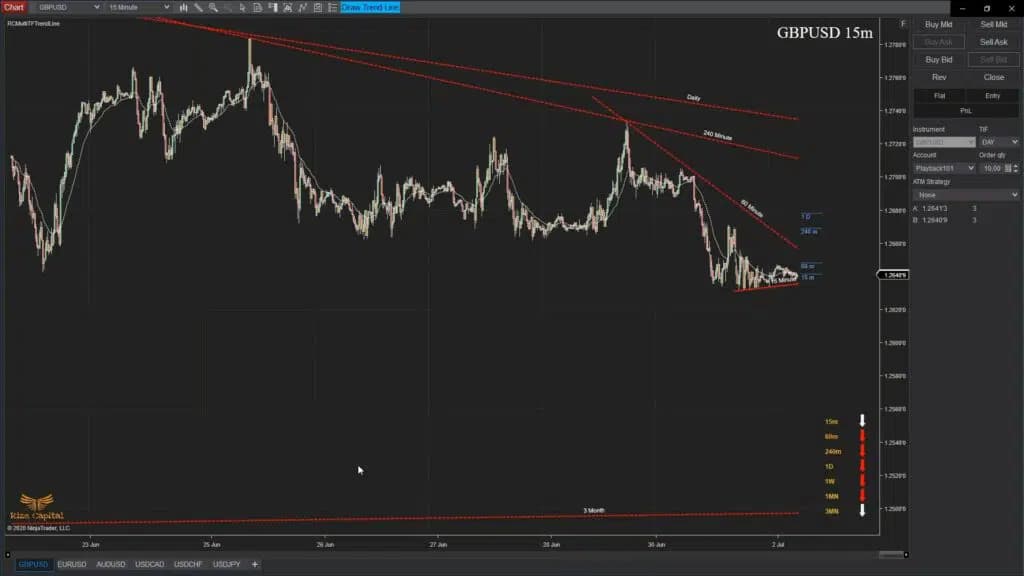
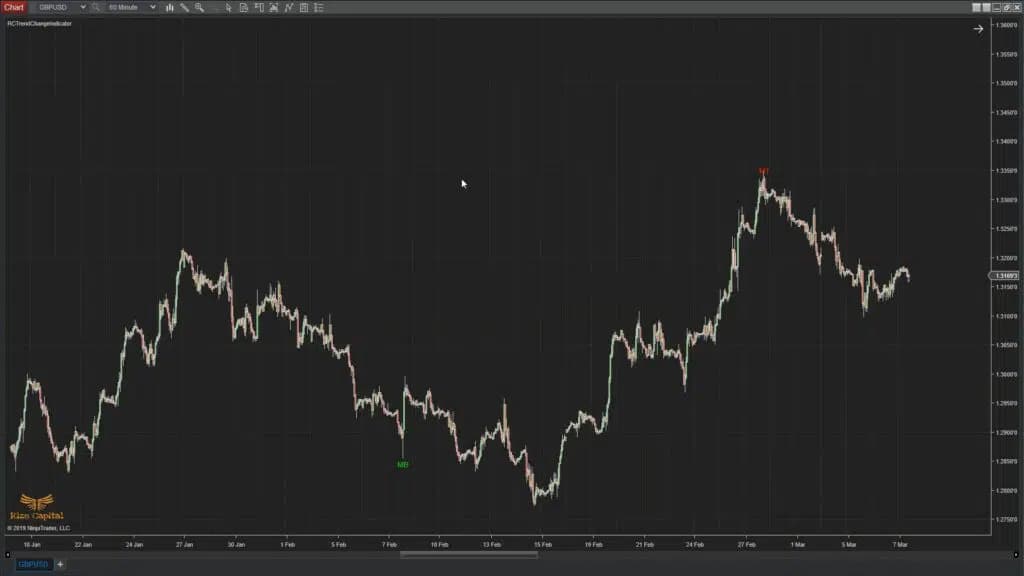
This is one of the best NinjaTrader 8 trend indicators and the most useful pro-level premium indicator, which will help you draw Trend Lines on your chart for Multi Time frames and get the entire market Trend Lines view on a single Time Frame chart. You will also have an overall idea of market flow with EMA lines of all those different TF just by being on the same chart. When Trend changes on different TFs or Trend Lines are broken, you’ll be able to spot these shifts instantly without adjusting your chart settings. Watch the video to see how it works, and then make your decision. Try this auto trend line indicator NOW.
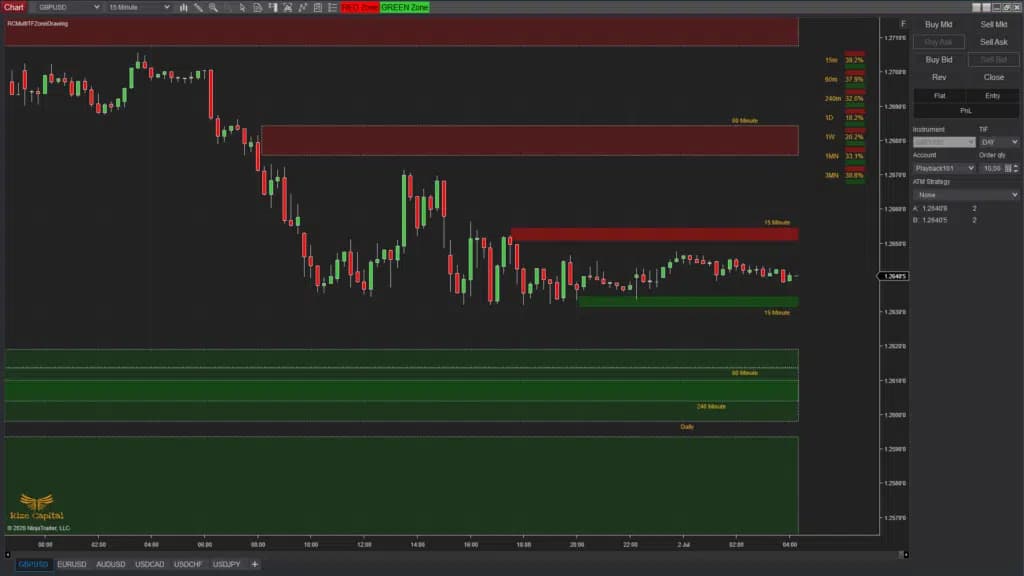
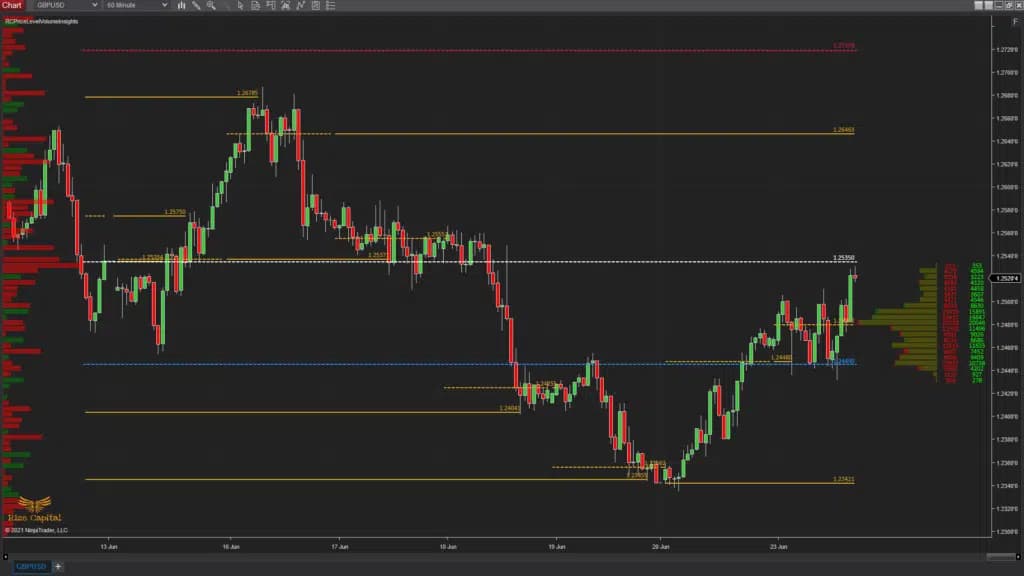
This premium NinjaTrader custom indicator allows you to draw Support/Resistance, Supply/Demand, or any other zones across multiple time frames, all while staying on a single chart. It provides complete market calculations and insights without needing to switch time frames. This indicator helps you find out where the current market price is compared to all different time frames. It is a must-have premium indicator for all professional Traders and Investors. If you watch the video tutorial, you will agree. Watch the video to see how it works, and then make your decision.
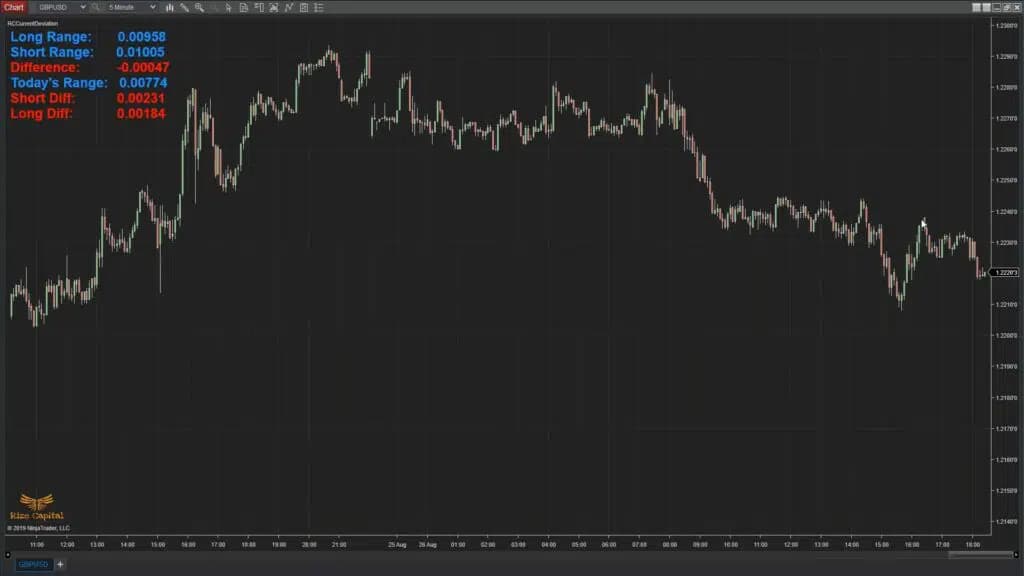
This highly useful indicator plots today’s market deviation live from the opening price. It also tracks deviation compared to short- and long-term periods. You have the flexibility to choose your preferred time periods for both short- and long-term analysis. This indicator is very useful for both day traders and swing traders. This Premium Indicator tells you whether the market is stretched too much or not compared to short- and long-term. Historically, if the market is extremely stretched, it is highly likely to reverse, and this indicator will help you find out exactly what to do when making your trading or investment decisions.
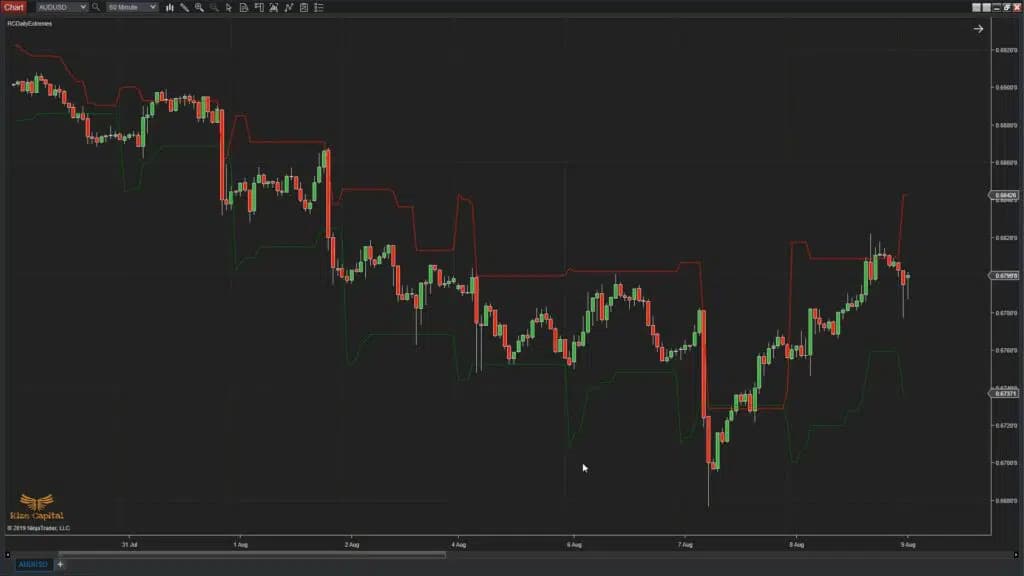
This premium indicator is highly useful for day traders but can also be applied to swing trading strategies. It plots two key lines on your chart, helping you identify where the market top and bottom are most likely to form for the day. When the market reaches the Market Top Line, it is highly likely that it's going to reverse, and the same is true for the Market Floor Line. This indicator continuously calculates and updates these levels in real time, giving you a clear view of the high-probability market top and floor for the day. Who wouldn’t want to know the market top and bottom early in the day?

